#202525 - priceactiontds - weekly update - wti crude oilGood Day and I hope you are well.
comment: Many gaps on different time frames and I only marked the ones from the daily. Next targets above for the bulls are 80 and the 2023-09 high at 82.91. I think we can see a futures gap up above 81 and then another huge pullback. Supply shock for Oil is still not there or we would not see the market pull back that much. Given the current macro risk we can only expect higher prices but the swings are too wild for me tbh.
current market cycle: bull trend but trading range on 1h tf
key levels: 67 - 83
bull case: Bulls have all the arguments on their side. Their only issue is that we are still seeing 5-10% intraday swings to both sides and only if the pull backs become smaller and we leave gaps behind, can we go meaningful higher and stay there. We have two open gaps on the daily chart but market would have to stay above 70 now to confirm them. 77 is the next target for the bulls which would be a higher high above the 2024-04 high.
Invalidation is below 70 - if we drop below, we most likely continue sideways inside the big range until we maybe get another big breakout above
bear case: US bombs on Iran. Interesting to see if we stay below 77 and move sideways. I can not see it but I obviously did not saw the 11% pullback on Monday as well. That was insane. Best bears can hope for is to move sideways and continue with the deep pullbacks. Bears can also make big money on these wild swings, which is not something seen in strong bull trends.
Invalidation is above 77
short term: Bullish but too cautious to trade it. Future gap ups were sold heavily and market has not found acceptance above 73 for the entire week. Still expecting 77 to get hit and there is no reason why we can’t see 80$ on oil over next 2 weeks.
medium-long term - Update from 2025-06-22: No bigger opinion other than “don’t be a bear here”. No idea if market can sustain the buying and stay above 70 for longer or even 80 for that matter. Too many big risks which will move the market big time.
Futures

#202525 - priceactiontds - weekly update - bitcoinGood Day and I hope you are well.
comment: Full bear mode. Bulls still trying to make bears doubt it and we are not moving fast enough but we are also not making higher highs. We are close to my validation level for the bears, which is a daily close below 100k. I do think any print above 104k would invalidate my thesis. Targets for bears today/tomorrow are 98k and if we have enough momentum we see 90k.
We are still seeing bigger tails above daily bars which means bulls are trying but since are printing lower lows for two weeks, they are failing. Bears now need to move strongly below 100k and then we can start the acceleration down.
current market cycle: trading range until follow-through below 100k
key levels: 100k - 111k
bull case: Bulls are still hopeful, that’s why we are still above 110k but the next touch could break it and I doubt many will hold long or scale into new ones there. Best bulls can get right now is to go sideways for longer and stay above 100k. I mean… Staying above 100k is as bullish as it get’s if you be honest.
Invalidation is a daily close below 100k - next support below 100k is 98k and then comes 93k
bear case: Bears need to print below 100k and close below. That’s the whole story. Next targets below are then 98k and 93k, breakout-re-test prices. Until they achieve that, it’s slightly higher probability that we move sideways but this market won’t be able to hold above 100k if big indexes sell-off.
Invalidation is above 107k
short term: Bearish but could wait for confirmation below 100k. I doubt we get above 107k again and continue inside the range
medium-long term - Update from 2025-06-22: Daily close below 100k is confirmation. First target below 100k is 97k the breakout retest and after that is the 50% retracement around 93k. I have no bullish for the next weeks/months. Once the gap to 97k closes we are likely in a bear trend again and I expect to hit at least 85k over the summer.

USD/CAD Trap in Progress? Smart Money Flips BearishUSD/CAD is currently in a rebalancing phase after the strong downside correction seen over recent weeks. Following a rejection in the 1.3900–1.4000 supply zone, price retraced down to a major demand area between 1.3500 and 1.3650, where it has shown a notable bullish reaction. The pair is now trading at 1.3734, and multi-frame data suggests we are in a transitional phase—not yet a confirmed bullish trend reversal.
COT Report – Institutional Positioning
The latest Commitments of Traders data (June 10th) reveals critical signals:
Commercials (hedgers and large institutions) have aggressively increased their long exposure on CAD, adding +27,999 contracts. This indicates strong expectations of Canadian dollar appreciation—bearish implications for USD/CAD in the medium term.
Non-Commercials (speculators) reduced their short CAD exposure by -14,319 contracts, signaling that speculative players are starting to unwind long USD/CAD positions.
Overall, the net shift shows institutional sentiment turning bearish on the pair, potentially pointing to a deeper downside once the current technical pullback completes.
USD Index COT – Dollar Momentum Weakening
On the USD Index, Non-Comms have added +1,279 long contracts, but positioning remains moderate. Commercials are flat, suggesting the dollar lacks strong bullish backing. This makes any sustained USD/CAD rally structurally fragile.
Retail Sentiment
Retail traders are 57% short and 43% long on USD/CAD. Although not extreme, this imbalance suggests confidence among retail participants in a bearish move—often preceding a short-term upward squeeze before an eventual trend continuation.
We could therefore see price move toward 1.3900 as a liquidity grab, setting the stage for a larger reversal.
Technical Analysis – Outlook
Key highlights:
A strong bullish reaction occurred from the 1.3500–1.3650 demand zone, previously well-respected.
The weekly RSI is still below the 50-level but is turning upward—momentum is improving.
Price structure shows room for a pullback to the 1.3900–1.4000 supply zone, which aligns with higher-timeframe order blocks.
This zone remains a critical resistance, and unless the macro and positioning context changes, a renewed bearish impulse is expected from this area.
Trading Outlook
The current picture presents a tactical short-term long opportunity, followed by a potential structural short setup.
📈 Scenario 1 – Bullish Pullback (in play):
With price above 1.3700 and consolidating, there’s space for a rally toward the 1.3900–1.4000 supply zone. Ideal for short-term targets.
📉 Scenario 2 – Structural Short (priority bias):
Should price reach 1.3950–1.4000 and show bearish confirmation (e.g., engulfing, doji, rejection on H4/H1), this would be a prime area to initiate swing shorts, targeting 1.3600 and eventually 1.3450.
✅ Final Bias: Structural Bearish – Corrective Bullish
Watch for potential false breakouts above 1.3800–1.3900 to liquidate retail shorts before a more meaningful downside move. The sharp increase in commercial net long CAD positions supports a bearish USD/CAD bias for the coming weeks.

ES - LONG @ London OpenBuyers from 6000 options level, floor. We've got weak liq. above to squeeze. After London open FIND on smaller timeframes the auction/finished business (risk) and test of pivot/poc (entry)

SELL USOILIt’s been a while since I last posted about American market.
You can sell USOIL, the target is the daily Liquidity high and the stop is at the PVH of the reversal.
Follow for more!

2025-06-18 - priceactiontds - daily update - daxGood Evening and I hope you are well.
comment: Market has not traded above prior day’s high for 9 sessions. Can we do 10 and accelerate down? I would love it but it’s getting a bit unlikely without a better pullback. I can not see bulls coming back from this tbh but I have been wrong about this before. Bears need a big breakout below and accelerate down. Bulls some higher highs to continue sideways between 23000/24000.
current market cycle: broad bull channel on the weekly chart. Daily chart is in a trading range 23000 - 24500
key levels: 23000 - 24000
bull case: Any higher high will do and could lead to couple of legs up for 24000. Whole story because right now they don’t have any arguments besides having support around 23300 and bears unable to make meaningful lower lows. Time-wise we have been going down for 9 sessions and at some point bulls will give up hope and we flush down if they don’t reverse strongly over the next 1-2 sessions.
Invalidation is below 23000.
bear case: Clear target for bears is 23000 and leaving behind a decent gap 23700-24000. They are favored since we are only printing lower highs. Bears have to keep it below 23400 or risk hopeful bulls buying for 23505 which was last week’s close and if we close this week above it, it will be a weekly bull bar and likely a doji. That’s neutral and good for bulls. For this to go down, bears have to print a weekly bar closing on it’s low and below prior support.
Invalidation is above 23500.
short term: Neutral around 23300 but I think we can do 23000 this week. Don’t bet on the breakout before it happens. Shorts closer to 23500 are likely good, unless strong bulls overwhelm the bears tomorrow.
medium-long term from 2025-06-15: Bull trend has most likely concluded. Long term shorts are fine. Stop has to be at least 24508. I see it 70% or more that we will see 22000 before end of August.
trade of the day: Selling anything close to 23400 and buying anything at 23300. The early pump before EU open was a nasty bull trap but shorts with stop above yesterday’s high 23567 were the obvious trade.

NQ Bulls Teasing a Breakout – But Watch That 4H RSI Divergence We’re at a decision point here on NQ.
📌 Bullish case: We’ve got a clean inverse H&S on the 5-min sitting right on the weekly pivot. If we reclaim the daily pivot and the 30-min VWAP (red line), we could get a squeeze toward 21,960, where prior supply sits.
📉 Bearish case: A break below 21,650 cracks the head and confirms downside toward 21,480.
⚠️ Don’t ignore that 4H RSI divergence. Momentum is fading. If buyers want this, they’ve got to show up now.
📊 Timeframes used:
4H: macro momentum divergence
30M: chop zone with directional potential
5M: inverse H&S near key support
1M: low timeframe momentum shift
🔭 Scenarios plotted for both directions. Choose your trigger.
#nasdaq #futures #MNQ #tradingstrategy #priceaction #headandshoulders #vwap

ES1! Futures
Looking at the 3D ES futures. Does it look bullish? Will it make ATH? Just look at that RSI!

2025-06-17 - priceactiontds - daily update - nasdaq
Good Evening and I hope you are well.
comment: Big up, big down, big confusion. Market rallies 500 points yesterday and today we get a late bear breakout and close below 22000. Traps on both sides and I am not believing in bear strength what so ever. I see this as a triangle and 22000 is the middle. Chop chop.
current market cycle: trading range
key levels: 21700 - 22300
bull case: Bulls want to stay above 21900 and print a higher low to then re-test 22300. Today they were weak and let the bears close below 22000 which was unexpected, giving yesterday’s bullishness. Tomorrow we have FOMC and I doubt market can move far from 22000 tomorrow. Any longs closer to 21800 make sense.
Invalidation is below 21680.
bear case: Bears left behind a gap up to 22015 but I doubt it can stay open. We have to decent trend lines below us and bears would need to break strongly below 21900 to try and go for 800 or even 700. Bears do not have any arguments to go below 21700 so I won’t make up any. That doesn’t mean it can not happen but it’s unlikely.
Invalidation is above 22230.
short term: Completely neutral around 22000. Only interested in longs below 21900 and shorts closer to 22100.
medium-long term - Update from 2024-06-15: Daily close below 21450 is my validation for the new bear trend which has the first bigger target at 21000 but I think we will printed below 20000 again this year. Structure is obviously not yet bearish, so don’t be early if you want confirmation and can’t/won’t scale in to shorts higher.
trade of the day: Buy low, sell high and scalp. Clear range 22000 - 22100 and the late bear breakout was ok if you made your money before. I do think it was unusual that we did not close the gap to y close 22176.

GOLD MARKET ANALYSIS AND COMMENTARY - [Jun 16 - Jun 20]The unrest in the Middle East this week has boosted safe-haven demand for gold, pushing it above $3,400 an ounce.
While gold has broken several recent technical resistance levels, it is unlikely that it will hit a new record high next week. The ongoing conflict between Israel and Iran provides safe-haven support, but historically, gold rallies driven by geopolitical events tend to be short-lived.
Gold is currently outperforming the US dollar, which has struggled to attract safe-haven funds.
Iran launched a retaliatory airstrike on Israel on Friday night (June 13), Reuters reported. Air raid sirens sounded across Israel and authorities urged residents to take shelter in shelters.
The Israeli military said Iran fired nearly 100 missiles, most of which were intercepted or missed their targets.
Israel's Channel 12 reported two people were seriously injured, eight were moderately injured and 34 suffered shrapnel injuries.
Iran's Islamic Revolutionary Guard Corps said it had carried out military operations against dozens of targets in Israel.
The Iranian Revolutionary Guards' news website released a message that evening saying the "powerful and precise" counterattack was in retaliation for Israel's "invasion" of many parts of Iran and the killing of many senior military commanders, nuclear experts and Iranian civilians, including children.
Wider Middle East Conflict Could Erupt
Israel destroyed Tehran's military command system early Friday and struck key Iranian nuclear facilities. The Fars news agency, which is affiliated with Iran's Revolutionary Guards, cited data saying the Israeli attack killed dozens of people in Iran and wounded more than 300.
Israel has carried out large-scale airstrikes on multiple locations in Iran since early Friday, bombing Iranian nuclear facilities and military targets.
Reuters said Israel's attacks on Iran during the day and Iran's retaliation have raised concerns about a broader conflict in the region.
All Eyes on the Fed
While gold will continue to be affected by geopolitical developments, market attention will also be on the Federal Reserve, particularly Chairman Powell, who will speak after next week’s monetary policy meeting.
Economists generally expect the Fed to keep rates unchanged. However, expectations are growing that Powell could begin paving the way for a rate cut later this year.
The latest inflation data and signs of a slowing US economy have given the Federal Reserve room to cut rates. However, growing geopolitical uncertainty may prompt some market participants to adjust their expectations.
Overall assessment of the basic environment
The gold market in particular will still receive absolute support when there are too many risks appearing, from geopolitical developments to interest rate prospects, and tariffs. Major conflicts in the Middle East, Russia - Ukraine, trade war between the US and the rest of the world, ... are all sudden risk support that makes gold likely to surge in the short term. Therefore, in general vision, gold is considered the top safe-haven asset in the global unstable environment and it tends to increase in price in the current context.
Economic Data to Watch Next Week
Monday: State Manufacturing Survey, Bank of Japan Monetary Policy Meeting
Tuesday: US Retail Sales
Wednesday: US Weekly Jobless Claims, US Housing Starts, Federal Reserve Monetary Policy Meeting
Thursday: US Markets Closed for Black Lives Matter Day, Swiss National Bank Monetary Policy Meeting, Bank of England Monetary Policy Meeting
Friday: Philadelphia Fed Manufacturing Survey
Technical Outlook Analysis OANDA:XAUUSD
On the daily chart, gold has almost achieved all the bullish targets noted by readers in last week's weekly issue, initially at $3,371, then at the full price point and finally at $3,435. Gold can still continue to increase in price as technical conditions still absolutely support the short-term trend channel, while the long-term trend channel and the nearest support is the EMA21.
In terms of momentum, the Relative Strength Index (RSI) is sloping up after receiving support from 50 and is still far from overbought territory, indicating that there is still a lot of room for upside ahead.
To sum up, as long as gold remains within/above the price channel, it remains bullish in the short term. Any dips that do not break below the price channel should only be considered as short-term corrections or a new buying opportunity.
Finally, the notable positions will be listed as follows.
Support: 3,400 – 3,371 USD
Resistance: 3,435 – 3,500 USD
SELL XAUUSD PRICE 3497 - 3495⚡️
↠↠ Stop Loss 3501
BUY XAUUSD PRICE 3374 - 3376⚡️
↠↠ Stop Loss 3370

Platinum for a short?after a bullish run, the fundamentals on platinum have shifted sharply into bearish bias, aligning perfectly with a key weekly supply zone. The recent weekly rejection candle confirms seller presence and validates the zone.

GOLD recovers from $3,371, risks remain highOn Tuesday (June 17) in the Asian market, the spot price of OANDA:XAUUSD suddenly fell sharply in the short term, and the price of gold once fell below 3,380 USD/ounce. As investors watched the hostile situation between Israel and Iran, US President Trump called for an immediate withdrawal of troops from Iran and ordered officials to be ready in the situation room, boosting demand for safe-haven assets.
Trump posted on his social media platform "Real Social": "Iran should sign the 'deal' I asked them to sign. What a shame and waste of lives. Simply put, Iran cannot have nuclear weapons. I have said this over and over again! Everyone should evacuate Tehran immediately!"
Axios News reported that shortly after Trump's tweet, Iranian media reported explosions and heavy anti-aircraft fire in Tehran. It is unclear whether there is any connection between Trump's tweet and the attack.
According to the latest report from Fox News, US President Trump asked the National Security Council to be on standby in the White House Situation Room after he cut short his trip to the G7 summit and returned to Washington earlier than expected.
The White House Situation Room is a conference room and intelligence management center located in the basement of the West Wing of the White House, with a total area of about 460 square meters.
The main purpose of the White House Situation Room is to provide a working space for the National Security Council, including the President of the United States, the Vice President, the White House Chief of Staff, the Secretary of State, the Secretary of Defense, the Chairman of the Joint Chiefs of Staff, the Director of the Central Intelligence Agency, the National Security Advisor, etc., to quickly discuss and respond to sudden domestic and international events affecting the national security of the United States. It has advanced and complete security communication facilities, allowing the President of the United States to control the United States military around the world at any time.
WTI crude oil prices rose about 3.00% on the day after Trump told officials to be ready in the situation room.
These market risks clearly leave plenty of room for gold to rise, and the current decline, which is being driven by profit-taking, is unlikely to last.
Technical Outlook Analysis OANDA:XAUUSD
After a sharp decline, gold has recovered from the support level noted to readers in the previous issue at the price point of 3,371 USD, which is the location of the 0.236% Fibonacci retracement, and currently the original price point of 3,400 USD is the nearest resistance at present.
If gold breaks above 3,400 USD, it will have the conditions to aim for the target of 3,435 USD in the short term.
Currently, gold still has enough technical conditions for an uptrend with the price channel as the short-term trend, while the price channel as the long-term trend and the EMA21 as the nearest support at present.
In terms of momentum, the Relative Strength Index (RSI) remains above 50 and is far from overbought territory, suggesting that there is still plenty of room for upside ahead.
The current declines should still be viewed as a short-term correction rather than a full-fledged trend, or as a buying opportunity.
During the day, the technical bullish outlook for gold will be highlighted by the following positions.
Support: $3,371 – $3,350
Resistance: $3,400 – $3,435
SELL XAUUSD PRICE 3420 - 3418⚡️
↠↠ Stop Loss 3424
→Take Profit 1 3412
↨
→Take Profit 2 3406
BUY XAUUSD PRICE 3350 - 3352⚡️
↠↠ Stop Loss 3346
→Take Profit 1 3358
↨
→Take Profit 2 3364

2025-06-16 - priceactiontds - daily update - dax Good Evening and I hope you are well.
comment: Market is much weaker than sp500 and nq, which is always unusual. We are staying below 23724, which is good for the bears but we are in a weak bull channel and making higher highs and higher lows since the Friday sell spike. Both sides make money and market is currently in balance around 23560ish. Clear invalidation prices for both sides and until then it’s buy low, sell high and scalp.
current market cycle: broad bull channel
key levels: 23300 - 24000
bull case: Bulls want to accelerate upwards, close the Globex gap to 23800 and retest 24000. End of story. They are currently a bit favored since we are in a bull channel but only slightly. Market has to stay above 23500 if they want to continue higher. If broader bullishness on markets continues, dax won’t stay below 23800 tomorrow.
Invalidation is below 23500.
bear case: Given that US markets pumped again, dax lags big time. Bears need to keep the gap to 23800 open and print something below 23500 again. If they continue sideways, their chances of another leg down to 23000 become better. My weekly outlook was that we correct sideways for a couple of days before we get another leg down, So far I think this is unfolding.
Invalidation is above 23800.
short term: Neutral around 23650. Bullish really only above 23800 or closer to 23500. If we stay above 23560 tomorrow, I expect another try at 23700 and above 23742 bears will give up for at least 23800.
medium-long term from 2025-06-15: Bull trend has most likely concluded. Long term shorts are fine. Stop has to be at least 24508. I see it 70% or more that we will see 22000 before end of August.
trade of the day: Long around 23500 on EU open since Globex breakout from 23400 was bullish enough to expect a second leg up or at least a re-test of the high 23620 which would have been good for 100 points but was actually good for 220 if you held. The short around 23700 was tough. bears should signs of wanting a trading range with the structure after EU open and the sell-off from 23724 was unexpected in it’s strength since US markets pumped that hard.

GOLD's room for growth is still wide, new all-time peakThe Israel-Iran conflict has increased the safe-haven role of gold, while pushing up oil prices, putting further pressure on inflation alongside the tariff pressure from the Trump administration.
Although the Israel-Iran conflict may continue to push gold prices higher this week, investors should be cautious and avoid chasing the development of this conflict. Because, gold price increases due to geopolitical events are usually short-lived.
In addition to the Israel-Iran conflict, markets will witness a speech by Fed Chairman Powell this week. With the Trump administration’s tariff policy still complicated and the Israel-Iran conflict escalating, the Fed Chairman may continue to signal that interest rates will remain unchanged at the July FOMC meeting. However, there is growing speculation that the Fed may begin laying the groundwork for a rate cut later this year.
In the short term, gold prices may be less affected by the Fed's monetary policy. Investors will pay more attention to the Trump administration's tariff policy, especially when the 90-day tariff suspension is about to end.
Technical Outlook Analysis OANDA:XAUUSD
Technical analysis still shows an upward trend in gold prices in the medium and long term, although gold prices will inevitably have periods of adjustment and accumulation, especially when the Israel-Iran conflict subsides.
Accordingly, if the gold price surpasses 3,446 USD/oz, it may continue to increase to the 3,500 USD/oz area. Conversely, if the gold price trades below 3,446 USD/oz, it may adjust to around 3,344 - 3,373 USD/oz, or even lower.
Notable technical levels are listed below.
Support: 3,400 – 3,371 USD
Resistance: 3,435 – 3,500 USD
SELL XAUUSD PRICE 3485 - 3483⚡️
↠↠ Stop Loss 3489
→Take Profit 1 3477
↨
→Take Profit 2 3471
BUY XAUUSD PRICE 3417 - 3419⚡️
↠↠ Stop Loss 3413
→Take Profit 1 3425
↨
→Take Profit 2 3431

#202524 - priceactiontds - weekly update - bitcoinGood Day and I hope you are well.
comment: Last week I printed another potential two-legged correction where the C would print a new ath. Bulls were to weak to even retest 112k and 110k was all they got. Now I do think there are many more reasons that this will be the mother of all doubles tops than any arguments for the bulls exist, how they could print a new ath. Structure is decent and market has spent many days at the top trying to continuing the trend. Confirmation is a daily close below 100k.
current market cycle: Broad bull channel on the weekly tf. Market is about to re-test the ath and will likely transition into a trading range afterwards or we are already in one.
key levels: 100k - 115k
bull case: Bulls are still hopeful, that’s why we are still above 110k but the next touch could break it and I doubt many will hold long or scale into new ones there. Best bulls can get right now is to go sideways for longer and stay above 100k. I mean… Staying above 100k is as bullish as it get’s if you be honest.
Invalidation is a daily close below 100k
bear case: Can we also get a new bear trend from 110k? We would need 4-5 consecutive daily bear closes for that. Right now bears are only getting 4 but prices is not moving much during those 4 and the bars are overlapping too much. Bulls are still hopeful. Bears need to do more if they want lower prices again. As of now bulls are favored to continue inside the given range.
Invalidation is above 113k
short term: Bearish with stop 113k. Will scale into shorts and take some profits around 100k until we see a big breakout below.
medium-long term - Update from 2025-06-08:
medium-long term - Update from 2025-06-08: “Need to see a clear sign that bulls can not push it beyond 112k and once we turn again from closer to the ath, I will comment on bear targets for the next months.”
This was from last week and market provided this clear sign with the amazing double top but only a daily close below 100k is confirmation. First target below 100k is 97k the breakout retest and after that is the 50% retracement around 93000.

#202524 - priceactiontds - weekly update - wti crude oil futuresGood Day and I hope you are well.
comment: Good week for oil bulls but still a lower high below the April high 78.1. Now what? If this buying is the real thing and market is expecting higher prices for longer, the pullback will stay above 70. If bulls do that, we can expect at least a second leg up to retest 75+ or even 80+. We are seeing a full on war between Israel and Iran but you should not trade based on that. There are bulls who bought above 73 on Friday and lost Money so far.
current market cycle: trading range 54 - 78 on the weekly tf. Decent chance we are in a bull trend that could lead to 80/84 or higher.
key levels: 70 - 77
bull case: Bulls have all the arguments on their side. They now need to leave a big open gap to 69.3 and then we can do a measured move up. My lowest target for that is 80. Structure on the 1h chart is a textbook two-legged pullback and above 74.5 it’s a clear buy signal.
Invalidation is below 70.8 but can likely also be 70
bear case: Bears do not have much. They trapped late bulls on Friday and that’s a likely reason we sold off 677 ticks from the high. They need lower lows below 70.8 and close the gap to the Thursday high before the news-bomb hit. For that to happen they have to break 2 bull trend lines. I will not look for shorts on this tbh.
Invalidation is above 74.5
short term: Bullish. Maybe a bit more sideways but I have given two invalidation prices for bulls and couple of targets above. I don’t think looking for shorts makes any sense unless you are really good at scalping.
medium-long term - Update from 2025-06-15: Maybe we have seen the 2-year trading range coming to an end on Friday and we are in a new bull trend that could lead oil to 80 or higher. Right now it’s pure guesswork until we print higher highs above Friday’s 77.62. Oil above 80 is not something we have seen since end of 2023 so expect some ripples.

#202524 - priceactiontds - weekly update - nasdaq e-mini futuresGood Day and I hope you are well.
comment: I do think we will continue to print lower highs from 22094. Very clear invalidation price for that thesis is a print above 21855. 21000 is my target for the next days/weeks. A strong daily bear close below the daily 20ema around 21450 would be my confirmation. Above 21855 we continue to chop sideways and could retest 22094.
current market cycle: trading range most likely for now until we have a daily close below 20ema
key levels for next week: 21450 - 21855 (below 21450 - next target is 21000 and above 21855 next target is 22000)
bull case: Bulls outdid themselves by almost completely reversing the strong sell-off on Friday. That certainly was unexpected but now is decision time. Can they keep the market above 21500 a second time? If so, most bears will likely be quick to give up again and we can continue sideways 21500 - 22100 or even higher. Since we did not close below the daily ema, bulls remain in control.
Invalidation is below 21450
bear case: Bears see the bull wedge as broken and want to trade down from here. The top we have formed is a credible double top with ath 22656 and good for swing shorts. Bulls have been given two amazing macro numbers last week, especially the cpi print and we could not break strongly above. Instead we got a spike and it crumbled afterwards. Those are the type of things that don’t happen in bull trends.
Invalidation is above 21855
short term: Neutral for now and I wait for the breakout to either side. I want to favor the bears but they were so weak after the Globex sell spike on Friday, it’s not wise to hope they suddenly become strong.
medium-long term - Update from 2024-06-15: Daily close below 21450 is my validation for the new bear trend which has the first bigger target at 21000 but I think we will printed below 20000 again this year. Structure is obviously not yet bearish, so don’t be early if you want confirmation and can’t/won’t scale in to shorts higher.

#202524 - priceactiontds - weekly update - daxGood Day and I hope you are well.
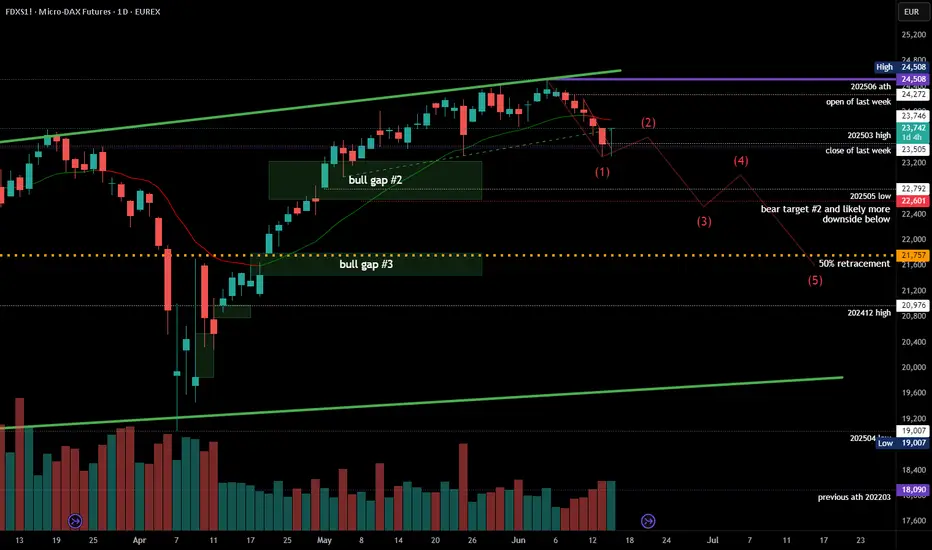
comment: Bears leaving no doubt who is in control of the market now. Volume is picking up on the move down and bear bars are getting bigger. I expect a bit more fighting around 23500 but once we break below, 23000 is the next target and also likely a gap close down to 22600. I have drawn my least bearish wave thesis on the chart where the 50% retracement gets hit over the next weeks. Much more bearish would be the 20000 target. If this selling continues without a pullback, I will adjust the legs.
current market cycle: trading range until we close below 23200 - then we are in the new bear trend. As of now the continuation inside the range is more likely.
key levels for next week: 22600 - 24000
bull case: Got nothing for the bulls but in case we trade back above 23580, we have to assume sideways for longer. I don’t think we can try another new ath after this selling. Bulls found support at the sell-spike from the 50% tariff announcement. If overall markets won’t sell off early on Monday, we can expect some sideways movement before market gets the next impulse up or down. Anything above 24100 would surprise me big time.
Invalidation is below 23280
bear case: 23280 is the price to break for more downside and 23580 is the most important price for bears to prevent the bulls from getting. If 23580 holds, we can do another strong leg down to close the gap 22600. If we go above, the next bear trend line would be around 23950ish and if we get there we will likely test 24000 again. After 5 consecutive bear bars, bulls can not hold longs in hope for another run at the highs. The bear bars are getting bigger and market tested above 24000 enough to know there are not enough buyers. Bulls tried 4 times to 3 times to continue the trend. Selling this top with long term shorts is as good as it gets. On lower time frames I expect a bit more sideways before another leg down.
Invalidation is above 23280
short term: Neutral but only on time frames lower than 4h. W1 has likely concluded but I expect at least a big second leg down to 22600ish. Bears have to keep it below 23580 or we could test back up to 24000.
medium-long term from 2025-06-15: Bull trend has most likely concluded. Long term shorts are fine. Stop has to be at least 24508. I see it 70% or more that we will see 22000 before end of August.
WIF 4H. Make or Break ZoneBINANCE:WIFUSDT The asset is still moving within a defined range and is now brushing against the lower boundary of its structure. This area has historically triggered buyer interest — and if that repeats, we could be looking at a recovery toward $0.97+ in the short term.
However, failure to defend this support could send price cascading down to the $0.58–$0.60 zone.
Given the ongoing uncertainty in global markets, especially due to rising geopolitical tension, any long positions should be executed with tight risk management and a hard stop-loss.
Entry range (EP):
• Market
• $0.8120
• $0.7790
Take-Profit targets (TP):
• $0.8880
• $0.9425
• $0.9765
I’m managing risk carefully and limiting exposure per trade to no more than 2% of my portfolio. This is my personal trading log and not financial advice — always DYOR and trade responsibly.
Let the market decide — I'm prepared either way.
Stay sharp. Stay safe. 🧠📊

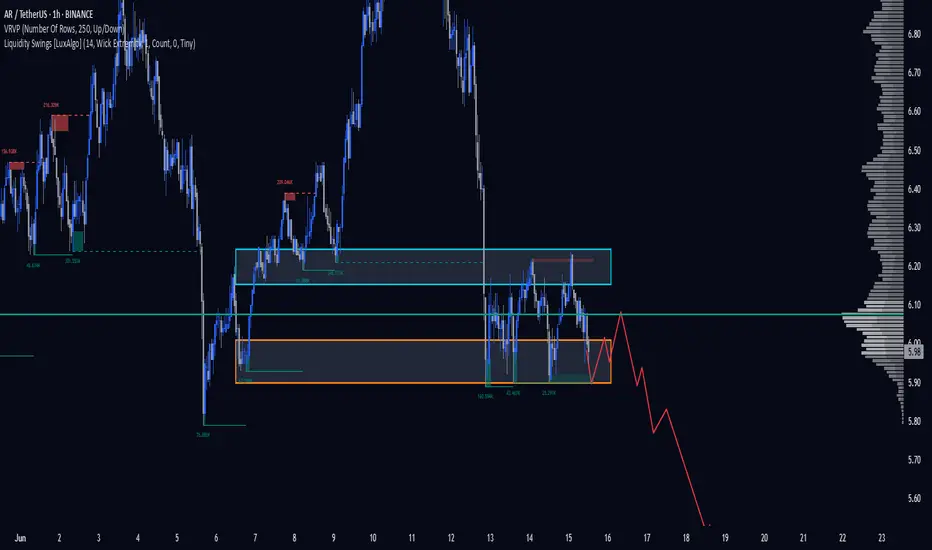
AR 1H. $5.90 Is the Last Line of Defense. 06/15/25BINANCE:ARUSDT If we fail to hold the $5.90 level, this asset could crash hard — potentially entering a deeper downtrend.
DYOR.
Futures RSII will go through why I prefer the 63 RSI to be OHLC4 or HLC3. That's because I think Volume Weighted MA is influenced by the high, low, and close price, so I use either that or OHLC4 after double smoothing it. Watch the 70-30 and oversold levels as a potential reversal play; typically, everything above 35 is bullish and everything below 65 is bearish, with 50 as TP. The most powerful aspect of the RSI lies in finding divergences from the strength of the RSI and the direction of price; that's where the largest trades I have taken were made.

SPY (S&P500) - Price Testing Support Trendline - Daily ChartSPY (S&P500 ETF) price has just closed below $600 and is currently under a support trendline.
If price cannot breakout above the $600 and $605 resistance level this month, a pullback could occur down to the support zone.
SPY price could potentially pullback to various levels of support due to:
-USA domestic conflict
-International military conflicts
-Technical chart bearish divergence
-USA federal reserve interest rate news
-Government and corporate news
Support Levels: $595, $590, $585, $580.
Resistance Levels: $600, $605, $610, $615.
The 50EMA/200EMA Golden Cross is still on-going, and support prices of $580 and $568 have yet to be tested significantly.

ETH ANALYSIS📊 #ETH Analysis : Update
✅As we said earlier, #ETH performed same. Now we can see that #ETH is trading in a bullish flag pattern and its a bullish pattern. We could expect around 10% bullish move if it sustain above its major support.
👀Current Price: $2555
🚀 Target Price: $2815
⚡️What to do ?
👀Keep an eye on #ETH price action and volume. We can trade according to the chart and make some profits⚡️⚡️
#ETH #Cryptocurrency #TechnicalAnalysis #DYOR
