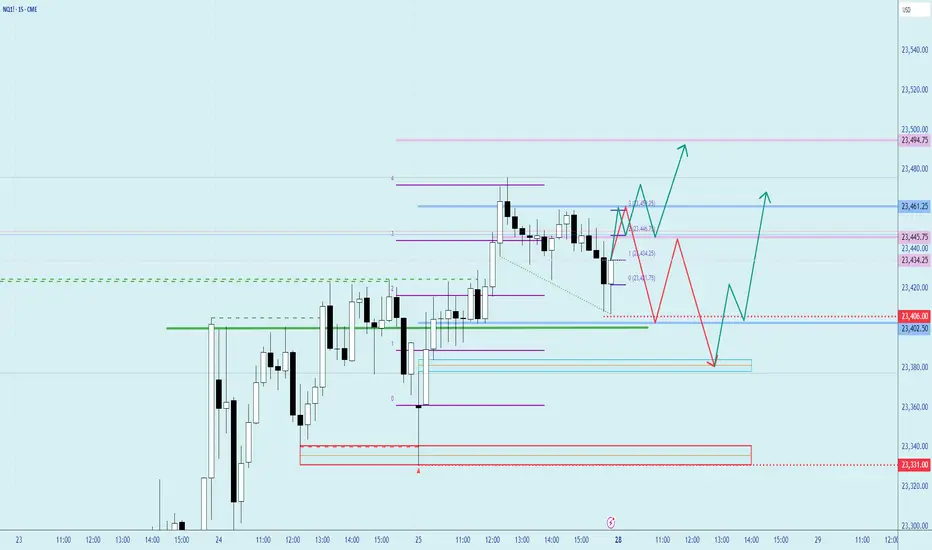
Bias is still Bullish However its month end Overall bias is still strong bullish, do note that its coming to end of month, either we pull back a bit or continues higher till end of month then pullback. Losing 23350 and 23300, probabilities of moving lower will higher since we had short squeeze move last Friday. Max Pain is 23020 can be use as a guide off futures movement.
Futurestrading
MKR ANALYSIS🔮 #MKR Analysis
🌟🚀 As we said earlier #MKR moved around 48%. Right now #MKR is trading in an Ascending Triangle Pattern and here we can see that #MKR moving again towards its neckline. We see see more bullish move in upcoming days
🔖 Current Price: $2260
⏳ Target Price: $2664
⁉️ What to do?
- We have marked crucial levels in the chart . We can trade according to the chart and make some profits. 🚀
#MKR #Cryptocurrency #Breakout #DYOR

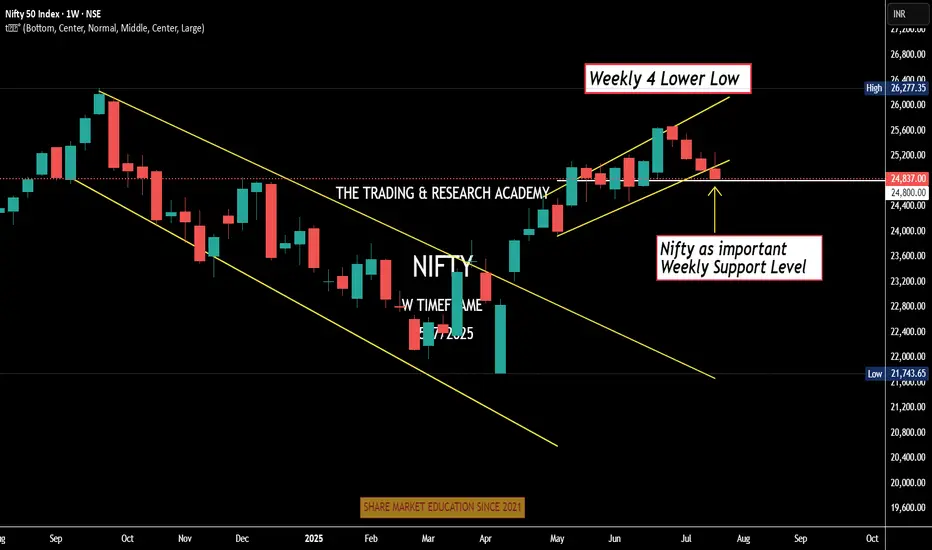
Weekly Nifty Analysis Next week, can we have a small bounce in #Nifty?
4 Lower Low
Daily channel Breakdown
Index at crucial weekly support level
Can one bullish week / Doji be expected. One news here or there & boom!
We have monthly expiry this week, let's see.
07/25/25 Trade Journal, and ES_F Stock Market analysis
EOD accountability report: +228
Sleep: 5 hours
Overall health: Still struggling to catch up on sleep. gonna take gg sleeping pills today
** VX Algo System Signals from (9:30am to 2pm) **
— 9:07 AMMarket Structure flipped bearish on VX Algo X3! :white_check_mark:
— 9:53 AM Market Structure flipped bullish on VX Algo X3! :white_check_mark:
— 10:30 AM Market Structure flipped bullish on VX Algo X3! :white_check_mark:
— 11:00 AM VXAlgo ES X1 Sell Signal :x:
**What’s are some news or takeaway from today? and What major news or event impacted the market today? **
Market structure algo was flipping a lot today, even in premarket, which tells me that MM was changing position a lot and things could be unreliable so i decided to end the trading day early at $200 and closed up shop on my main acccount.
**News**
*S&P 500 ENDS AT A NEW RECORD HIGH
**What are the critical support levels to watch?**
--> Above 6395= Bullish, Under 6372= Bearish
Video Recaps -->https://www.tradingview.com/u/WallSt007/#published-charts

07/24/25 Trade Journal, and ES_F Stock Market analysis EOD accountability report: +1452
Sleep: 4 hours
Overall health: need to catch up on sleep
** VX Algo System Signals from (9:30am to 2pm) **
— 9:37 AM Market Structure flipped bullish on VX Algo X3! :white_check_mark:
— 10:10 AM VXAlgo ES X1 Sell Signal :white_check_mark:
— 12:30 PM Market Structure flipped bearish on VX Algo X3! :x:
— 1:00 PM VXAlgo NQ X1DD Buy Signal :white_check_mark:
— 1:30 PM Market Structure flipped bullish on VX Algo X3:white_check_mark:
**What’s are some news or takeaway from today? and What major news or event impacted the market today? **
Today's market was a bit wild in the morning with a lot of big moves, sot here was opportunity to money if followed the signals.
I mostly finished trading by 12:30 because there was so many big moves.
**News**
(US) Pres Trump: Regarding firing Powell, would be a big move, it's not necessary; No pressure for Powell to resign; Have 1-3 names in mind for Fed Chair position
**What are the critical support levels to watch?**
--> Above 6370= Bullish, Under 6355= Bearish
Video Recaps -->https://www.tradingview.com/u/WallSt007/#published-charts

07/23/25 Trade Journal, and ES_F Stock Market analysis EOD accountability report: -1243
Sleep: 4 hours
Overall health: having issues with sleep the last 2 nights
VX Algo System Signals from (9:30am to 2pm)
9:23 AM Market Structure flipped bullish on VX Algo X3!
9:34 AM Market Structure flipped bearish on VX Algo X3!
11:47 AM Market Structure flipped bullish on VX Algo X3!
12:17 PM NQ X1 Sell Signal (triple sell)
What’s are some news or takeaway from today? and What major news or event impacted the market today?
After going on a long green streak, I got a bit greedy and wanted to make a big profit and went a bit risky dicky at the end of the session, having been able to read everything pretty well, I was pretty sure $6400 was going to be a pretty tight resistance between reading the gammabot data and options data, it showed that we would stall at $6400 on ES so i decided to put a few big ES short positions there with a tight stoploss at 6405 thinking, it surely can't go wrong with only a few minutes left in the session.
and surely it did, it went completely wrong and i went from being positive for the day to negative and throwing my profits away.
News
*STOCKS SURGE AFTER US-JAPAN TRADE DEAL AS S&P 500 AND NASDAQ CLINCH FRESH RECORDS
What are the critical support levels to watch?
--> Above 6339= Bullish, Under 6320= Bearish
Video Recaps -->https://www.tradingview.com/u/WallSt007/#published-charts

Short the Slip Above 1.3500Fundamental Outlook: A stagflation trap
The UK economy continues to emit worrying signs of stagflation: inflation remains uncomfortably high, growth is weak, and the once-tight labor market is starting to soften. Consumer confidence has deteriorated, and house prices are experiencing record declines, a trend that underscores the fragility of household wealth and future consumption.
In this challenging context, any rally in the pound should be treated with caution. The broader macro backdrop still favors the US dollar, especially if incoming US data continues to support a "soft landing" narrative. In contrast, the UK's trajectory appears more constrained.
On monetary policy, the Bank of England is expected to maintain a predictable, yet clearly dovish, easing cycle through the second half of 2025. Market consensus leans toward a 25 bps cut in August, followed by a pause in September, then another cut in November. This gradual pace of easing may keep the pound under persistent pressure, especially if the Federal Reserve maintains a more stable or data-driven stance.
On the political front, Trump’s critical remarks toward Powell and evolving UK-US relations represent potential flashpoints. Any surprises here could further erode confidence in the pound.
Technical Analysis: Signs of breakdown below 1.34
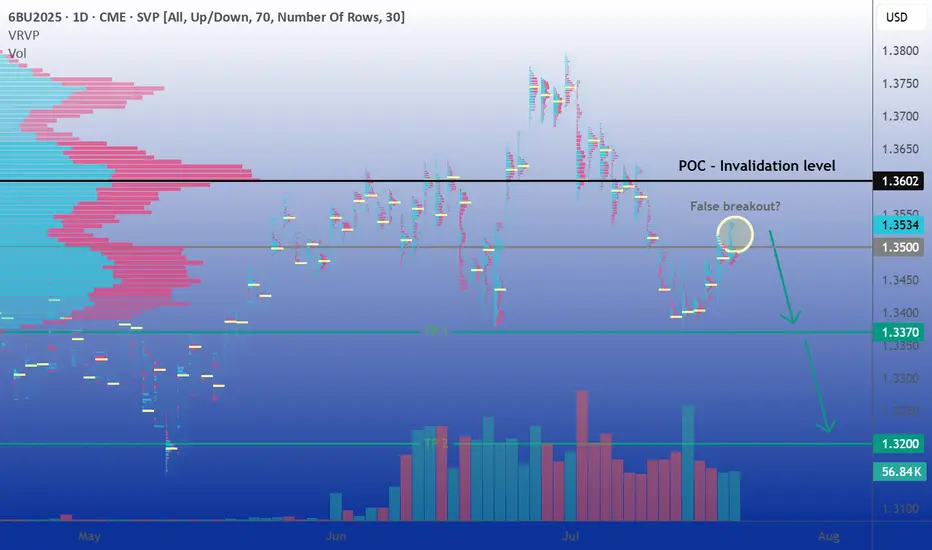
The September futures contract (6BU2025) has dropped over 2.5% in a straight line during the first two weeks of July, pressuring the 1.34 USD support zone before rebounding in recent sessions. So far, each rebound attempt has been met with consistent selling, and the brief move above 1.3500 appears fragile, offering a potential short opportunity to re-enter the previous range.
A sustained daily close below 1.3370 would likely pave the way for further downside toward the 1.32 level, which hasn’t been visited since May 13th. Notably, the volume profile reveals a liquidity vacuum in that region, potentially acting as a price magnet.
Overall, the technical setup favors another leg lower, barring the emergence of a strong bullish catalyst capable of reversing the prevailing trend.
Sentiment Analysis: Mixed but fragile
From a positioning standpoint, the CFTC's latest Commitment of Traders (COT) report shows asset managers increasing their bearish exposure. Net short positions grew from 13,154 to 27,611 contracts, hinting at rising institutional pessimism toward the pound.
In the FX/CFD retail segment, positioning remains relatively balanced. However, we notice a pattern: retail traders tend to increase long exposure on dips, profiting from short-term rebounds, a classic contrarian signal that the market may still have room to move lower.
Volatility remains muted, with the VIX trading below 17, close to its annual lows. This low-volatility environment tends to reinforce technical trading patterns and increases the likelihood that price respects key support/resistance zones, unless jolted by surprise macro events.
Options Market: Downside risk priced in
In the listed options market, we see a clear asymmetry in favor of downside protection. Out-of-the-money (OTM) puts trade at higher premiums than equivalent calls, confirming a market pricing greater fear of a GBP decline.
Open interest (OI) is notably concentrated in the 1.34–1.35 strike zone. This suggests potential pinning around these levels near expiry, but also highlights the risk of increased volatility if the spot price deviates sharply. A move away from this cluster could spark rapid adjustments in hedging flows, adding fuel to the next directional move.
Trade Ideas: Two ways to play the bearish bias
1. Classic directional strategy
Entry: Short at current price (around 1.3535)
Stop Loss: Daily close above 1.3602 (Volume Profile Point of Control)
Take Profit 1: 1.3370 (recent support)
Take Profit 2: 1.3200 (liquidity void)
This strategy targets a clean technical setup with clearly defined risk. A break below 1.3370 would confirm downside momentum and offer a high-reward second leg toward the 1.32 region.
2. Alternative strategy: Replace your stop loss with an OTM call option
Rather than exiting prematurely via a hard stop loss in case of a false breakout, consider purchasing an OTM call option as a form of insurance. This allows you to stay in the trade while limiting your maximum loss.
For instance, buying the August 1.355 call, currently trading around 0.0059 on CME (59 ticks), caps your loss in the event of an unexpected breakout above resistance. If the cable squeezes sharply higher, the call option will compensate part or all of the loss on the short position beyond the strike price.
This hybrid approach works particularly well in setups like this one, where fundamentals and sentiment support a bearish outlook, but positioning and low volatility leave room for abrupt technical counter-moves.
Final thoughts
The pound faces an increasingly precarious setup. Fundamental conditions in the UK remain soft, monetary policy is turning more accommodative, and political uncertainty looms large. Meanwhile, technical and sentiment indicators tilt bearish, and the options market reflects elevated downside risk premiums.
In short, while the market may already be pricing in some of this pessimism, the risks of a deeper GBP correction remain high. Traders should watch upcoming catalysts, BoE and Fed meetings, US/UK economic data, and geopolitical signals, and adjust positions accordingly.
Until we see a clear shift in macro data or a breakdown in technical patterns, fading rallies remains a strategy with attractive risk/reward potential.
---
When charting futures, the data provided could be delayed. Traders working with the ticker symbols discussed in this idea may prefer to use CME Group real-time data plan on TradingView: tradingview.com/cme/ .
This consideration is particularly important for shorter-term traders, whereas it may be less critical for those focused on longer-term trading strategies.
General Disclaimer:
The trade ideas presented herein are solely for illustrative purposes forming a part of a case study intended to demonstrate key principles in risk management within the context of the specific market scenarios discussed. These ideas are not to be interpreted as investment recommendations or financial advice. They do not endorse or promote any specific trading strategies, financial products, or services. The information provided is based on data believed to be reliable; however, its accuracy or completeness cannot be guaranteed. Trading in financial markets involves risks, including the potential loss of principal. Each individual should conduct their own research and consult with professional financial advisors before making any investment decisions. The author or publisher of this content bears no responsibility for any actions taken based on the information provided or for any resultant financial or other losses.
07/22/25 Trade Journal, and ES_F Stock Market analysis
EOD accountability report: +
Sleep: 6 hours
Overall health: Good
** VX Algo System Signals from (9:30am to 2pm) **
— 9:40 AM Market Structure flipped bearish on VX Algo X3!
— 10:20 AM VXAlgo ES X1 Buy signal
— 11:30 AM VXAlgo NQ X1DD Sell Signal
— 2:00 PM Market Structure flipped bullish on VX Algo X3!
**What’s are some news or takeaway from today? and What major news or event impacted the market today? **
Very clean trading day for me, signals worked out really well and everything played out accordingly
**News**
S&P 500 CLOSES AT A NEW ALL-TIME HIGH ABOVE 6,000
**What are the critical support levels to watch?**
--> Above 6339= Bullish, Under 6320= Bearish
Video Recaps -->https://www.tradingview.com/u/WallSt007/#published-charts

How to Trade Doji Candles on TradingViewLearn to identify and trade doji candlestick patterns using TradingView's charting tools in this comprehensive tutorial from Optimus Futures. Doji candles are among the most significant candlestick formations because they signal market indecision and can help you spot potential trend reversal opportunities.
What You'll Learn:
• Understanding doji candlestick patterns and their significance in market analysis
• How to identify valid doji formations
• The psychology behind doji candles: when buyers and sellers fight to a draw
• Using volume analysis to confirm doji pattern validity
• Finding meaningful doji patterns at trend highs and lows for reversal setups
• Timeframe considerations for doji analysis on any chart period
• Step-by-step trading strategy for doji reversal setups
• How to set stop losses and profit targets
• Real example using E-Mini S&P 500 futures on 60-minute charts
This tutorial may help futures traders and technical analysts who want to use candlestick patterns to identify potential trend reversals. The strategies covered could assist you in creating straightforward reversal setups when market indecision appears at key price levels.
Learn more about futures trading with Tradingview: optimusfutures.com
Disclaimer:
There is a substantial risk of loss in futures trading. Past performance is not indicative of future results. Please trade only with risk capital. We are not responsible for any third-party links, comments, or content shared on TradingView. Any opinions, links, or messages posted by users on TradingView do not represent our views or recommendations. Please exercise your own judgment and due diligence when engaging with any external content or user commentary.
This video represents the opinion of Optimus Futures and is intended for educational purposes only. Chart interpretations are presented solely to illustrate objective technical concepts and should not be viewed as predictive of future market behavior. In our opinion, charts are analytical tools—not forecasting instruments. Market conditions are constantly evolving, and all trading decisions should be made independently, with careful consideration of individual risk tolerance and financial objectives.

GOLD: Pre-market PrepSo for gold today, I see a lot of confluence around the prior week's high, prior day's high, and the prior value area high. We also had a poor high last Friday that we've clearly broken through.
Right now, we're in balance up above these key levels. My immediate plan is to continue going long up to the prior month's value area high. If we get a pullback to the confluence area, I want to take it up from there.
If the market opens and we accept back into the previous area, I'll be looking to go short from that area and take it down. That's my main analysis for gold today. Let’s trade smart, peace!

DIYWallSt Trade Journal:$238 Lessons From Monthly Expiration07/18/25 Trade Journal, and ES_F Stock Market analysis
EOD accountability report: +238.75
Sleep: 5. hours
Overall health: Was working late last night and didn't get much sleep.
VX Algo System Signals from (9:30am to 2pm)
— 8:30 AM Market Structure flipped bullish on VX Algo X3!
— 10:30 AM Market Structure flipped bearish on VX Algo X3!
— 11:10 AM VXAlgo ES X1 Buy signal (didn't work that well)
— 12:10 PM VXAlgo NQ X1DD Sell Signal
— 12:19 PM Market Structure flipped bullish on VX Algo X3!
What’s are some news or takeaway from today? and What major news or event impacted the market today?
Today was monthly expiration for options and we got a lot of X7 Sell signals but structure was bullish so I tried to take a long at MOB and got burned. Flipped bearish and started shorting the rest of the day and ended up making money back.
News
*US STOCKS MOVE LOWER AFTER REPORT SAYS TRUMP PUSHES FOR 15-20% MINIMUM TARIFF ON ALL EU GOODS
What are the critical support levels to watch?
--> Above 6335= Bullish, Under 6315= Bearish
Video Recaps -->https://www.tradingview.com/u/WallSt007/#published-charts

Pre-Market Prep 7.18.2025What it do, everyone! Here’s my pre-market prep for Friday, July 18th. Just to give you a quick overview, I'm using my prior value areas, the prior day's high and low, and the CVA levels from my market profile. I use all this history to help me plan my trades for the day.
So, starting with the S&P, as of now we’re green across the board. We’re in balance up from the prior day’s range, value area, and the CVA. My main plan is to look for acceptance and a pullback to a confluence area for longs. If we get rotational and break out of that area, I’m ready to go short.
For the NASDAQ, it's a similar story. We’re rotational in the prior value area and range, but we’re balanced up from the recent CVA. Right now, I’m waiting to see if we can confirm acceptance and then I’ll look for a short from that rotational area down to the prior value area low.
In the Russell, I’m seeing clear acceptance above all levels, so a pullback to the confluence area for a long would be ideal.
For Gold, I’m also seeing it in balance up on all fronts. My first move would be a long from the prior day’s high. If we drop a bit lower, I’ll be looking at that CVA and PVA area for another long.
The Euro is a bit more mixed. We’re rotational in the prior day’s range but balanced up in the value area and CVA. I want to clear the prior day’s high before taking any big moves.
The Yen is also rotational, so I’m looking to trade the extremes, maybe some scalps while we’re balanced in the prior value area.
For the Aussie Dollar, we’re in balance up from the PVA, but rotational in the prior day’s range and CVA. I’m looking for shorts near the top area and longs at the bottom, staying out of the middle for now.
And finally, Crude Oil is rotational on all fronts. My first plan is to look for shorts from the confluence area down to the prior day’s range.
That’s my pre-market prep for today. Let’s trade smart. Happy Friday, peace!

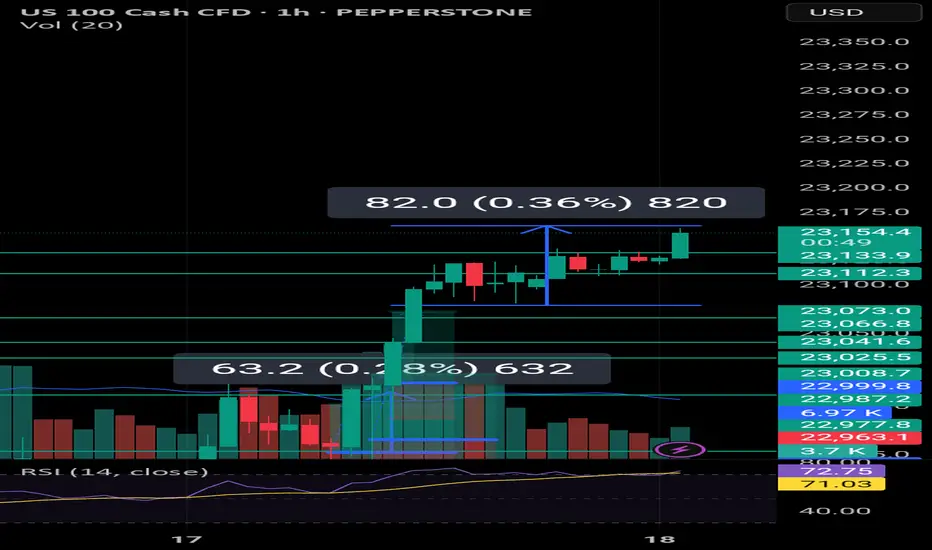
Weekly Close High to HOLD?As expected Nas100 will end in a weekly high after hitting a nice fresh record due to TSMI stock among other things like Trump walking back on firing Jermone Powell.
Technicals tell me that this is extremely overbought and I wonder if this will continue I cannot believe this rally. AS LONG as it holds the 23100 to 23150 range then it could break out again and set another high but I would be cautiously optimistic. Somebody's got to take the profit!
Pre-Market Prep
Today, I'm narrowing down to six key markets. For the S&P, it's all about waiting for a pullback from the prior day's high or a breakout above the CVA. If it dips back inside the range, I'm ready to go short with some scalps.
For the NASDAQ, it's looking strong. I'm thinking about a long position if it pulls back to the prior day's high.
Gold is in a downtrend across all areas, and I'm already in a short position from the CVA low. I'm thinking about adding to that if it pulls back to the prior day's low.
Crude Oil is pretty balanced. I'm looking at the high of the CVA for a short opportunity if it gets there.
For the Yen and Euro, both are rotational. I'm eyeing long opportunities if they show some acceptance and pullbacks from key levels.
That's the vibe for today. Let's trade smart, avoid the chop, and keep it moving. Peace!

SHIBUSDT 4H Potential 10% Drop – Wave 4 Incoming? Hey traders,
On the 4H timeframe, SHIBUSDT seems to be completing Wave III of a classic 5-wave impulse structure. We can clearly identify:
- Wave I and II behind us
- Wave III topped out recently with a strong push upward
- Now expecting a Wave IV correction to unfold
What supports this setup:
- Wave II was an irregular correction (note how Wave B pushed above Wave A).
- According to Elliott Wave alternation rules, if Wave II is complex/irregular, Wave IV is likely to be a simple ZigZag (ABC) correction.
- Zigzags are typically sharp and quick, which fits the momentum of the current market structure.
🕵️♂️ What’s next?
- The potential correction target lies in the marked rectangle zone (around -10% to -13% drop
from the recent top).
- On lower timeframes (like 7min or 10min), we’ll be watching for a support break to confirm
the start of Wave IV.
- If the support is broken with confirmation, that may offer an opportunity to enter a short
position — as long as it fits within the personal risk parameters.
📌 Disclaimer: This is not financial advice. Trading is risky — always manage your risk, do your
own research, confirm your setups, and never blindly follow others. Stay safe and smart.
🧠 Are you planning to catch this correction? Or waiting for the final Wave V? Let me know in the comments 👇

DIYWallSt Trade Journal: How I Navigated Powell Firing Rumors & 07/16/25 Trade Journal, and ES_F Stock Market analysis
EOD accountability report: +428.75
Sleep: 7 hours
Overall health: Good
VX Algo System Signals from (9:30am to 2pm)
— 4:17 AM Market Structure flipped bullish
— 9:50 AM Market Structure flipped bearish
— 12:00 PM VXAlgo NQ X3 Buy Signal
— 1:02 PMMarket Structure flipped bullish
What’s are some news or takeaway from today? and What major news or event impacted the market today?
Today was a crazy trading day with a bunch of wild moves because Trump said they were going to fire Powell and then cancelled the threat.
Overall health and sleep have been good this week and our trading balance is reflecting that.
News
— 10:30 AM *SCOTT BESSENT: “FORMAL PROCESS” TO REPLACE FED CHAIR POWELL UNDERWAY
— 12:11 PM
*TRUMP ASKED IF HE WILL FIRE POWELL: NOT PLANNING ON DOING ANYTHING
What are the critical support levels to watch?
--> Above 6290= Bullish, Under 6280= Bearish
Video Recaps -->https://www.tradingview.com/u/WallSt007/#published-charts


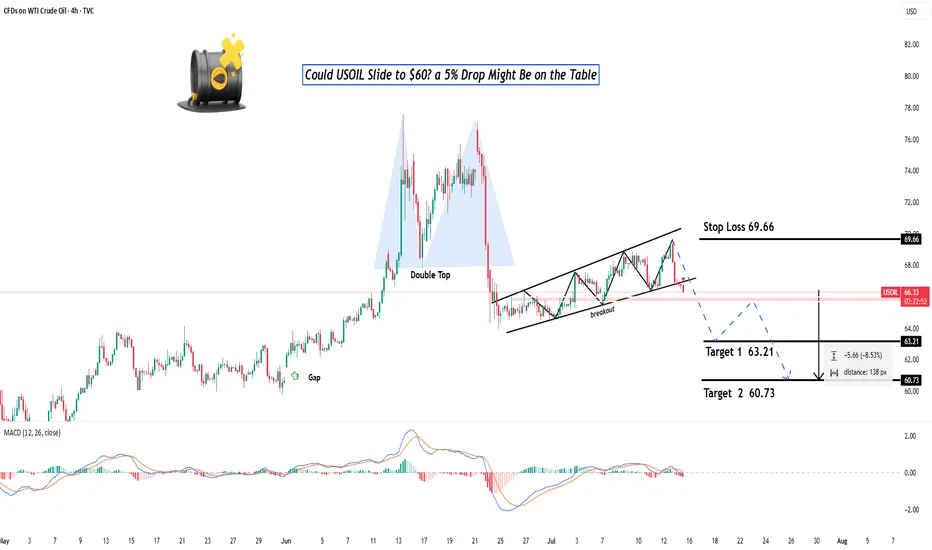
Could OIL Slide to $60? a 5% Drop Might Be on the Table? Hey Realistic Traders!
Price action is weakening. Will USOIL find support or slide further?
Let’s Break It Down..
On the 4H timeframe, oil has formed a double top pattern followed by a neckline breakout, which is a classic sign of a potential shift from a bullish to a bearish trend.
This breakout was confirmed by a break below the bullish trendline, accompanied by consecutive bearish full-body candlesticks that reinforce the bearish momentum. Afterward, the price formed a bearish continuation pattern known as a rising wedge, which was followed by a breakdown.
The combination of bearish reversal and continuation pattern breakouts signals further downside movement and confirms the shift into a bearish trend.
Therefore, we foresee the price forming lower lows and lower highs toward the first target at 63.21, with a potential extension to the close the gap at 60.73.
The bearish outlook remains valid as long as the price stays below the key stop-loss level at 69.66.
Support the channel by engaging with the content, using the rocket button, and sharing your opinions in the comments below.
Disclaimer: This analysis is for educational purposes only and should not be considered a recommendation to take a long or short position on USOIL.
Trading Day SummaryTrading Day Summary
Today wasn’t a winning day on the books, but it was a major win in discipline.
I hit my daily loss limit before 10 AM, stopped live trading, and switched over to paper trades to protect my capital.
The setups I took—especially in Gold and Euro—lacked full confirmation, and one overnight trade didn’t align with my plan.
I experienced around $200 in slippage, which added to the loss.
The bright side? I stayed in control. No revenge trades. No emotional spirals.
My paper trade afterward was textbook—5R+ potential. That tells me the strategy is sound. Execution and timing just need to be sharper.
Bottom line: this is a marathon, not a sprint. I’m proud of the discipline and the mindset. Tomorrow, we reset and refocus.

Mid-Session Market ReviewMid-Session Market Review
S&P 500: After some initial volatility from the 8:30 news, the market accepted above the prior day’s levels but has since pulled back within range, consolidating just below the highs.
NASDAQ: The NASDAQ remains above all of yesterday’s levels and is currently balancing between the high of the day and the 23,100 level, showing a rotational pattern.
Russell 2000: This market is rotational within the prior day’s range and has accepted below the CVA and PVA. Potential trade opportunities might come with a pullback to the 2,245 area.
Gold: Gold has accepted below the prior value area and is still rotational within the CVA. Trade opportunities could present themselves near the prior day’s low.
Crude Oil: The market is quite choppy, hovering around the prior day’s low and value area low. Caution is advised, with potential long opportunities on a pullback, as long as conditions align.
Euro Dollar: The Euro is dropping significantly, moving below all key levels without much respect for them. This could provide short opportunities if there’s a pullback.
Yen: Similar to the Euro, the Yen is also pushing below previous levels. It’s getting choppy near the CVA low, so caution is needed until it shows more respect for those levels.
Natural Gas: The market is rotational within the prior day’s range and respecting the CVA high. Long opportunities might be possible if conditions are right.
Aussie Dollar: It’s showing some respect for the CVA low and is still rotational. There could be a potential long setup forming, depending on how it plays out.
British Pound: The Pound has accepted below all key levels, and a pullback to the CVA low might provide short opportunities, though caution is needed around the VWAP.

DIYWallSt Trade Journal:The Importance of Your First Trade **07/14/25 Trade Journal, and ES_F Stock Market analysis **
EOD accountability report: +158.75
Sleep: 7 hours
Overall health: Good
** VX Algo System Signals from (9:30am to 2pm) **
— 8:00 AM Market Structure flipped bullish on VX Algo X3!
— 10:30 AM VXAlgo NQ X1DD Buy Signal
— 11:50 AM VXAlgo ES X1 Sell Signal
— 1:00 PM VXAlgo NQ X1DD Buy Signal
**What’s are some news or takeaway from today? and What major news or event impacted the market today? **
I need to really be careful with my first trade and making sure it is a high probability trade, otherwise a bad early start is likely to ruin my whole day.
News
— 1:42 PM *TRUMP TO UNVEIL $70 BILLION IN AI AND ENERGY INVESTMENTS
— 4:08 PM *S&P 500 ENDS HIGHER AS STOCKS RISE AFTER TRUMP SAYS OPEN TO DEALS ON TARIFFS
**What are the critical support levels to watch?**
--> Above 6295= Bullish, Under 6285= Bearish
Video Recaps -->https://www.tradingview.com/u/WallSt007/#published-charts

Soybeans and Rain: Moisture’s Market Impact on the Bean Trade1. Introduction: Moisture & Market Momentum
Soybeans, often referred to as “the oilseed king,” are a cornerstone of global agriculture. As a leading source of protein for both humans and animals, their price fluctuations affect industries ranging from food production to biofuels. One key variable traders often monitor? Rainfall. 🌧️
Moisture plays a critical role in soybean development, influencing yield and quality from the moment the seed is sown. It’s no surprise that many market participants assume a strong correlation between rainfall and price behavior. But is that assumption truly supported by data?
In this article, we analyze how varying precipitation levels impact weekly soybean futures returns. As you'll see, the results might not be as clear-cut as you’d expect—but they still offer meaningful insights.
2. Biological Realities: Soybeans’ Water Needs
Soybeans thrive under specific conditions. While they’re generally resilient, rainfall—or the lack thereof—can tip the balance between bumper harvests and disappointing yields.
During early vegetative stages, sufficient moisture ensures healthy root development. Later, during the pod-fill phase, rainfall becomes even more essential. Too little water at this point leads to incomplete pods or aborted seeds. On the flip side, too much rain can invite fungal diseases and delay harvests, especially in lower-lying regions.
In countries like Brazil and Argentina, soybean fields often face seasonal extremes, while the U.S. Midwest typically enjoys more consistent conditions—though droughts and floods have both hit the Corn Belt in recent years. These environmental realities create natural volatility in both yield and pricing expectations.
3. Methodology: How We Analyzed Weather vs. Futures
To explore the potential connection between rainfall and soybean futures prices, we collected weekly weather data for major soybean-growing cities across the globe. Each week’s precipitation was categorized using a normalized percentile system:
Low Rainfall: below the 25th percentile
Normal Rainfall: between the 25th and 75th percentiles
High Rainfall: above the 75th percentile
We then matched this data against weekly returns of standard soybean futures (ZS) and micro soybean futures (MZS), both traded on the CME Group.
This allowed us to compare average price behavior in different rainfall scenarios—and test whether there was any statistically significant difference between dry and wet weeks.
4. Statistical Findings: Is There a Signal in the Noise?
When examining the data, the initial visual impression from boxplots was underwhelming—return distributions across rainfall categories looked surprisingly similar. However, a deeper dive showed that the difference in mean returns between low and high precipitation weeks was statistically significant, with a p-value around 0.0013.
What does that mean for traders? While the signal may not be obvious to the naked eye, statistically, rainfall extremes do impact market behavior. However, the magnitude of impact remains modest—enough to be part of your strategy but not enough to drive decisions in isolation.
Soybean prices appear to be influenced by a mosaic of factors, with precipitation being just one tile in that complex picture.
5. Charting the Relationship: Visual Evidence
While statistical tests gave us the green light on significance, we know traders love to “see” the story too. Boxplots of weekly soybean futures returns segmented by rainfall categories offered a subtle narrative:
Low-precipitation weeks showed slightly higher average returns and tighter interquartile ranges.
High-precipitation weeks had broader return distributions and more frequent downside outliers.
Normal weeks exhibited relatively stable behavior, reinforcing the idea that the market reacts most during extremes.
This kind of visualization may not scream alpha at first glance, but it reinforces the idea that precipitation events—particularly dry spells—tend to nudge prices upward, possibly as market participants price in production risk.
6. Trading Implications: Positioning Around Weather
Here’s where things get practical. While weather alone won’t dictate every trading decision, it can be a key filter in a broader strategy. For soybean traders, rainfall data can help inform:
Bias assessment: Low-precipitation weeks may suggest bullish tendencies.
Risk control: Expect wider return distributions in high-precip weeks—adjust stops or contract sizing accordingly.
Event trading: Pair weather anomalies with technical signals like trendline breaks or volume surges for potential setups.
It’s also worth noting that weekly weather forecasts from reputable sources can serve as a forward-looking indicator, giving traders a head start before the market fully reacts.
7. Margin Efficiency with Micro Soybeans
For traders looking to scale into soybean exposure without the capital intensity of full contracts, the CME Group’s micro-sized futures offer a compelling alternative.
📌 Contract Specs for Soybean Futures (ZS):
Symbol: ZS
Contract size: 5,000 bushels
Tick size: 1/4 of one cent (0.0025) per bushel = $12.50
Initial margin: ~$2,100 (varies by broker and volatility)
📌 Micro Soybean Futures (MZS):
Symbol: MZS
Contract size: 500 bushels
Tick size: 0.0050 per bushel = $2.50
Initial margin: ~$210
These smaller contracts are perfect for strategy testing, risk scaling, or layering exposure around key macro events like WASDE reports or weather disruptions. For traders aiming to build weather-aligned positions, MZS is a powerful tool to balance conviction with capital efficiency.
8. Wrapping It All Together
Rain matters. Not just in fields, but in futures prices too. While soybean markets may not overreact to every drizzle or downpour, extreme rainfall conditions—especially drought—can leave noticeable footprints on price action.
For traders, this means opportunity. By incorporating precipitation metrics into your workflow, you unlock a new layer of context. One that doesn’t replace technical or fundamental analysis, but enhances both.
And remember: this article is just one piece of a larger exploration into how weather affects the commodity markets. Make sure you also read prior installments.
When charting futures, the data provided could be delayed. Traders working with the ticker symbols discussed in this idea may prefer to use CME Group real-time data plan on TradingView: www.tradingview.com - This consideration is particularly important for shorter-term traders, whereas it may be less critical for those focused on longer-term trading strategies.
General Disclaimer:
The trade ideas presented herein are solely for illustrative purposes forming a part of a case study intended to demonstrate key principles in risk management within the context of the specific market scenarios discussed. These ideas are not to be interpreted as investment recommendations or financial advice. They do not endorse or promote any specific trading strategies, financial products, or services. The information provided is based on data believed to be reliable; however, its accuracy or completeness cannot be guaranteed. Trading in financial markets involves risks, including the potential loss of principal. Each individual should conduct their own research and consult with professional financial advisors before making any investment decisions. The author or publisher of this content bears no responsibility for any actions taken based on the information provided or for any resultant financial or other losses.

CL1! Short Setup – Fading Into Volume Shelf📉 CL1! Short Setup – Fading Into Volume Shelf
🔹 Context:
Price just tapped into a heavy upper volume shelf (68.35–68.50) — the exact area where the prior breakdown started. This zone aligns with rejection highs and the upper edge of the VRVP profile.
📌 Setup Logic:
🔺 Entry: 68.36–68.50 (into supply zone)
⛔ Stop: 68.75 (above liquidity peak)
🎯 Target: 66.78 (prior demand + volume node)
📐 RRR: ~4.0:1
⚠️ Trigger: Do not enter early — wait for rollover of price which it looks like we are getting now.
📊 Why It Matters:
📈 VRVP shows clear upper and lower volume shelves
📛 Price has overextended into a prior rejection zone
🔁 Potential for a mean-reversion leg once we confirm momentum breakdown
📷 See attached chart for full zone layout
🧠 Let me know if you’re entering or watching this one 👇
#CrudeOil #CL1 #FuturesTrading #VolumeProfile #SciQua #OrderFlow
