DOTUSDT.Phello friends
Due to the severe fall we had. Let the price go down to the specified support range and see an upward movement from there.
This analysis is checked from a technical point of view.
Be successful and profitable.
Futurestrading

SELL NASDAQAs you can see on the chart, we have our MS stll going bearish and the market gave us a confirmation of the reversal after the correction.
You can sell and take the same level I set on the chart.
Follow for more!

TradeCityPro | MEMEUSDT Potential Breakout from the Range Box👋 Welcome to TradeCityPro Channel!
Let’s dive into analyzing our coins in the current market conditions to identify potential triggers before the next move begins.
🌐 Overview Bitcoin
Before starting today’s altcoin analysis, as usual, let’s first check Bitcoin on the 1-hour timeframe. Bitcoin has finally initiated a wave, breaking through the 95753 resistance.
However, I’m not fond of the volume in these recent candles, and it needs to increase. You can consider opening positions upon entering the overbought zone.
Additionally, today saw a short-term wave with some green candles, accompanied by a decline in Bitcoin dominance. Now, as Bitcoin prints green candles, its dominance is also rising, indicating that the next wave moving toward Bitcoin’s peak might come with increased dominance.
📊 Weekly Timeframe
On the weekly timeframe, the altcoin MEME rejected the top of the range and the significant 0.01790 resistance, pushing it back toward the range’s bottom.
The buy trigger hasn’t activated yet, and this rejection has made the trigger even more critical. If you’re interested in buying this altcoin, consider adding it to your mid-term portfolio after breaking 0.01790.
If you’ve already bought at any level on this chart, it’s logical to exit and cut losses if the range’s bottom breaks. A break below 0.00997 would suggest forming new lows, so it’s better to liquidate and look for a fresh trigger later.
📈 Daily Timeframe
On the daily timeframe, following a heavy rejection from the 0.1795 resistance, MEME returned to the range, resulting in continued oscillations within this area.
We must consider that, price-wise, the market is at a logical level for buying. However, time-wise, it might range here for a while before starting a potential upward move. This makes it somewhat reasonable to take small spot risks during these days.
Based on the above, you can make a risky buy at 0.01132, with a stop-loss at 0.00861, after breaking the level. However, personally, I’ll hold onto liquidity for lower levels.
For example, if I have 30% of my funds in cash, any purchases I make here would amount to just 5% overall, assuming stop-losses are hit! For a more logical entry, I’ll monitor for a break above 0.01795.
⏱ 4-Hour Timeframe
On the 4-hour timeframe, MEME has been ranging for days within the 0.01007–0.01139 box. A breakout from either side of this range will provide a clear trigger without bias.
📈 Long Position Trigger
the rejection at the 0.01139 resistance has increased its significance. Once this level breaks, I’ll open a futures long position with a large stop-loss at 0.01.
📉 Short Position Trigger
momentum can be tracked on lower timeframes, and positions can be opened with triggers on these smaller timeframes. The 0.01 support level could be used for a small stop-loss and low-risk, quick profit management.
📝 Final Thoughts
Stay calm, trade wisely, and let's capture the market's best opportunities!
This analysis reflects our opinions and is not financial advice.
Share your thoughts in the comments, and don’t forget to share this analysis with your friends! ❤️

SELL XAUUSD | GC1!You can sell on XAUUSD | GC1! following the same levels on the chart.
Follow for more trades!

READY FOR BREAK ALL TIME HIGH...NSE:NIFTYNXT501! trade at 75250 level. It takes 4 times resistance at 75500-75800 level. After break all time resistance you can watch for more a huge upside move.

NATURAL GAS FUTURE may catch Fire...MCX:NATURALGAS1! trade at 188.80. After breakout you can watch for 200 & 220 target with SL of 180 & 170

NIFTY SEP FUT, you can long it...NSE:NIFTY1! trade at 25350. You can buy it with small sl of 25100, for target of 25500-25600.

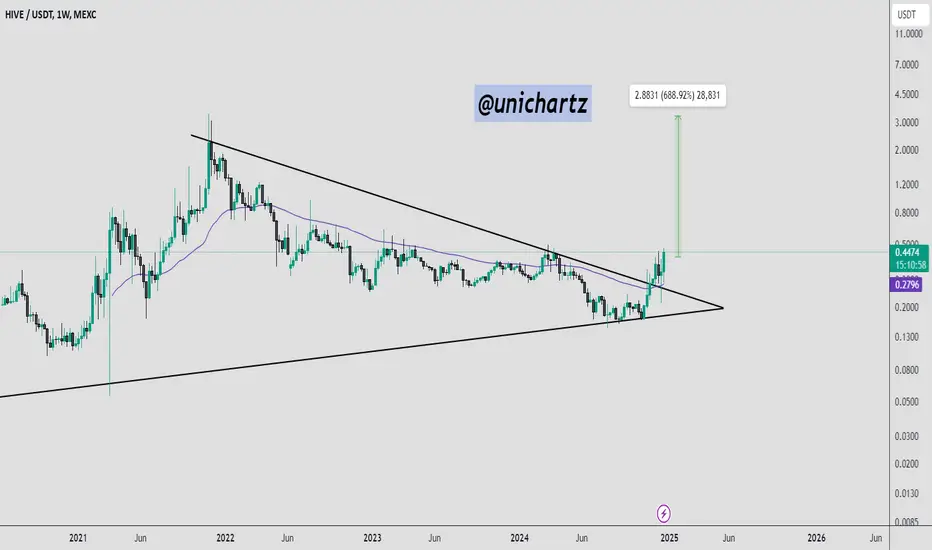
HIVE/USDT Breaks Multi-Year Triangle: Bullish Momentum Ahead?HIVE has broken out of a multi-year symmetrical triangle pattern on the weekly timeframe, with the price currently trading at $0.4456. It is now well above the 50-week EMA, which provides dynamic support around $0.28.
This breakout signals a strong bullish move, with potential resistance targets at $0.50 and $0.65. Watch for a retest of the breakout level for possible re-entry opportunities.
TP REACHED ON XAUUSD | GC1!Earlier I posted to Buy XAUUSD, and reversed before hitting the SL to enter as a seller since the market gave us a reversal of the movement.
I didn't post it since I was busy with my students, here's the screenshot for you.
Follow for more daily trades!

BUY CAUUSD | GC1!You can buy on XAUUSD | GC1! after that we got a reversal at the end of the bearish movement and the beginning of an uptrend. Use same SL and TP as mine.
Follow for more!

SELL CRUDEOIL | USOIL | CL1!You can sell USOIL | CL1! | USOUSD at the same entry as mine and the same target and stop.
Follow for more!

Intraday Levels for Nasdaq 100 Futures - 12/20/2024This analysis focuses on the Nasdaq 100 Futures, aiming to identify potential support and resistance levels where the price could experience intraday bounces or trend reversals, as well as zones where the price might potentially break higher or move lower.
Considerations
The range used in this analysis serves only as a reference for broader-level insights.
For intraday operations, it is advisable to utilize a lower timeframe to refine entry and exit points more accurately.
To confirm the validity of these levels, it is essential to evaluate real-time conditions as the price approaches these zones. Factors such as pressure, trading volume, and Order Flow will play a critical role in determining whether these supports hold or are likely to be broken.

1000PEPEUSDT.Phello friends
Due to the high growth of this coin, now that it has entered a correction, it has reached a very strong support area, from where we expect a higher ceiling.
Note that the price will increase if the support zone remains valid and does not break, so manage your investment and be careful...
This analysis is checked from a technical point of view.
Be successful and profitable.

Intraday Levels for Nasdaq 100 Futures - 12/19/2024This analysis focuses on the Nasdaq 100 Futures, aiming to identify potential support and resistance levels where the price could experience intraday bounces or trend reversals, as well as zones where the price might potentially break higher or move lower.
Considerations
The range used in this analysis serves only as a reference for broader-level insights.
For intraday operations, it is advisable to utilize a lower timeframe to refine entry and exit points more accurately.
To confirm the validity of these levels, it is essential to evaluate real-time conditions as the price approaches these zones. Factors such as pressure, trading volume, and Order Flow will play a critical role in determining whether these supports hold or are likely to be broken.

TQRGET REACHED ON CRUDE OILEarlier I posted to buy on CL1! | USOUSD | CRUDE, after that I posted to sell and reverse the position, now the market reached our target which was the LQ Level, 2 good trades today!
Follow for more daily trades!

TP REACHED ON NASDAQMinutes ago I posted to sell on NASDAQ and the market reached our TP, a small quick trade to start the day with.
Follow for more!

SELL NASDAQ I'm sharing with you a quick trade on NASDAQ, you can sell and target the same level as mine.
Follow for more!

Intraday Levels for Nasdaq 100 Futures - 12/18/2024This analysis focuses on the Nasdaq 100 Futures, aiming to identify potential support and resistance levels where the price could experience intraday bounces or trend reversals, as well as zones where the price might potentially break higher or move lower.
Considerations
The range used in this analysis serves only as a reference for broader-level insights.
For intraday operations, it is advisable to utilize a lower timeframe to refine entry and exit points more accurately.
To confirm the validity of these levels, it is essential to evaluate real-time conditions as the price approaches these zones. Factors such as pressure, trading volume, and Order Flow will play a critical role in determining whether these supports hold or are likely to be broken.

SELL XAUUSD | GCYou can sell on XAUUSD | GC after that it grabbed the LQ and target the same levels as mine.

ES Futures Trade Idea: Santa Rally Expectationswww.tradingview.com
The ES futures market has maintained a bullish trajectory in 2024, with few pullbacks along the way. Currently, the futures are consolidating near All-Time Highs, setting the stage for a pivotal week ahead.
Key Catalysts to Watch
Wednesday, December 18th, 2024
FED Interest Rate Decision
Summary of Economic Projections (SEP)
FOMC Meeting
These events could provide the momentum needed to fuel a potential Santa Claus Rally. However, whether this materializes remains uncertain.
Additional Economic Data
The economic calendar this week is packed with key data releases, beginning with the preliminary Manufacturing and Services PMI readings at 8:45 AM CT today. On Tuesday, the spotlight will be on November US Retail Sales, while Thursday, December 19th, 2024, brings a flurry of critical updates, including the Bank of England (BOE) and Bank of Japan (BOJ) rate decisions, Q3 US GDP, initial jobless claims, and November existing home sales. The week concludes on Friday, with the release of the FED’s preferred Core PCE Price Index for November at 7:30 AM CT, offering fresh insights into inflation trends.
Key Levels to Watch:
Target for Bulls: 6295-6310
Line in Sand (LIS): 6045-6055
R1: 6105-6115
R2: 6145-6155
R3: 6195-6205
S1: 5970-5960
S2: 5855-5835
Key Support S3: 5735-5745
Possible Scenarios
Scenario 1: Sustained Bullish Movement and Santa Rally
In this bullish case, ES futures break out of the consolidation zone following the FED announcements. This could lead to a year-end rally with prices targeting the Fibonacci extension level at 6312.50, setting the stage for continued gains into Q1 2025.
Scenario 2: Santa Rally Followed by Pullback
Here, the FED-driven Santa rally kicks off but encounters resistance. After the initial bullish push, the market consolidates into year-end as traders await fresh inflows and sector rotations in January for the next directional move.
Both scenarios hinge on key data releases and market reaction to the FED’s guidance. Keep an eye on the Line in the Sand (LIS) at 6045–6055, as it represents a critical level for the ongoing trend.
This week’s calendar is packed with high-impact events that could drive volatility and shape the near-term outlook for ES futures. Stay prepared!
Disclaimer: The views expressed are personal opinions and should not be interpreted as financial advice. Derivatives involve a substantial risk of loss and are not suitable for all investors.

TP REACHED ON XAUUSD | GCEarlier this morning I posted to buy on XAUUSD | GC, and the market reached our tp with a profit of 1000$ on futures, now we'll expect the market to make a reversal to ride it again and get to a lower point.
Follow for more!

Currency Wars: Exploring BTC/Fiat Ripple Effects on Key Markets1. Introduction
In today's interconnected financial markets, major fiat currencies like the Euro (6E) and Yen (6J) play a critical role in influencing USD-denominated assets. The relative strength between these currencies often reflects underlying economic trends and risk sentiment, which ripple across key markets like Treasuries (ZN), Gold (GC), and Equities (ES).
However, Bitcoin (BTC), a non-traditional digital asset, introduces an interesting divergence. Unlike fiat currencies, BTC's behavior during periods of significant market stress may reveal a unique relationship to USD movements. This article explores:
The relative strength between the Euro and Yen.
Correlations between fiat currencies, BTC, and USD-denominated markets.
Whether BTC reacts similarly or differently to traditional currencies during market volatility.
By analyzing these dynamics, we aim to identify how shifts in currency strength influence assets like Treasuries while assessing BTC’s independence or alignment with fiat markets.
2. Relative Strength Between 6E and 6J
To evaluate currency dynamics, we compute the relative strength of the Euro (6E) versus the Yen (6J) as a ratio. This ratio helps identify which currency is outperforming, providing insights into broader risk sentiment and market direction.
Another way to think of this ratio would be to use the RY1! Ticker symbol which represents the Euro/Japanese Yen Futures contract.
Correlation Heatmaps
The correlation heatmaps below highlight relationships between:
o Currencies: Euro (6E), Yen (6J), and Bitcoin (BTC).
o USD-Denominated Markets: Treasuries (ZN), S&P 500 (ES), Crude Oil (CL), Gold (GC), and Corn (ZC).
o Key Observations (Daily Timeframe):
The 6J (Yen) shows a positive correlation with Treasuries (ZN), supporting its traditional role as a safe-haven currency.
Bitcoin (BTC) demonstrates mixed relationships across assets, showing signs of divergence compared to fiat currencies during specific conditions.
o Key Observations (Weekly and Monthly Timeframes):
Over longer timeframes, correlations between 6E and markets like Gold (GC) strengthen, while the Yen's (6J) correlation with Treasuries becomes more pronounced.
BTC correlations remain unstable, suggesting Bitcoin behaves differently than traditional fiat currencies, particularly in stress periods.
3. BTC Divergence: Behavior During Significant Moves
To assess BTC's behavior during stress periods, we identify significant moves (beyond a predefined threshold) in the Euro (6E) and Yen (6J). Using scatter plots, we plot BTC returns against these currency moves:
BTC vs 6E (Euro):
BTC returns show occasional alignment with Euro movements but also exhibit non-linear patterns. For instance, during sharp Euro declines, BTC has at times remained resilient, highlighting its decoupling from fiat.
BTC vs 6J (Yen):
BTC's reaction to Yen strength/weakness appears more random, lacking a clear pattern. This further underscores BTC’s independence from traditional fiat dynamics, even as Yen strength typically aligns with safe-haven asset flows.
The scatter plots reveal that while fiat currencies like the Euro and Yen maintain consistent relationships with USD-denominated markets, Bitcoin exhibits periods of divergence, particularly during extreme stress events.
4. Focus on Treasury Futures (ZN)
Treasury Futures (ZN) are among the most responsive assets to currency shifts due to their role as a safe-haven instrument during economic uncertainty. Treasury prices often rise when risk aversion drives investors to seek safer assets, particularly when fiat currencies like the Yen (6J) strengthen.
6E/6J Influence on ZN
From the correlation heatmaps:
The Yen (6J) maintains a positive correlation with ZN prices, particularly during periods of market stress.
The Euro (6E) exhibits a moderate correlation, with fluctuations largely dependent on economic events affecting Eurozone stability.
When relative strength shifts in favor of the Yen (6J) over the Euro (6E), Treasury Futures often attract increased demand, reflecting investor flight-to-safety dynamics.
Forward-Looking Trade Idea
Given the above insights, here’s a hypothetical trade idea focusing on 10-Year Treasury Futures (ZN):
Trade Direction: Long Treasury Futures to capitalize on potential safe-haven flows.
Entry Price: 109’29
Target Price: 111’28
Stop Loss: 109’09
Potential for Reward: 126 ticks = $1,968.75
Potential for Risk: 40 ticks = $625
Reward-to-Risk Ratio: 3.15:1
Tick Value: 1/2 of 1/32 of one point (0.015625) = $15.625
Required margin: $2,000 per contract
This trade setup anticipates ZN’s upward momentum if the Yen continues to outperform the Euro or if broader risk-off sentiment triggers demand for Treasuries.
5. Risk Management Importance
Trading currency-driven assets like Treasury Futures or Bitcoin requires a disciplined approach to risk management due to their volatility and sensitivity to macroeconomic shifts. Key considerations include:
a. Stop-Loss Orders:
Always use stop-loss levels to limit downside exposure, especially when markets react sharply to currency moves or unexpected news.
b. Position Sizing:
Adjust position size to match market volatility.
c. Monitor Relative Strength:
Continuously track the 6E/6J ratio to identify shifts in currency strength that could signal changes in safe-haven flows or BTC behavior.
d. Non-Correlated Strategies:
Incorporate BTC into portfolios as a non-correlated asset, especially when fiat currencies exhibit linear correlations with traditional markets.
By implementing proper risk management techniques, traders can navigate the ripple effects of currency moves on markets like Treasuries and Bitcoin.
6. Conclusion
The relative strength between the Euro (6E) and Yen (6J) provides critical insights into the broader market environment, particularly during periods of stress. As shown:
Treasury Futures (ZN): Highly sensitive to Yen strength due to its safe-haven role.
Bitcoin (BTC): Demonstrates unique divergence from fiat currencies, reinforcing its role as a non-traditional asset during volatility.
By analyzing correlations and BTC’s reaction to currency moves, traders can better anticipate opportunities in USD-denominated markets and identify divergence points that signal market shifts.
When charting futures, the data provided could be delayed. Traders working with the ticker symbols discussed in this idea may prefer to use CME Group real-time data plan on TradingView: www.tradingview.com - This consideration is particularly important for shorter-term traders, whereas it may be less critical for those focused on longer-term trading strategies.
General Disclaimer:
The trade ideas presented herein are solely for illustrative purposes forming a part of a case study intended to demonstrate key principles in risk management within the context of the specific market scenarios discussed. These ideas are not to be interpreted as investment recommendations or financial advice. They do not endorse or promote any specific trading strategies, financial products, or services. The information provided is based on data believed to be reliable; however, its accuracy or completeness cannot be guaranteed. Trading in financial markets involves risks, including the potential loss of principal. Each individual should conduct their own research and consult with professional financial advisors before making any investment decisions. The author or publisher of this content bears no responsibility for any actions taken based on the information provided or for any resultant financial or other losses.

BUY XAUUSD | GC Been a while since I last posted a trade, today I’m sharing with you this trade on XAUUSD that you can take with the same TP/SL as mine.
Follow for more trades and let me know ik the comments which market you want me to post an trades on!
