Gold GC1! heading to $3,476 next with a 4.15R long trade TVC:GOLD Gold/ COMEX:GC1! hit the 0.705 fib level right between the 0.618 and 0.786 what I like to call the sweet spot for fibonacci tools. If it misses the 0.618 then the 0.705 is just as good, signals are showing a bottom forming and slowly but sure the rsi is about to cross up over 50, it should pump hard this time
-4.15R trade
-1.5% capital risk
-as soon as gold starts to move, we'll drag our stop loss to or even past break even if it really pops up hard...
Futurestrading

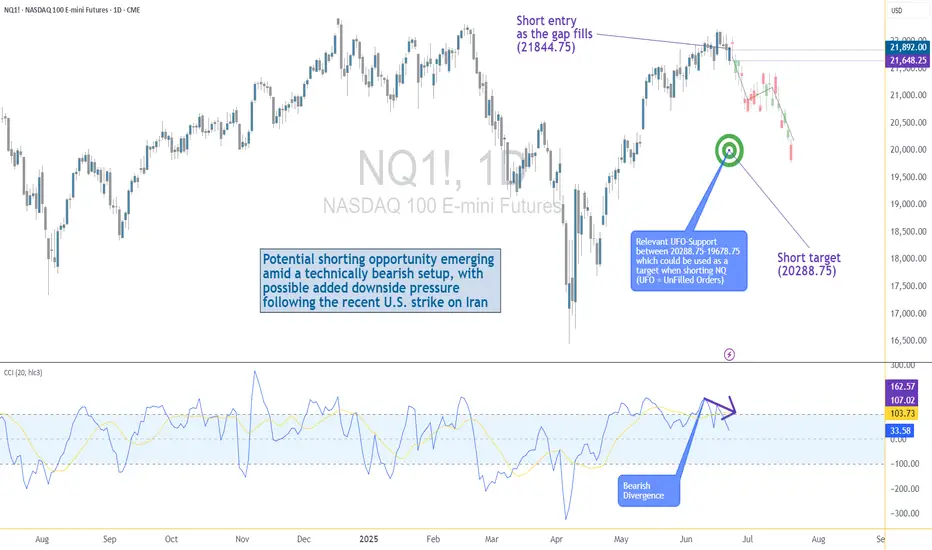
US–Iran Conflict Triggers a Potential Nasdaq Bearish Setup🟣 Geopolitical Flashpoint Meets Technical Confluence
The U.S. weekend airstrike on Iranian nuclear facilities has reignited geopolitical instability across the Middle East. While broader markets often absorb news cycles quickly, high-beta assets like Nasdaq futures (NQ) tend to react more dramatically—especially when uncertainty meets existing technical vulnerability.
Monday’s session opened with a notable gap to the downside, reflecting immediate risk-off sentiment among futures traders. While the initial drop is being retraced intraday, historical patterns suggest that such gap-fills can often serve as ideal shorting zones—particularly when other bearish signals confirm the narrative. The backdrop is clear: this is no ordinary Monday open.
🟣 Bearish Divergence on CCI Builds the Case
From a technical standpoint, the setup gains weight through a clear bearish divergence on the Commodity Channel Index (CCI) using a 20-period setting. While prices recently pushed higher, momentum failed to follow—an early indication that buyers may be running out of steam. This divergence appears just as price approaches the origin of Friday’s gap, a level that frequently acts as a resistance magnet in such contexts. This confluence of weakening momentum and overhead supply aligns perfectly with the geopolitical catalyst, offering traders a compelling argument for a potential reversal in the short term.
🟣 Gap Origin: The Line in the Sand
The origin of the gap sits at 21844.75, a price level now acting as potential resistance. As the market attempts to climb back toward this zone, the likelihood of encountering institutional selling pressure increases. Gap origins often represent unfinished business—zones where prior bullish control was suddenly interrupted. In this case, the added layer of global tension only strengthens the conviction that sellers may look to reassert dominance here. If price action stalls or rejects at this zone, it could become the pivot point for a swift move lower, especially with bearish momentum already flashing caution signals.
🟣 Trade Plan and Reward-to-Risk Breakdown
A potential short trade could be structured using 21844.75 as the entry point—precisely at the gap origin. A conservative stop placement would rest just above the most recent swing high at 22222.00, offering protection against a temporary squeeze. The downside target aligns with a prior UFO support area near 20288.75, where demand previously showed presence. This sets up a risk of 377.25 points versus a potential reward of 1556.00 points, resulting in a reward-to-risk ratio of 4.12:1. For traders seeking asymmetrical opportunity, this ratio stands out as a strong incentive to engage with discipline.
🟣 Futures Specs: Know What You’re Trading
Traders should be aware of contract specifics before engaging. The E-mini Nasdaq-100 Futures (NQ) represent $20 per point, with a minimum tick of 0.25 worth $5.00. Typical margin requirements hover around $31,000, depending on the broker.
For smaller accounts, the Micro Nasdaq-100 Futures (MNQ) offer 1/10th the exposure. Each point is worth $2, with a $0.50 tick value and much lower margins near $3,100.
🟣 Discipline First: Why Risk Management Matters
Volatility driven by geopolitical events can deliver fast gains—but just as easily, fast losses. That’s why stop-loss orders are non-negotiable. Without one, traders expose themselves to unlimited downside, especially in leveraged instruments like futures. Equally critical is the precision of entry and exit levels. Acting too early or too late—even by a few points—can compromise an otherwise solid trade. Always size positions according to your account, and never let emotion override logic. Risk management isn’t a side-note—it’s the foundation that separates professionals from those who simply speculate.
When charting futures, the data provided could be delayed. Traders working with the ticker symbols discussed in this idea may prefer to use CME Group real-time data plan on TradingView: www.tradingview.com - This consideration is particularly important for shorter-term traders, whereas it may be less critical for those focused on longer-term trading strategies.
General Disclaimer:
The trade ideas presented herein are solely for illustrative purposes forming a part of a case study intended to demonstrate key principles in risk management within the context of the specific market scenarios discussed. These ideas are not to be interpreted as investment recommendations or financial advice. They do not endorse or promote any specific trading strategies, financial products, or services. The information provided is based on data believed to be reliable; however, its accuracy or completeness cannot be guaranteed. Trading in financial markets involves risks, including the potential loss of principal. Each individual should conduct their own research and consult with professional financial advisors before making any investment decisions. The author or publisher of this content bears no responsibility for any actions taken based on the information provided or for any resultant financial or other losses.
Bullish trend continues for DogeDogeUSDT still going upwards. Trading in complex zone currently. Lots of liquidity bw 0.15154 and 0.15364. Heading towards 0.15364. Will probably retest 0.15154 before a breakout towards 0.15565.
#dogetothemoon #futuretrading

$100 a barrel coming soon for Crude oil futures In this video we focus on the current accumulation in the oil chart and the prospect of higher prices ahead .
I highlight how the respect of the previous quinquennial pivots gave us a 45% move to the upside in the past 8 weeks .
Looking ahead on the monthly timeframe we have the following confluences above the current price of $75 .
Above the current pa we have the point of control at $ 88 and the avwap at $97, if we can reclaim the poc I think we will continue to push up to the fib levels that I have mentioned in the video.
In addition to the above we also have the decennial pivots at $107/$112 alongside the value area high .
All of this validates for me why oil will be pushing back up throughout the course of the year .
Tools used in the video
Tr pocket , pivots , fived range volume profile and fib expansion

TP REACHED ON OUR TRADE ON OILThis morning I posted to sell on Crude Oil, and our TP got filled to close the week with 5 profitable days strike.
Follow for more!

HYPER ANALYSIS🔮 #HYPER Analysis - Update 🚀🚀
💲 We can see that there is a formation of Falling Wedge Wedge Pattern in #HYPER and we can see a bullish movement after a good breakout. Before that we would see a little retest and and then a bullish movement.
💸Current Price -- $0.1087
📈Target Price -- $0.1358
⁉️ What to do?
- We have marked crucial levels in the chart . We can trade according to the chart and make some profits. 🚀💸
#HYPER #Cryptocurrency #Breakout #DYOR

SELL USOILIt’s been a while since I last posted about American market.
You can sell USOIL, the target is the daily Liquidity high and the stop is at the PVH of the reversal.
Follow for more!

Platinum for a short?after a bullish run, the fundamentals on platinum have shifted sharply into bearish bias, aligning perfectly with a key weekly supply zone. The recent weekly rejection candle confirms seller presence and validates the zone.

Buy the Dip into 0.0070 Pre-Expiry Pin & Policy RiskThe Japanese yen has experienced significant swings in recent weeks, both higher and lower, reflecting a fragile balance between diverging monetary policies and ongoing geopolitical uncertainty. That said, its status as a safe-haven currency continues to offer it defensive appeal among global investors, independent of technical flows, such as the major USD/JPY option expiry scheduled for Monday, June 16.
Fundamental Analysis
Central banks have entered a wait-and-see mode. The Federal Reserve is widely expected to hold rates steady at its upcoming June 18 meeting. According to the CME FedWatch tool, markets price in a 97% probability of no change, with only a 3% chance of an immediate cut. In this context, the USD still benefits from rate differentials, but forward guidance is now increasingly balanced over the next 6 months.
Meanwhile, the Bank of Japan has started to normalize its ultra-loose policy. After decades of zero or negative interest rates, the BoJ raised its policy rate to 0.50% in January 2025. Although no hike is expected on June 17, the central bank has signaled vigilance toward imported inflation and yen depreciation. As a result, the USD/JPY interest rate gap remains wide but is gradually narrowing.
On the geopolitical front, Israel’s recent airstrike on Iranian strategic sites has lifted energy prices and reignited risk aversion. The VIX briefly jumped around 22, before retreating to 20. Historically, such uncertainty tends to benefit the yen, as risk-averse capital flows gravitate toward defensive assets.
Technical Analysis
The Japanese currency has gained over 8% year-to-date, with spot USD/JPY retreating to a low of 140 in April. This level corresponds to 0.007263 on the 6JU2025 futures contract.
We now shift focus to the September contract, with the March expiry settling this Monday.
After the volatility spike mostly driven by US tariffs (which pushed the VIX above 50 for the first time since the pandemic), risk conditions have stabilized. The yen has since consolidated within a well-defined range with stable volumes.
In late May, buyers stepped in aggressively around 0.00692, leading to a sharp rebound to 0.00710. Price action has now stabilized near 0.00700, inside a pivot zone that acts both as equilibrium and a tactical entry area. These dynamics suggest a buy-on-dip strategy may offer strong asymmetry.
If price returns to the 0.00692–0.00700 area, the trade setup remains valid. However, a clean daily break below 0.00691 would invalidate the bullish view and suggest a return to a broader sideways range.
Sentiment Analysis
According to the CFTC Commitment of Traders (COT) report, asset managers remain net long the yen, reflecting a structurally bullish bias. These positions are consistent with macro/geopolitical hedging strategies, and reflect growing expectations that the policy rate differential between the Fed and the BoJ may gradually narrow.
On the retail side, positioning is surprisingly neutral on USD/JPY, a rare condition for a pair often dominated by consensus directional trades. This suggests that retail traders are in a wait-and-see mode, likely due to the policy event risk ahead.
Options Analysis – The $7 Billion USD/JPY 145.00 Magnet
A massive $7+ billion USD/JPY option position at the 145.00 strike is due to expire Monday, June 16, at the 10am NY cut. This level currently acts as a gravitational anchor on spot price action, keeping USD/JPY within a tight range near 145.
Market makers are likely adjusting hedges as expiry approaches, suppressing volatility in the short term. This has also indirectly stabilized the 6JU2025 contract in the 0.00700–0.00705 range.
Once the strike expires, we may see a volatility release and potentially a new trend emerge, depending on the Fed-BoJ policy tone.
Trade Idea – Buy on Dip Around 0.00700
Strategy: Buy the pullback ahead of expiry and potential breakout
• Entry target: Buy at 0.0070000 (tactical dip zone)
• Stop-loss: 0.0069100 (below the May 29 rejection low)
• Take-Profit 1: 0.0071000 (recent resistance)
• Take-Profit 2: 0.0072500 (near YTD highs)
Rationale:
Geopolitical risk and Fed-BoJ policy events support safe-haven flows
• Technically clean reaction from 0.00692 suggests strong buying interest
• Option expiry-induced pin near spot 145 could offer a lower entry window
• COT positioning supports a bullish JPY view
• Attractive risk-reward setup with tight stop
This setup allows traders to take advantage of a volatility compression regime due to options expiry before potential breakout catalysts next week, with well-defined risk.
The 6JU2025 contract is currently resting in a strategic equilibrium zone near 0.00700. Macro fundamentals and speculative positioning both argue in favor of yen stabilization or modest appreciation.
The expiry of the $7B option on Monday, followed by central bank events midweek, could unleash a directional move. Until then, a dip-buying strategy near 0.0070 appears compelling, as long as the 0.00691 support holds on a daily closing basis.
When charting futures, the data provided could be delayed. Traders working with the ticker symbols discussed in this idea may prefer to use CME Group real-time data plan on TradingView: tradingview.com/cme/.
This consideration is particularly important for shorter-term traders, whereas it may be less critical for those focused on longer-term trading strategies.
General Disclaimer:
The trade ideas presented herein are solely for illustrative purposes forming a part of a case study intended to demonstrate key principles in risk management within the context of the specific market scenarios discussed. These ideas are not to be interpreted as investment recommendations or financial advice. They do not endorse or promote any specific trading strategies, financial products, or services. The information provided is based on data believed to be reliable; however, its accuracy or completeness cannot be guaranteed. Trading in financial markets involves risks, including the potential loss of principal. Each individual should conduct their own research and consult with professional financial advisors before making any investment decisions. The author or publisher of this content bears no responsibility for any actions taken based on the information provided or for any resultant financial or other losses.

ZCU25 CORN... It ALWAYS comes down to cornAND I'M BACK AND DUMBER THAN EVER
Listen up Honkies, this trade has a 93% probability based on the historical data over the last 30 years. So I bet Muhammad my 3rd ex-wife and a half of my second step child. The reason this trade works is easy! We all have felt and understand FUD (Fear, Uncertainty, and Doubt) and how the market reacts, I understood this on my second ex-wife when she got a boyfriend. So in late June pollination season occurs with corn and the yield is unknown for the next year, this is a very simple way of looking at the agricultural industry and how the market corrects. The trade is set up in two stages in order to maximize profit. The first stage, with the FUD in pollination season typically results in a 15-20% drop, I split the difference at 17% lets make it easier than my first divorce. This usually occurs around June 26th and can extend to July 17th. Around July 15th to the 20th the projected yield is shared and the market recorrects to the upside as the numbers represented due to the FUD don't represent the price action in the futures market, and because the futures market is speculatory (Adult Gambling) the degens will pump the contracts up looking for a quick buck like my third wife. Now in order to not go broke while you're trying to buy your ex wife's boyfriend's son a new car, you need to hedge the contract in a calendar spread aka intra-commodity spread, so do the opposite in combination on the march 2026 corn contract as the maintance is lower and the price action isn't there due to open interest in the market, so let that contract ride if it goes against you. SO! you short the ZCU25 while longing the ZCH26, then offset the contracts when direction changes and long ZCU25 and short ZCH26, it's as easy as 1,2,8. Had to repost this forgot the Tags my bad.
"all I need is one trade to pay all the alimony for this year."
-KewlKat

SPX500 – Volatile Week Ahead as Trade Talks and CPI LoomSPX500 | Overview
Fundamental Insight:
S&P 500 futures edged lower early Monday as traders brace for a high-impact week.
Key events include:
- US-China trade talks in London (Monday)
- U.S. inflation data (CPI) expected midweek (Wednesday)
Markets are cautious, awaiting clarity from both geopolitical developments and macroeconomic indicators, which could trigger strong directional moves.
Technical Outlook:
The price appears to be entering a correction phase, with the potential to drop toward 5966.
A confirmed break below 5966 may extend the bearish trend toward 5938 and 5902.
However, a break above 6030 would invalidate the bearish scenario and could trigger a bullish continuation toward 6098 and potentially a new all-time high (ATH).
Pivot Line: 6010
Support Levels: 5966, 5938, 5902
Resistance Levels: 6030, 6098

Heatwaves and Wheat: How Temperature Shocks Hit Prices🌾 Section 1: The Wheat–Weather Connection—Or Is It?
If there’s one crop whose success is often tied to the weather forecast, it’s wheat. Or so we thought. For decades, traders and analysts have sounded the alarm at the mere mention of a heatwave in key wheat-producing regions. The logic? Excessive heat during the growing season can impair wheat yields by disrupting pollination, shortening the grain-filling period, or damaging kernel development. A tightening supply should lead to price increases. Simple enough, right?
But here’s where the story takes an unexpected turn.
What happens when we actually analyze the data? Does heat reliably lead to price spikes in the wheat futures market? The short answer: not exactly. In fact, our statistical tests show that temperature may not have the consistent, directional impact on wheat prices that many traders believe it does.
And that insight could change how you think about risk, seasonality, and the role of micro contracts in your wheat trading strategy.
📈 Section 2: The Economics of Wheat—And Its Role in the Futures Market
Wheat isn’t just a breakfast staple—it’s the most widely grown crop in the world. It’s cultivated across North America, Europe, Russia, Ukraine, China, and India, making it a truly global commodity. Because wheat is produced and consumed everywhere, its futures markets reflect a wide array of influences: weather, geopolitics, global demand, and speculative positioning.
The Chicago Board of Trade (CBOT), operated by CME Group, is the main venue for wheat futures trading. It offers two primary wheat contracts:
Standard Wheat Futures (ZW)
Contract Size: 5,000 bushels
Tick Size: 1/4 cent per bushel (0.0025) has a $12.50 per tick impact
Margin Requirement: Approx. $1,700 (subject to change)
Micro Wheat Futures (MZW)
Contract Size: 500 bushels (1/10th the size of the standard contract)
Tick Size: 0.0050 per bushel has a $2.50 per tick impact
Margin Requirement: Approx. $170 (subject to change)
These micro contracts have transformed access to grain futures markets. Retail traders and smaller funds can now gain precise exposure to weather-driven moves in wheat without the capital intensity of the full-size contract.
🌡️ Section 3: Weather Normalization—A Smarter Way to Measure Impact
When analyzing weather, using raw temperature values doesn’t paint the full picture. What’s hot in Canada might be normal in India. To fix this, we calculated temperature percentiles per location over 40+ years of historical weather data.
This gave us three weekly categories:
Below 25th Percentile (Low Temp Weeks)
25th to 75th Percentile (Normal Temp Weeks)
Above 75th Percentile (High Temp Weeks)
Using this approach, we grouped thousands of weeks of wheat futures data and examined how price returns behaved under each condition. This way, we could compare a “hot” week in Ukraine to a “hot” week in the U.S. Midwest—apples to apples.
🔄 Section 4: Data-Driven Temperature Categories and Wheat Returns
To move beyond anecdotes and headlines, we then calculated weekly percent returns for wheat futures (ZW) for each of the three percentile-based categories.
What we found was surprising.
Despite common assumptions that hotter weeks push wheat prices higher, the average returns didn’t significantly increase during high-temperature periods. However, something else did: volatility.
In high-temp weeks, prices swung more violently — up or down — creating wider return distributions. But the direction of these moves lacked consistency. Some heatwaves saw spikes, others fizzled.
This insight matters. It means that extreme heat amplifies risk, even if it doesn't create a reliable directional bias.
Traders should prepare for greater uncertainty during hot weeks — an environment where tools like micro wheat futures (MZW) are especially useful. These contracts let traders scale exposure and control risk in turbulent market conditions tied to unpredictable weather.
🔬 Section 5: Statistical Shock—The t-Test Revelation
To confirm our findings, we ran two-sample t-tests comparing the returns during low vs. high temperature weeks. The goal? To test if the means of the two groups were statistically different.
P-Value (Temp Impact on Wheat Returns): 0.354 (Not Significant)
Conclusion: We cannot reject the hypothesis that average returns during low and high temp weeks are the same.
This result is counterintuitive. It flies in the face of narratives we often hear during weather extremes.
However, our volatility analysis (using boxplots) showed that variance in returns increases significantly during hotter weeks, making them less predictable and more dangerous for leveraged traders.
🧠 Section 6: What Traders Can Learn from This
This analysis highlights a few key lessons:
Narratives aren’t always backed by data. High heat doesn’t always mean high prices.
Volatility increases during weather stress. That’s tradable, but not in the way many assume.
Risk-adjusted exposure matters. Micro wheat futures (MZW) are ideal for navigating weather-driven uncertainty.
Multi-factor analysis is essential. Weather alone doesn’t explain price behavior. Global supply chains, speculative flows, and other crops’ performance all play a role.
This article is part of a growing series where we explore the relationship between weather and agricultural futures. From corn to soybeans to wheat, each crop tells a different story. Watch for the next release—we’ll be digging deeper into more effects and strategies traders can use to capitalize on weather.
When charting futures, the data provided could be delayed. Traders working with the ticker symbols discussed in this idea may prefer to use CME Group real-time data plan on TradingView: www.tradingview.com - This consideration is particularly important for shorter-term traders, whereas it may be less critical for those focused on longer-term trading strategies.
General Disclaimer:
The trade ideas presented herein are solely for illustrative purposes forming a part of a case study intended to demonstrate key principles in risk management within the context of the specific market scenarios discussed. These ideas are not to be interpreted as investment recommendations or financial advice. They do not endorse or promote any specific trading strategies, financial products, or services. The information provided is based on data believed to be reliable; however, its accuracy or completeness cannot be guaranteed. Trading in financial markets involves risks, including the potential loss of principal. Each individual should conduct their own research and consult with professional financial advisors before making any investment decisions. The author or publisher of this content bears no responsibility for any actions taken based on the information provided or for any resultant financial or other losses.

TURBO ANALYSIS📊 #TURBO Analysis
✅There is a formation of Falling Wedge Pattern on daily chart and currently pullback around its major support zone🧐
Pattern signals potential bullish movement incoming after sustain above the major support zone and breaks the pattern with good volume
👀Current Price: $0.004050
🚀 Target Price: $0.004470
⚡️What to do ?
👀Keep an eye on #TURBO price action and volume. We can trade according to the chart and make some profits⚡️⚡️
#TURBO #Cryptocurrency #TechnicalAnalysis #DYOR

Short Crude Oil for The LeapRisk free trade for $100 on MCL
Scaling out of the trade from 4 hour supply to 4 hour demand.
Using the TrendCloud Trading System and it's working great.
So far I'm in the top 7% for this competition.
Focusing on managing this crude oil trade and also the opening range on the MNQ and NQ
Huge win on day 1 for $4000 on NQ opening range using the TrendCloud Trading Strategy.
Backtesting data shows great results. Super proud of this. It took me a month to program everything properly and optimize specifically for the NQ.

Still waters before ECB waves?This morning, Euro FX futures (June contract 6EM5) are trading around 1.14300, still contained within the upper end of a well-established range between 1.1350 and 1.1450. The volume profile continues to show a heavy concentration of activity around 1.1380, reflecting a neutral stance from market participants as they await the ECB’s policy decision later today.
The macro context is clear: eurozone inflation just came in at 1.9% YoY, a figure already below the ECB’s 2% target, and the consistency of the disinflation trend has shifted expectations. Markets now see today’s 25 basis point rate cut as a near certainty, bringing the deposit rate from 2.40% to 2.15%.
But the real focus lies in the forward guidance. Investors will be watching closely for signals on whether the ECB will continue easing through the summer or adopt a more cautious, data-dependent stance, especially with the Federal Reserve still on hold in a 4.25–4.50% range, and US inflation proving more persistent.
Sentiment remains neutral to slightly bearish: retail traders are still about 60% short, while institutional flows appear more balanced. Implied volatility is low, with EUR/USD vol and the VIX both subdued, creating ideal conditions for range trading, at least on the surface.
With significant open interest sitting at 1.1350 and 1.1400 on the June 6EM5 options board, the market is effectively pinned and in wait mode. Traders will need to stay nimble while the post-decision reaction could break this temporary equilibrium.
Time for perspective: when markets go quiet, let’s get curious
With the market clearly in limbo and no compelling directional trade setup this morning, it’s an ideal opportunity to step back and look deeper at what this range-bound phase might be hiding.
Periods of low volatility and tight consolidation may feel uneventful, but they often precede the most decisive market moves. Traders who understand the structural dynamics behind these calm phases, and why they often lead to sharp breakouts, will be better positioned to react quickly when volatility returns.
So, what exactly makes low volatility environments potentially dangerous? Let’s unpack the mechanics behind the calm-before-the-storm setup.
Why low volatility often precedes an explosive breakout
1. Position buildup and leverage exposure
In range-bound markets, traders tend to build up positions near support and resistance levels, often with excessive leverage. The longer a range holds, the more confident participants become in fading it, creating clusters of stop-loss orders just beyond the boundaries. Once price breaks out, those stops can cascade and generate fast, exaggerated moves in the direction of the breakout. This is particularly relevant in the FX space, where margin and leverage are widely used.
2. Dealer positioning and gamma squeeze risk
Low-volatility regimes are often accompanied by aggressive option selling. Dealers who are short options (typically on both sides) hedge delta exposure daily. As price approaches heavily populated strikes (such as 1.1400), they may be forced to buy or sell futures to remain neutral. If the underlying breaks out beyond a major strike, dealers can become forced buyers or sellers, driving price further in the same direction. This feedback loop is known as a gamma squeeze, and it's a common driver of explosive moves from low-volatility setups.
3. Liquidity compression outside the range
Inside established ranges, liquidity is typically deep. Market makers and passive orders ensure two-sided flow. But once the market breaks out, liquidity can evaporate. With fewer resting orders above resistance or below support, price can jump large distances on relatively light flow. This creates the conditions for quick, directional surges, not because of massive volume, but because of a sudden absence of liquidity.
4. Misleading risk models
Risk systems like Value-at-Risk (VaR) generally rely on recent historical volatility to determine position sizing and exposure. In prolonged calm markets, VaR shrinks and risk budgets expand. Traders and institutions might take on larger positions than they would in more volatile environments, falsely reassured by the quiet. If a breakout suddenly injects volatility into the system, these positions can become excessively risky, triggering a chain of margin calls, forced liquidations, or panic adjustments, all of which further amplify the move.
5. The psychological trap of stability
Perhaps most importantly, low volatility lulls traders into complacency. They shrink their stop losses, stretch their entries, and begin to assume the range will hold “because it has.” But volatility is mean-reverting by nature. When a catalyst appears, be it a surprise from the ECB, geopolitical headlines, or simply a technical breakout, the transition from low to high volatility is often violent and abrupt.
Final thought: expect the unexpected
Traders, especially retail traders, love quiet markets, until they stop being quiet. This morning, the euro is pinned in place, volatility is suppressed, and positioning is relatively balanced. But beneath this apparent calm lies a market ripe for reprice.
The ECB is widely expected to cut rates by 25 basis points today, that much is in the price. What’s not yet priced, however, is the exact message that will accompany the move. If the ECB delivers a dovish tone, the euro is likely to weaken. But if the statement or press conference turns out more hawkish than expected, even slightly, the euro could rally sharply.
When volatility is cheap and expectations are compressed, it takes little to unleash a large move. So while there’s no clear trade to take right now, this is the kind of day that sets the tone for the next few weeks.
When charting futures, the data provided could be delayed. Traders working with the ticker symbols discussed in this idea may prefer to use CME Group real-time data plan on TradingView: tradingview.com/cme/.
This consideration is particularly important for shorter-term traders, whereas it may be less critical for those focused on longer-term trading strategies.
General Disclaimer:
The trade ideas presented herein are solely for illustrative purposes forming a part of a case study intended to demonstrate key principles in risk management within the context of the specific market scenarios discussed. These ideas are not to be interpreted as investment recommendations or financial advice. They do not endorse or promote any specific trading strategies, financial products, or services. The information provided is based on data believed to be reliable; however, its accuracy or completeness cannot be guaranteed. Trading in financial markets involves risks, including the potential loss of principal. Each individual should conduct their own research and consult with professional financial advisors before making any investment decisions. The author or publisher of this content bears no responsibility for any actions taken based on the information provided or for any resultant financial or other losses.

Volume Speaks Louder: My Custom Volume Indicator for Futures
My Indicator Philosophy: Think Complex, Model Simple
In my first “Modeling 101” class as an undergrad, I learned a mantra that’s stuck with me ever since: “Think complex, but model simple.” In other words, you can imagine all the complexities of a system, but your actual model doesn’t have to be a giant non-convex, nonlinear neural network or LLM—sometimes a straightforward, rule-based approach is all you need.
With that principle in mind, and given my passion for trading, I set out to invent an indicator that was both unique and useful. I knew countless indicators already existed, each reflecting its creator’s priorities—but none captured my goal: seeing what traders themselves are thinking in real time . After all, news is one driver of the market, but you can’t control or predict news. What you can observe is how traders react—especially intraday—so I wanted a simple way to gauge that reaction.
Why intraday volume ? Most retail traders (myself included) focus on shorter timeframes. When they decide to jump into a trade, they’re thinking within the boundaries of a single trading day. They rarely carry yesterday’s logic into today—everything “resets” overnight. If I wanted to see what intraday traders were thinking, I needed something that also resets daily. Price alone didn’t do it, because price continuously moves and never truly “starts over” each morning. Volume, however, does reset at the close. And volume behaves like buying/selling pressure—except that raw volume numbers are always positive, so they don’t tell you who is winning: buyers or sellers?
To turn volume into a “signed” metric, I simply use the candle’s color as a sign function. In Pine Script, that looks like:
isGreenBar = close >= open
isRedBar = close < open
if (not na(priceAtStartHour))
summedVolume += isGreenBar ? volume : -volume
This way, green candles add volume and red candles subtract volume, giving me positive values when buying pressure dominates and negative values when selling pressure dominates. By summing those signed volumes throughout the day, I get a single metric—let’s call it SummedVolume—that truly reflects intraday sentiment.
Because I focus on futures markets (which have a session close at 18:00 ET), SummedVolume needs to reset exactly at session close. In Pine, that reset is as simple as:
if (isStartOfSession())
priceAtStartHour := close
summedVolume := 0.0
Once that bar (6 PM ET) appears, everything zeroes out and a fresh count begins.
SummedVolume isn’t just descriptive—it generates actionable signals. When SummedVolume rises above a user-defined Long Threshold, that suggests intraday buying pressure is strong enough to consider a long entry. Conversely, when SummedVolume falls below a Short Threshold, that points to below-the-surface selling pressure, flagging a potential short. You can fine-tune those thresholds however you like, but the core idea remains:
• Positive SummedVolume ⇒ net buying pressure (bullish)
• Negative SummedVolume ⇒ net selling pressure (bearish)
Why do I think it works: Retail/intraday traders think in discrete days. They reset their mindset at the close. Volume naturally resets at session close, so by signing volume with candle color, I capture whether intraday participants are predominantly buying or selling—right now.
Once again: “Think complex, model simple.” My Daily Volume Delta (DVD) indicator may look deceptively simple, but five years of backtesting have proven its edge. It’s a standalone gauge of intraday sentiment, and it can easily be combined with other signals—moving averages, volatility bands, whatever you like—to amplify your strategy. So if you want a fresh lens on intraday momentum, give SummedVolume a try.

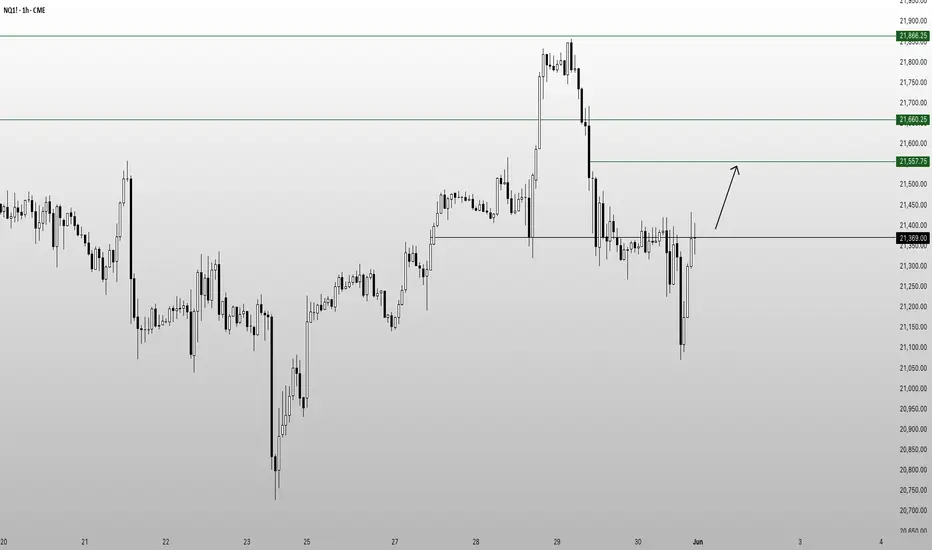
NQ's next targetCME_MINI:NQ1! looks to be in a 50/50 probability...maybe
I am only expecting price to reach $21557
This is the clearest target so far. This is subject to Sundays open also.
But looking for price to reach this level and then we will get a better understanding on the next draw.
Weather and Corn: A Deep Dive into Temperature Impact1. Introduction: Corn and Climate – An Inseparable Relationship
For traders navigating the corn futures market, weather isn't just a background noise—it's a market mover. Few agricultural commodities are as sensitive to environmental variables as corn, especially temperature. Corn is grown across vast regions, and its development is directly tied to how hot or cold the season plays out. This makes weather not just a topic of interest but a core input in any corn trader’s playbook.
In this article, we go beyond conventional wisdom. Instead of simply assuming “hotter equals bullish,” we bring data into the equation—weather data normalized by percentile, matched with price returns on CME Group's corn futures. The results? Useful for anyone trading ZC or MZC contracts.
2. How Temperature Affects Corn Physiology and Yields
At the biological level, corn thrives best in temperatures between 77°F (25°C) and 91°F (33°C) during its growth stages. During pollination—a critical yield-defining window—extreme heat (especially above 95°F / 35°C) can cause irreversible damage. When hot weather coincides with drought, the impact on yields can be catastrophic.
Historical drought years like 2012 and 1988 serve as powerful examples. In 2012, persistent heat and dryness across the US Midwest led to a national yield drop of over 25%, sending futures skyrocketing. But heat doesn't always spell disaster. Timing matters. A heat wave in early June may have little impact. That same wave during tasseling in July? Major consequences.
3. The Market Mechanism: How Traders Respond to Temperature Surprises
Markets are forward-looking. Futures prices don’t just reflect today’s weather—they reflect expectations. A dry June may already be priced in by the time USDA issues its report. This dynamic creates an interesting challenge for traders: separating noise from signal.
During July and August—the critical reproductive phase—temperature updates from NOAA and private forecasters often trigger major moves. Rumors of an incoming heat dome? Corn futures might gap up overnight. But if it fizzles out, retracements can be just as dramatic. Traders who rely on headlines without considering what’s already priced in are often late to the move.
4. Our Analysis: What the Data Reveals About Corn and Temperature
To cut through the fog, we performed a percentile-based analysis using decades of weather and price data. Rather than looking at raw temperatures, we classified each week into temperature “categories”:
Low Temperature Weeks: Bottom 25% of the historical distribution
Normal Temperature Weeks: Middle 50%
High Temperature Weeks: Top 25%
We then analyzed weekly percentage returns for the corn futures contract (ZC) in each category. The outcome? On average, high-temperature weeks showed higher volatility—but not always higher returns. In fact, the data revealed that some extreme heat periods were already fully priced in, limiting upside.
5. Statistically Significant or Not? T-Tests and Interpretation
To test whether the temperature categories had statistically significant impacts on weekly returns, we ran a t-test comparing the “Low” vs. “High” temperature groups. The result: highly significant. Corn returns during high-temperature weeks were, on average, notably different than those during cooler weeks, with a p-value far below 0.01 (4.10854357245787E-13).
This tells us that traders can't ignore temperature anomalies. Extreme heat does more than influence the narrative—it materially shifts price behavior. That said, the direction of this shift isn't always bullish. Sometimes, high heat correlates with selling, especially if it’s viewed as destructive beyond repair.
6. Strategic Takeaways for Corn Traders
Traders can use this information in several ways:
Anticipatory Positioning: Use temperature forecasts to adjust exposure ahead of key USDA reports.
Risk Management: Understand that volatility spikes in extreme temperature conditions and plan stops accordingly.
Calendar Sensitivity: Prioritize weather signals more heavily in July than in May, when crops are less vulnerable.
Combining weather percentile models with weekly return expectations can elevate a trader’s edge beyond gut feel.
7. CME Group Corn Futures and Micro Corn Contracts
Corn traders have options when it comes to accessing this market. The flagship ZC futures contract from CME Group represents 5,000 bushels of corn and is widely used by commercial hedgers and speculators alike. For those seeking more precision or lower capital requirements, the recently launched Micro Corn Futures (MZC) represent just 1/10th the size.
This fractional sizing makes temperature-driven strategies more accessible to retail traders, allowing them to deploy seasonal or event-based trades without excessive risk exposure.
Here are some quick key points to remember:
Tick size for ZC is ¼ cent (0.0025) per bushel, equating to $12.50 per tick.
For MZC, each tick is 0.0050 equating to $2.50 per tick.
Standard ZC initial margin is approximately $1,000 and MZC margins are around $100 per contract, though this can vary by broker.
8. Wrapping Up: Temperature's Role in a Complex Equation
While temperature is a key driver in corn futures, it doesn't act in isolation. Precipitation, global demand, currency fluctuations, and government policies also play crucial roles. However, by quantifying the impact of extreme temperatures, traders gain a potential edge in anticipating market behavior.
Future articles will expand this framework to include precipitation, international weather events, and multi-variable models.
This article is part of a broader series exploring how weather impacts the corn, wheat, and soybean futures markets. Stay tuned for the next release, which builds directly on these insights.
When charting futures, the data provided could be delayed. Traders working with the ticker symbols discussed in this idea may prefer to use CME Group real-time data plan on TradingView: www.tradingview.com - This consideration is particularly important for shorter-term traders, whereas it may be less critical for those focused on longer-term trading strategies.
General Disclaimer:
The trade ideas presented herein are solely for illustrative purposes forming a part of a case study intended to demonstrate key principles in risk management within the context of the specific market scenarios discussed. These ideas are not to be interpreted as investment recommendations or financial advice. They do not endorse or promote any specific trading strategies, financial products, or services. The information provided is based on data believed to be reliable; however, its accuracy or completeness cannot be guaranteed. Trading in financial markets involves risks, including the potential loss of principal. Each individual should conduct their own research and consult with professional financial advisors before making any investment decisions. The author or publisher of this content bears no responsibility for any actions taken based on the information provided or for any resultant financial or other losses.

AAVE ANALYSIS🔮 #AAVE Analysis 💰💰
📊 #AAVE is making perfect and huge rounding bottom pattern in daily time frame, indicating a potential bullish move. If #AAVE retests little bit and breakout the pattern with high volume then we will get a bullish move📈
🔖 Current Price: $248
⏳ Target Price: $348
⁉️ What to do?
- We have marked crucial levels in the chart . We can trade according to the chart and make some profits. 🚀💸
#AAVE #Cryptocurrency #Pump #DYOR

ONDO ANALYSIS📊 #ONDO Analysis
✅There is a formation of Descending triangle pattern on weekly chart 🧐
After a small retest towards to its support zone we would see a bullish movement
👀Current Price: $0.8820
⚡️What to do ?
👀Keep an eye on #ONDO price action and volume. We can trade according to the chart and make some profits⚡️⚡️
#ONDO #Cryptocurrency #TechnicalAnalysis #DYOR

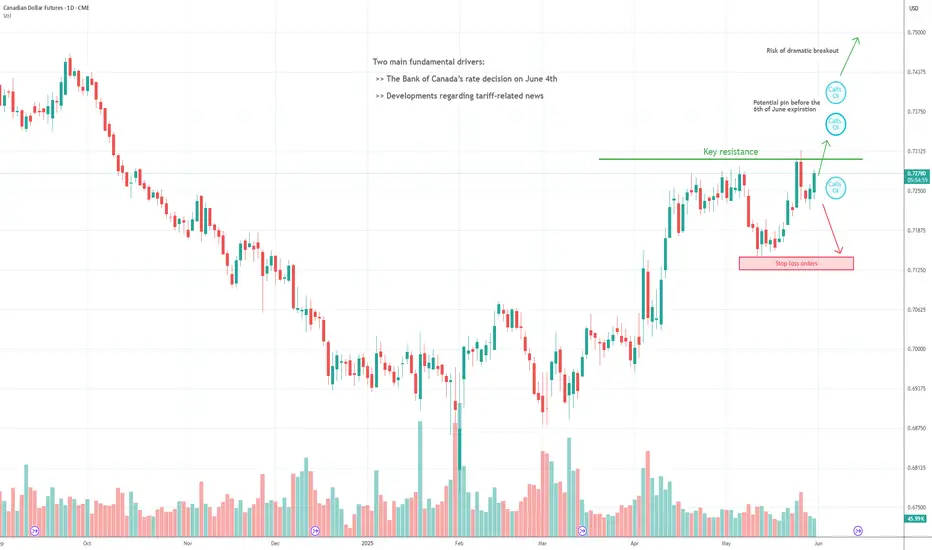
Action Plan for the Next Big MoveThe Canadian Dollar (CAD) is trading around 0.725, caught in a rare balance where clear conviction is elusive and volatility appears to be compressing, beneath the surface, the stage is set for a potentially explosive move. With the Bank of Canada set to announce its policy decision next week and trade issues with the US still simmering, the market feels poised for a major breakout, even as the immediate backdrop remains subdued.
Fundamental Analysis: Waiting Game with Trade Tension
All eyes are on the Bank of Canada’s upcoming decision. The policy rate, having dropped to 2.75% after a string of seven cuts, now stands at its lowest level in nearly three years. The latest inflation print (1.7%) supports a cautious stance, and the market is pricing in a 70% chance of no change. Yet, this calm could be deceptive: should inflation slip further or job data disappoint, talk of renewed easing will return quickly.
Canada’s deep trade relationship with the United States means any change in tariff policy is especially consequential. Although a US court recently ruled in favor of Canada, experts warn that the broader tariff debate is far from over. Any fresh escalation or, conversely, an easing of trade tensions could move the CAD sharply in either direction. Meanwhile, a mild rebound in oil prices adds some support, but the real driver remains policy and politics.
For now, fundamentals argue for patience, with no strong directional bias until the next catalyst emerges.
Technical Analysis: Tight Range, But Pressure Is Building
Price action has settled into a well-defined range after the sharp volatility of late May. The contract retreated to the point of control at 0.7220, absorbing liquidity and confirming this zone as reliable short-term support. On the upside, repeated failures above 0.73, including rejection wicks earlier this week, highlight strong resistance and a market not yet ready to commit to a sustained trend.
Despite the lack of a decisive move, this compression phase often precedes an outsized breakout, especially with macro catalysts on the horizon.
Sentiment Analysis: Crosswinds, Not Clarity
Institutional flows show a recent uptick in short positions on the CAD, while retail sentiment appears balanced to slightly bullish CAD (short USD/CAD), reflecting indecision. The VIX, now close to its annual average, signals that risk appetite is neutral, there’s little evidence of panic or euphoria. This cocktail leaves the CAD without a clear consensus but suggests that when conviction returns, the move could be sharp.
Listed Options Analysis: Pin Risk, Gamma Potential, and the Calm Before Volatility
The monthly options board reveals significant open interest in calls clustered between 0.7350 and 0.74 for the next expiration, the 6th of June, while downside protection is less pronounced. Implied volatility, though lower than recent extremes, remains elevated compared to historical averages, and there’s a mild bias toward downside hedges. If spot moves above 0.73, options dynamics could quickly flip, fueling an upside acceleration toward 0.7350 or even higher, as dealers are forced to chase delta hedges. A pin at these strikes is possible if the move is not explosive, but a genuine breakout could be dramatic.
Trade Idea: Flexibility Over Forecasting
With so many crosscurrents and volatility compressing, the market appears primed for a breakout. Rather than forcing a directional bet, the most rational approach is to prepare for both outcomes with clear levels.
Bullish Breakout Scenario
Entry: Buy above 0.7320 (daily close or strong breakout confirmation)
Stop: 0.7245 (below recent support)
Target 1: 0.7395 (OI cluster)
Target 2: 0.7500 (psychological level)
Bearish Breakdown Scenario
Entry: Sell below 0.7220 (daily close or strong breakout confirmation)
Stop: 0.7310 (above the prior resistance)
Target: 0.7145 (recent lows/retail stops)
Rather than predict, this approach lets price action dictate. Volatility may be low for now, but context argues that a range breakout, especially to the upside, could be sudden and violent given options positioning and macro uncertainty.
With policy on pause, trade headlines pending, and options open interest suggesting magnetic levels higher, the CAD sits on the edge of potential. As volatility compresses, the market’s indecision is itself the clearest signal: the next major move, when it comes, is likely to be fast and fueled by positioning. Flexibility, not bias, is the trader’s greatest edge in this environment. Be ready for it.
When charting futures, the data provided could be delayed. Traders working with the ticker symbols discussed in this idea may prefer to use CME Group real-time data plan on TradingView: tradingview.com/cme/.
This consideration is particularly important for shorter-term traders, whereas it may be less critical for those focused on longer-term trading strategies.
General Disclaimer:
The trade ideas presented herein are solely for illustrative purposes forming a part of a case study intended to demonstrate key principles in risk management within the context of the specific market scenarios discussed. These ideas are not to be interpreted as investment recommendations or financial advice. They do not endorse or promote any specific trading strategies, financial products, or services. The information provided is based on data believed to be reliable; however, its accuracy or completeness cannot be guaranteed. Trading in financial markets involves risks, including the potential loss of principal. Each individual should conduct their own research and consult with professional financial advisors before making any investment decisions. The author or publisher of this content bears no responsibility for any actions taken based on the information provided or for any resultant financial or other losses.
Nasdaq Bulls Back in the Fight – 21K Is the Battlefield📍 The 21K Line in the Sand – Nasdaq’s Second Chance Setup
The bounce off the purple EMA was no joke — big reaction, and now we’re reclaiming key structure: back above VWAP (red), white EMA, and even the weekly pivot (straight orange line).
That pivot zone at 21K is still the line in the sand. I do expect a potential breach — maybe even a quick liquidity sweep — but if buyers step in with momentum and reclaim, I’m interested in longs again.
⚔️ This is a momentum shift — structure's back in favor of bulls, and until we lose 21K with conviction, I’m treating dips into that area as buyable.
📍And if price overreacts? I’m watching 20,750 as a “second chance” zone. Strong bounce there before — I’m not ignoring that twice.
This is still a two-sided game, but for now, bulls are back in position. Let’s see if they hold the line.

BTC Short analysis + GRID Bot Scalper Strategy for BTC FuturesHELLO DEAR TRADERS,
If you're reading this right now, consider yourself one of the lucky few. You're gaining access to insights that, until now, have remained exclusive — reserved for a very small circle of insiders and influencers.
For a long time, we've hesitated to step into the spotlight and reveal the deeper truth behind the movements of financial markets. But everything comes in due time… and that time is getting closer.
Have you ever wondered how figures like Trump or Elon Musk always seem to bet on the right horse?
Many believe they're the ones moving the markets — but that’s far from the truth.
The real secret?
Their teams have access to advanced tools and knowledge — the right kind of science — to analyze the markets in ways most people can’t even imagine.
We won't go into too much detail here — some information is too powerful (and risky) to be shared publicly. But remember this:
"Trading is a game. And if you know the rules, you always play to win."
Starting today, we’ll be introducing a completely new vision of how to trade the financial markets — or any asset whose price is reflected on a chart.
Get ready to see the markets like never before. 🔥
Scalping Made Simple: The Power of GRID Bots
If you're serious about scalping the markets, one of the most effective tools at your disposal is the GRID trading bot. When properly configured, it can deliver consistent, automated profits by executing micro-trades around the clock.
Let’s be real:
Sitting in front of charts all day, hunting for the perfect sniper entry, is not just exhausting — it’s inefficient.
Why not let automation do the heavy lifting while you focus on strategy?
________________________________________
⚙️ AUTO SCALPER MODE: ON (SHORT TERM BOT
Here are the optimal parameters to configure your GRID BOT on Binance for effective scalping:
🔧 Recommended Settings:
o Trading Pair: BTC/USDTP (futures GRID)
o Mode: Grid Trading (long)
o Price Range: 105000 – 112000 USDT
o Current leverage : x18
o Number of Grids: 22-25 levels
o Order Size: Depends on your capital)
o Profit Mode: Arithmetic
o Margin mode : isolated
o Trailing up : Disabled
o Take-Profit: 112000
o Stop-Loss: 104000
o Open a position on creation : Disabled
o Close all position on stop: Enabled
o Close all positions on TP/SL stops: Enabled
📌 Notes :
⚠️The settings listed aboce have been meticulously calculated using precise algorithmic models. Every parameter serves a purpose — and even the slightest deviation can significantly impact performance, potentially leading to capital loss.
⚠️Do not judge the bot’s performance based on its real-time PNL. The true profit is only realized once the bot reaches its target and closes all active orders.
⚠️These bots are designed with high-level precision, offering a powerful edge when configured and used correctly.
✋ Manual Entries (For Experienced Traders)
If you're a more advanced trader, you can combine the GRID bot with manual entries based on:
o Buy orders listed on the chart
o You can enter a buy position at any price within the defined range on the chart — as long as the price does not break above the upper boundary of that range
o Using leverage is possible, but only under one condition:
-Your stop-loss and liquidation price must always remain below the highest protected low or in the SL area
o Your stop loss should always be bellow the highest protected Low
🔍 Disclaimer: This is our personal analysis and not financial advice. Always do your own research before making any investment decisions.
💬 What’s your take on this? Drop your thoughts in the comments and feel free to share this with your friends! ❤️
