LTC ANALYSIS (support & resistance)🔮 #LTC Analysis 🚀🚀
💲💲 #LTC is trading between support and resistance area. There is a potential rejection again from its resistance zone and pullback from its major support area. If #LTC sustains above major support area then we will a bullish move till its major resistance area
💸Current Price -- $82.20
⁉️ What to do?
- We have marked crucial levels in the chart . We can trade according to the chart and make some profits. 🚀💸
#LTC #Cryptocurrency #DYOR
Futurestrading

COTI ANALYSIS 📊 #COTI Analysis
✅There is a formation of Descending Channel Pattern in weekly time frame in #COTI.
Also there is a perfect breakout and retest. Now we can expect a bullish move from major support zone. If not the we will see more bearish move and then a reversal in #COTI.
👀Current Price: $0.06390
🎯 Target Price : $0.08660
⚡️What to do ?
👀Keep an eye on #COTI price action and volume. We can trade according to the chart and make some profits⚡️⚡️
#COTI #Cryptocurrency #Breakout #TechnicalAnalysis #DYOR

IP ANALYSIS🔮 #IP Analysis 💰💰
🌟🚀 As we can see that #IP is trading in a symmetrical triangle and there was a breakdown of the pattern. Last time there was a bullish move from the same support level. We can expect again a bullish momentum from its major support level🚀🚀
🔖 Current Price: $4.190
⏳ Target Price: $5.500
#IP #Cryptocurrency #DYOR

BUY NASDAQBeen a while since I last posted about the American market, you can buy and target the same level as mine.
Follow for more!

BTC ANALYSIS 🔮 #BTC Analysis 🚀🚀
💲💲 #BTC is trading between support and resistance area. There is a potential rejection again from its resistance zone and pullback from its major support area. If #BTC breaks resistance zone $88500 then there will a chance of bullish movement
💸Current Price -- $84470
⁉️ What to do?
- We have marked crucial levels in the chart . We can trade according to the chart and make some profits. 🚀💸
#BTC #Cryptocurrency #DYOR

ATOM ANALYSIS📊 #ATOM Analysis
✅There is a formation of Falling Wedge Pattern on daily chart with a good breakout and currently retests from the major resistance zone and again trading around its major resistance zone 🧐
Pattern signals potential bullish movement incoming after a successful breakout of resistance zone
👀Current Price: $4.800
🚀 Target Price: $6.300
⚡️What to do ?
👀Keep an eye on #ATOM price action and volume. We can trade according to the chart and make some profits⚡️⚡️
#ATOM #Cryptocurrency #TechnicalAnalysis #DYOR

CFX ANALYSIS📊 #CFX Analysis
✅There is a formation of Falling Wedge Pattern on daily chart with a good breakout and currently retests from the major resistance zone🧐
Pattern signals potential bullish movement incoming after a successful retest
👀Current Price: $0.0775
🚀 Target Price: $0.1210
⚡️What to do ?
👀Keep an eye on #CFX price action and volume. We can trade according to the chart and make some profits⚡️⚡️
#CFX #Cryptocurrency #TechnicalAnalysis #DYOR

RENDER ANALYSIS📊 #RENDER Analysis
✅There is a formation of Falling Wedge Pattern on daily chart with a good breakout and currently retests from the major resistance zone🧐
Pattern signals potential bullish movement incoming after a breakout of major resistance zone
👀Current Price: $3.455
🚀 Target Price: $4.4-6.0
⚡️What to do ?
👀Keep an eye on #RENDER price action and volume. We can trade according to the chart and make some profits⚡️⚡️
#RENDER #Cryptocurrency #TechnicalAnalysis #DYOR

EOS ANALYSIS📊 #EOS Analysis
✅There is a formation of Falling Wedge Pattern on daily chart with a good breakout and currently retesting the major resistance zone🧐
Pattern signals potential bullish movement incoming after a breakout of major resistance zone
👀Current Price: $0.6235
🚀 Target Price: $0.9200
⚡️What to do ?
👀Keep an eye on #EOS price action and volume. We can trade according to the chart and make some profits⚡️⚡️
#EOS #Cryptocurrency #TechnicalAnalysis #DYOR

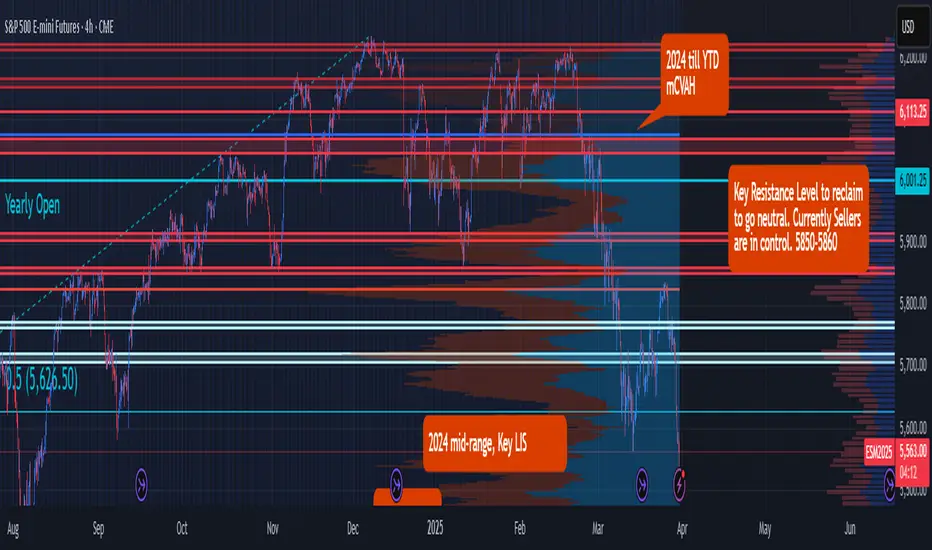
Liberation, Altercation or Doom? ES Futures weekly planCME_MINI:ES1!
Quick Update
The upcoming week is poised to be critical for financial markets as President Donald Trump's so-called "Liberation Day" on April 2 approaches. On this date, the administration plans to implement new tariffs aimed at reducing the U.S. trade deficit by imposing reciprocal duties on imports from various countries.
As April 2 looms, the full impact of these tariffs remains uncertain, leaving markets and investors in a state of heightened anticipation.
We may get clarity on the tariff situation on April 2, 2025.
Universal tariff announcement of categories of imports may clarify US administration’s maximum tariff escalation approach.
A phased out and unclear tariff approach may keep markets in limbo.
Economic Calendar
Keep an eye on the data docket, NFP and other key releases are due this week.
Tuesday, Apri 1, 2025 : ISM Manufacturing PMI, JOLTS Job Openings
Wednesday April 2, 2025 : ADP Employment Change, Factory Orders MoM
Thursday April 3, 2025 : Balance of Trade, Imports, Exports, ISM Services PMI, Initial Jobless Claims
Friday, April 4, 2025 : Non-Farm Payrolls, Unemployment rate, Average Hourly Earnings MoM,Average Hourly Earnings YoY, Fed Chair Powell Speech
Key Levels to Watch:
Yearly Open 2025 : 6001.25
Key Resistance : 5850- 5860
LVN : 5770 -5760
Neutral Zone : 5705-5720
Key LIS Mid Range 2024 : 5626.50
2024-YTD mCVAL : 5381
2022 CVAH : 5349.75
August 5th, 2024 Low : 5306.75
Scenario 1: Bold but Strategic Tariffs (Effective Use of Tariff to reduce trade deficit and raise revenue) : In this scenario, we may see relief rally in ES futures, price reclaiming 2024 mid-range with a move higher towards key resistance level.
Scenario 2: Maximum pressure, maximum tariff (All out trade war) : In this scenario, we anticipate a sell-off with major support levels, such as 2024- YTD mCVAL, 2022 CVAH and August 5th, 2024 low as immediate downside targets.
Scenario 3: Further delays in Tariff policy (A negotiating tool, with looming uncertainty) : In this scenario, sellers remain in control and uncertainty persists, while we anticipate that rallies may be sold, market price action may remain choppy and range bound.
ZEC ANALYSIS📊 #ZEC Analysis
✅There is a formation of Falling Wedge Pattern on daily chart with a good breakout and currently retesting the major resistance zone🧐
Pattern signals potential bullish movement incoming after a breakout of major resistance zone
👀Current Price: $37.80
🚀 Target Price: $50.00
⚡️What to do ?
👀Keep an eye on #ZEC price action and volume. We can trade according to the chart and make some profits⚡️⚡️
#ZEC #Cryptocurrency #TechnicalAnalysis #DYOR

FET ANALYSIS🔆 #FET Analysis : Breakdown
📊As we can see that #FET is following ascending channel on 4hr time frame. There is a breakdown in #FET and if it sustain this breakdown then we would see a dump first then a pump.
⁉️ What to do?
- Keep your eyes on the chart, observe trading volume and stay accustom to market moves.🚀💸
#FET #Cryptocurrency #ChartPattern #DYOR

SUI ANALYSIS🚀#SUI Analysis :
🔮As we can see in the chart of #SUI that there is a formation of "Falling Wedge Pattern". In a daily timeframe #SUI broke out the pattern. Expecting a bullish move in few days if #SUI retest the levels
⚡️What to do ?
👀Keep an eye on #SUI price action. We can trade according to the chart and make some profits⚡️⚡️
#SUI #Cryptocurrency #TechnicalAnalysis #DYOR

WTI Crude Oil Trade Plan: DOE Release NYMEX:CL1!
In this tradingview blog, we go over our technical setup and trade idea for Crude oil.
It is important to note we also have DOE inventory numbers coming at 10:30 ET.
Once the release has settled in, the trade idea can be framed using either of our two scenarios.
Scenario 1: Liquidity Trap
Rejection above March Monthly Open or Yearly Open and prices mean revert towards March mcVAH and CVPOC confluence. The idea considers the trend from last Wednesday. Late breakout buyers get trapped. Higher time frame participants push prices lower.
An example swing trade idea would be taking a long position once the release has settled and waiting for a pull back around 69.50.
• Entry: 69.50
• Stop: 70.30
• Target: 68.15
• Risk: 80 ticks
• Reward: 135 ticks
• Risk/Reward ratio: 1.69
This is an example swing trade idea that may play out by the end of the week.
Scenario 2: Shift back into 70 - 75 range distribution.
Immediate resistance is at March monthly open and yearly open. Above it the path clears towards Q1 mid-range and 2025 mCVPOC.
An example of a trade idea for this scenario is to wait for a breakout and close of candle on the 30 minutes time frame above yearly open. Wait for a pullback towards 70.28
• Entry: 70.35
• Stop: 69.50
• Target 71.45
• Risk: 85 ticks
• Reward: 110 ticks
• Risk/Reward ratio: 1.29
Please note that these are example trade ideas. Trades are advised to do their own preparation. Stops are not guaranteed to trigger, and losses may be greater than predetermined stops.

COCOA; Heikin Ashi Trade ideaPEPPERSTONE:COCOA
In this video, I’ll be sharing my analysis of COCOA, using my unique Heikin Ashi strategy. I’ll walk you through the reasoning behind my trade setup and highlight key areas where I’m anticipating potential opportunities. My goal is to help you enhance your trading skills and insights.
I’m always happy to receive any feedback.
Like, share and comment!

MNQ!/NQ1! Day Trade Plan for 03/24/2025MNQ!/NQ1! Day Trade Plan for 03/24/2025
*LAST UPDATE FOR THIS WEEK*
📈20370 20420
📉20140 20090
Like and share for more daily NQ levels 🤓📈📉🎯💰
*These levels are derived from comprehensive backtesting and research and a quantitative system demonstrating high accuracy. This statistical foundation suggests that price movements are likely to exceed initial estimates.*

Behind the Curtain The Economic Pulse Behind Euro FX1. Introduction
Euro FX Futures (6E), traded on the CME, offer traders exposure to the euro-dollar exchange rate with precision, liquidity, and leverage. Whether hedging European currency risk or speculating on macro shifts, Euro FX contracts remain a vital component of global currency markets.
But what truly moves the euro? Beyond central bank meetings and headlines, the euro reacts sharply to macroeconomic data that signals growth, inflation, or risk appetite. Using a Random Forest Regressor, we explored how economic indicators correlate with Euro FX Futures returns across different timeframes.
In this article, we uncover which metrics drive the euro daily, weekly, and monthly, offering traders a structured, data-backed approach to navigating the Euro FX landscape.
2. Understanding Euro FX Futures Contracts
The CME offers two primary Euro FX Futures products:
o Standard Euro FX Futures (6E):
Contract Size: 125,000 €
Tick Size: 0.000050 per euro = $6.25 per tick per contract
Trading Hours: Nearly 24 hours, Sunday to Friday (US)
o Micro Euro FX Futures (M6E):
Contract Size: 12,500 € (1/10th the size of 6E)
Tick Size: 0.0001 per euro = $1.25 per tick per contract
Accessible to: Smaller accounts, strategy testers, and traders managing precise exposure
o Margins:
6E Initial Margin: ≈ $2,600 per contract (subject to volatility)
M6E Initial Margin: ≈ $260 per contract
Whether trading full-size or micro contracts, Euro FX Futures offer capital-efficient access to one of the most liquid currency pairs globally. Traders benefit from leverage, scalability, and transparent pricing, with the ability to hedge or speculate on Euro FX trends across timeframes.
3. Daily Timeframe: Key Economic Indicators
For day traders, short-term price action in the euro often hinges on rapidly released data that affects market sentiment and intraday flow. According to machine learning results, the top 3 daily drivers are:
Housing Starts: Surging housing starts in the U.S. can signal economic strength and pressure the euro via stronger USD flows. Conversely, weaker construction activity may weaken the dollar and support the euro.
Consumer Sentiment Index: A sentiment-driven metric that reflects household confidence. Optimistic consumers suggest robust consumption and a firm dollar, while pessimism may favor EUR strength on defensive rotation.
Housing Price Index (HPI): Rising home prices can stoke inflation fears and central bank hawkishness, affecting yield differentials between the euro and the dollar. HPI moves often spark short-term FX volatility.
4. Weekly Timeframe: Key Economic Indicators
Swing traders looking for trends spanning several sessions often lean on energy prices and labor data. Weekly insights from our Random Forest model show these three indicators as top drivers:
WTI Crude Oil Prices: Oil prices affect global inflation and trade dynamics. Rising WTI can fuel EUR strength if it leads to USD weakness via inflation concerns or reduced real yields.
Continuing Jobless Claims: An uptick in claims may suggest softening labor conditions in the U.S., potentially bullish for EUR as it implies slower Fed tightening or economic strain.
Brent Crude Oil Prices: As the global benchmark, Brent’s influence on inflation and trade flows is significant. Sustained Brent rallies could create euro tailwinds through weakening dollar momentum.
5. Monthly Timeframe: Key Economic Indicators
Position traders and institutional participants often focus on macroeconomic indicators with structural weight—those that influence monetary policy direction, capital flow, and long-term sentiment. The following three monthly indicators emerged as dominant forces shaping Euro FX Futures:
Industrial Production: A cornerstone of economic output, rising industrial production reflects strong manufacturing activity. Strong U.S. numbers can support the dollar, while a slowdown may benefit the euro. Likewise, weaker European output could undermine EUR demand.
Velocity of Money (M2): This metric reveals how quickly money is circulating in the economy. A rising M2 velocity suggests increased spending and inflationary pressures—potentially positive for the dollar and negative for the euro. Falling velocity signals stagnation and may shift flows into the euro as a lower-yield alternative.
Initial Jobless Claims: While often viewed weekly, the monthly average could reveal structural labor market resilience. A rising trend may weaken the dollar, reinforcing EUR gains as expectations for interest rate cuts grow.
6. Strategy Alignment by Trading Style
Each indicator offers unique insights depending on your approach to market participation:
Day Traders: Focus on the immediacy of daily indicators like Housing Starts, Consumer Sentiment, and Housing Price Index.
Swing Traders: Leverage weekly indicators like Crude Oil Prices and Continuing Claims to ride mid-term moves.
Position Traders: Watch longer-term data such as Industrial Production and M2 Velocity.
7. Risk Management
Currency futures provide access to high leverage and broad macro exposure. With that comes responsibility. Traders must actively manage position sizing, volatility exposure, and stop placement.
Economic indicators inform price movement probabilities—not certainties—making risk protocols just as essential as trade entries.
8. Conclusion
Euro FX Futures are shaped by a deep web of macroeconomic forces. From Consumer Sentiment and Oil Prices to Industrial Production and Money Velocity, each indicator tells part of the story behind Euro FX movement.
Thanks to machine learning, we’ve spotlighted the most impactful data across timeframes, offering traders a framework to align their approach with the heartbeat of the market.
As we continue the "Behind the Curtain" series, stay tuned for future editions uncovering the hidden economic forces behind other major futures markets.
When charting futures, the data provided could be delayed. Traders working with the ticker symbols discussed in this idea may prefer to use CME Group real-time data plan on TradingView: www.tradingview.com - This consideration is particularly important for shorter-term traders, whereas it may be less critical for those focused on longer-term trading strategies.
General Disclaimer:
The trade ideas presented herein are solely for illustrative purposes forming a part of a case study intended to demonstrate key principles in risk management within the context of the specific market scenarios discussed. These ideas are not to be interpreted as investment recommendations or financial advice. They do not endorse or promote any specific trading strategies, financial products, or services. The information provided is based on data believed to be reliable; however, its accuracy or completeness cannot be guaranteed. Trading in financial markets involves risks, including the potential loss of principal. Each individual should conduct their own research and consult with professional financial advisors before making any investment decisions. The author or publisher of this content bears no responsibility for any actions taken based on the information provided or for any resultant financial or other losses.

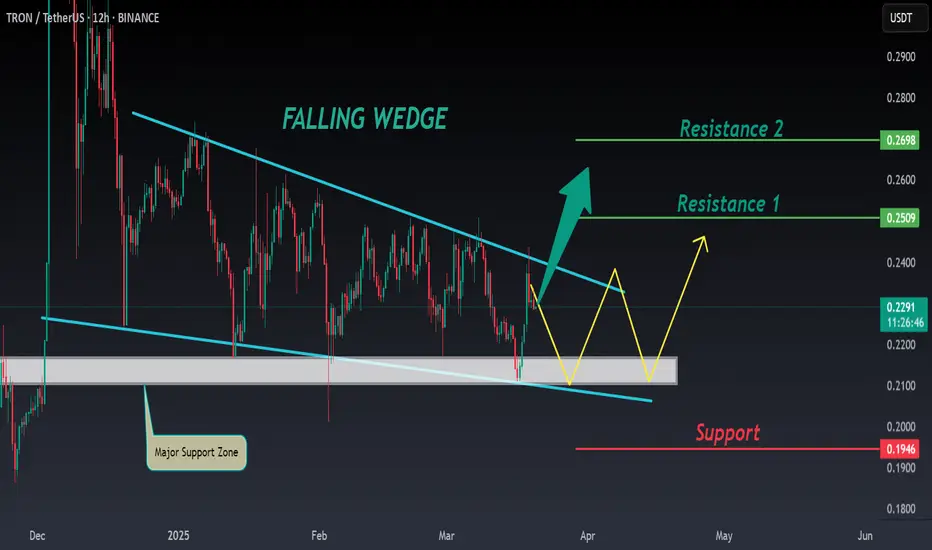
TRX ANALYSIS📊 #TRX Analysis
✅There is a formation of Falling Wedge Pattern on 12 hr chart and currently trading around its major support zone🧐
Pattern signals potential bullish movement incoming after a breakout
👀Current Price: $0.2290
🚀 Target Price: $0.2500
⚡️What to do ?
👀Keep an eye on #TRX price action and volume. We can trade according to the chart and make some profits⚡️⚡️
#TRX #Cryptocurrency #TechnicalAnalysis #DYOR
MES!/ES1! Day Trade Plan for 03/18/2025MES!/ES1! Day Trade Plan for 03/18/2025
📈5740. 5760
📉5680. 5660
Like and share for more daily ES levels 🤓📈📉🎯💰
*These levels are derived from comprehensive backtesting and research and a quantitative system demonstrating high accuracy. This statistical foundation suggests that price movements are likely to exceed initial estimates.*

MNQ!/NQ1! Day Trade Plan for 03/18/2025MNQ!/NQ1! Day Trade Plan for 03/18/2025
📈20040 20085
📉19670 19620
Like and share for more daily NQ levels 🤓📈📉🎯💰
*These levels are derived from comprehensive backtesting and research and a quantitative system demonstrating high accuracy. This statistical foundation suggests that price movements are likely to exceed initial estimates.*

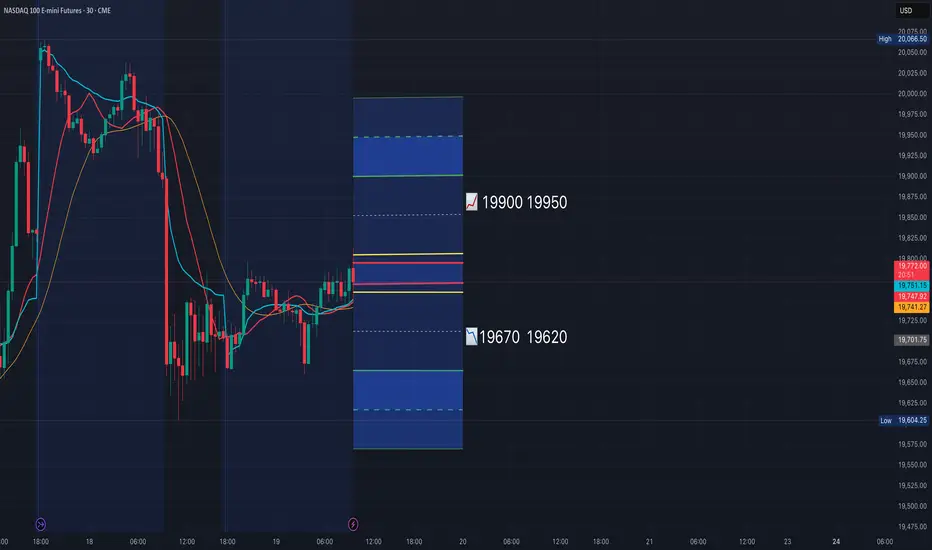
MNQ!/NQ1! Day Trade Plan for 03/19/2025MNQ!/NQ1! Day Trade Plan for 03/19/2025
📈19900 19950
📉19670 19620
Like and share for more daily NQ levels 🤓📈📉🎯💰
*These levels are derived from comprehensive backtesting and research and a quantitative system demonstrating high accuracy. This statistical foundation suggests that price movements are likely to exceed initial estimates.*
MES!/ES1! Day Trade Plan for 03/17/2025MES!/ES1! Day Trade Plan for 03/17/2025
📈5660. 5680
📉5600. 5580
Like and share for more daily ES levels 🤓📈📉🎯💰
*These levels are derived from comprehensive backtesting and research and a quantitative system demonstrating high accuracy. This statistical foundation suggests that price movements are likely to exceed initial estimates.*

MNQ!/NQ1! Day Trade Plan for 03/17/2025MNQ!/NQ1! Day Trade Plan for 03/17/2025
📈19850 19940
📉19670 19570
Like and share for more daily NQ levels 🤓📈📉🎯💰
*These levels are derived from comprehensive backtesting and research and a quantitative system demonstrating high accuracy. This statistical foundation suggests that price movements are likely to exceed initial estimates.*
