MES!/ES1! Day Trade Plan for 02/19/25MES!/ES1! Day Trade Plan for 02/19/25
📈6150-6155
📉6120-6115
Like and share for more daily ES/NQ levels 🤓📈📉🎯💰
*These levels are derived from comprehensive backtesting and research and a quantitative system demonstrating high accuracy. This statistical foundation suggests that price movements are likely to exceed initial estimates.*
Futurestrading

MNQ!/NQ1! Day Trade Plan for 02/19/25MNQ!/NQ1! Day Trade Plan for 02/19/25
📈22225, 22320
📉22130, 22106
Like and share for more daily ES/NQ levels 🤓📈📉🎯💰
*These levels are derived from comprehensive backtesting and research and a quantitative system demonstrating high accuracy. This statistical foundation suggests that price movements are likely to exceed initial estimates.*

WAIT FOR BREAKOUT...MCX:COPPER1! trade in a triangle range since 7 month, you wait watch for an upside move after breakout.

GOLD Ready for ALL TIME HIGH BREAKOUT...MCX:GOLD1! trade at 79000 level. You can watch for more upside move after 80000 level breakout.

Wait for Breakout in Silver...MCX:SILVER1! trade at 91600 level. Silver trade in a triangle range last 6 month. You can watch for either up or down side move after breakout...

OUR TRADE ON NASDAQThis is our trade for today on nasdaq in which we sold and recovered the loss we made on gold and made more profits on it.
I didn't share it to public since I gave it to my students, now after the TP reached here you are watching it!
Follow us for more!

BUY XAUUSD As you notice on the chart, we have the price that gave us a reversal point in which we will enter.
Set your levels as I set mine!
Follow for more!

TRADE CLOSED ON USOILI posted earlier to enter and target our DLQ, but since the market is slow and it it caught the MNQ at 71.707, we closed emmidiately.
Morning's loss recovered plus couple bucls of profit.
Follow for more!

MNQ!/NQ1! Day Trade Plan for 02/18/25MNQ!/NQ1! Day Trade Plan for 02/18/25
📈22410, 22500
📉22225-22210, 22130
Like and share for more daily ES/NQ levels 🤓📈📉🎯💰
*These levels are derived from comprehensive backtesting and research and a quantitative system demonstrating high accuracy. This statistical foundation suggests that price movements are likely to exceed initial estimates.*

MES!/ES1! Day Trade Plan for 02/18/25MES!/ES1! Day Trade Plan for 02/18/25
📈6170
📉6135
Like and share for more daily ES/NQ levels 🤓📈📉🎯💰
*These levels are derived from comprehensive backtesting and research and a quantitative system demonstrating high accuracy. This statistical foundation suggests that price movements are likely to exceed initial estimates.*

BUY USOILYou can buy USOIL and target the Daily Liquidity after that the price gave us a confirmation of a reversal.
Follow for more!

I Turned Crazy Strategy Into a Python Program & It’s RunningAfter years of refining my AI Harmonic Fibonacci strategy, I’ve fully automated it into a Python-based trading system, and it’s now LIVE on Binance Copy Trading. The results? 773 trades in just 7 days with an insane 98% win rate!
📊 Why Is This Strategy So Powerful?
✅ AI-driven precision – No emotions, just math.
✅ High-frequency trading – More trades, more wins.
✅ Zero risk approach – Built-in smart risk management.
✅ Fully automated – Profits while you sleep.
🔥 And the best part? You can access it right now.
🔍 Search "아몰랑" on Binance Futures Copy and see it in action!
sorry I accidentally made with a Korean nickname,
#Binance #CopyTrading #PythonTrading #AITrading #TradingBot #CryptoTrading #HarmonicPatterns #HighWinRate
www.binance.com

SELL XAUUSDOur first trade for the day is on XAUUSD that you can take as a seller following the same levels as mine.
Follow for more!

MNQ!/NQ1! Day Trade Plan for 02/17/25MNQ!/NQ1! Day Trade Plan for 02/17/25
📈22320-22350
📉22190-22130
Like and share for more daily MNQ/NQ levels 🤓📈📉🎯💰
*These levels are derived from comprehensive backtesting and research, demonstrating over 90% accuracy. This statistical foundation suggests that price movements are likely to exceed initial estimates.*

MNQ!/NQ1! Day Trade Plan for 02/14/25MNQ!/NQ1! Day Trade Plan for 02/14/25
📈22320-22350
📉21975-21940
Like and share for more daily MNQ/NQ levels 🤓📈📉🎯💰
*These levels are derived from comprehensive backtesting and research, demonstrating over 90% accuracy. This statistical foundation suggests that price movements are likely to exceed initial estimates.*

SELL USOILAs you can notice on the chart, the price reached the liquidity zone, pilled back on it to give us a confirmation of the reversal.
You can sell and set your TP and SL as I set mine on the chart.
Follow for more!

My thoughts for GCIm looking for areas of consolidation on a higher time frame preferably the one hour then on the 5min wait for a bullish engulfing to print to enter for buys, now Monday is a holiday so I know NYSE will be closed so for the entries already taken, during Asian opening will only be technical trades, but there is high impact news, and depending on descolations with
Russia, I plan for contiunation buys, but I plan to watch the dollar and the yields for any potential reversals to the. downside

Leap Ahead with a Dual Breakout Setup on ES and MESThe Leap Trading Competition: A Chance to Trade S&P 500 Futures
TradingView’s "The Leap" Trading Competition gives traders the opportunity to test their futures trading strategies in a competitive environment. Participants have access to select CME Group futures contracts, including E-mini S&P 500 Futures (ES) and Micro E-mini S&P 500 Futures (MES).
This article presents a dual breakout trade setup, analyzing both bullish and bearish scenarios based on key Fibonacci levels and low volatility price ranges. The goal is to trade the breakout of a well-defined range and target either a Fibonacci extension to the upside or a retracement level to the downside.
Understanding Breakouts and Fibonacci Levels
A breakout occurs when price moves beyond a defined support or resistance level, often leading to a strong trend continuation. In this case, the trading range between 6146.75 and 6121.25 is the key level to watch. A breakout above this range suggests bullish momentum, while a breakout below signals bearish pressure.
Fibonacci retracement levels are used to identify potential support or resistance zones based on past price movements. The 50% retracement level at 5985.75 aligns with a UFO support, making it a key downside target if price breaks lower.
Fibonacci extension levels project potential price targets beyond the most recent high or low. The 100% Fibonacci extension at 6288.75 serves as the projected upside target if price breaks higher.
The Dual Breakout Trade Setup
In a bullish scenario, a breakout above 6146.75 confirms entry to the upside. The target for this trade is the 100% Fibonacci extension at 6288.75. A stop loss is placed below the breakout level at a distance that ensures a minimum 3:1 reward-to-risk ratio.
In a bearish scenario, a breakdown below 6121.25 confirms entry to the downside. The target is the 50% Fibonacci retracement at 5985.75, which aligns with a UFO support zone. A stop loss is placed above the breakdown level, ensuring a minimum 3:1 reward-to-risk ratio.
Risk management considerations include adjusting stop losses based on a trader’s preferred risk-reward ratio. Scaling out at intermediate levels can help manage volatility and secure partial profits.
Contract Specifications and Margin Requirements
E-mini S&P 500 Futures (ES) details:
Full contract specs: ES Contract Specifications – CME Group
Contract size: $50 x S&P 500 Index
Tick size: 0.25 index points ($12.50 per tick)
Margin requirements depend on broker conditions and market volatility – Currently ≈$15,000 per contract.
Micro E-mini S&P 500 Futures (MES) details:
Full contract specs: MES Contract Specifications – CME Group
Contract size: $5 x S&P 500 Index (1/10th of ES)
Tick size: 0.25 index points ($1.25 per tick)
Lower margin requirements make it more accessible for smaller accounts – Currently ≈$1,500 per contract.
Leverage in ES and MES magnifies both potential gains and losses. Traders should consider margin requirements and market conditions when determining position sizes.
Execution and Market Conditions
Before executing a trade, a typical breakout trader would watch price confirm a breakout by sustaining above or below the key levels. Additional confirmation from volume trends and momentum indicators can improve trade accuracy.
If price does not break out, the setup remains invalid. If a false breakout occurs, traders may need to reassess conditions before re-entering.
Conclusion
A dual breakout setup provides both bullish and bearish opportunities depending on price movement. Fibonacci extensions provide upside targets, while retracement levels align with strong support zones for downside moves.
For participants in The Leap Trading Competition, this setup highlights the importance of disciplined execution, confirmation, and structured risk management.
When charting futures, the data provided could be delayed. Traders working with the ticker symbols discussed in this idea may prefer to use CME Group real-time data plan on TradingView: www.tradingview.com - This consideration is particularly important for shorter-term traders, whereas it may be less critical for those focused on longer-term trading strategies.
General Disclaimer:
The trade ideas presented herein are solely for illustrative purposes forming a part of a case study intended to demonstrate key principles in risk management within the context of the specific market scenarios discussed. These ideas are not to be interpreted as investment recommendations or financial advice. They do not endorse or promote any specific trading strategies, financial products, or services. The information provided is based on data believed to be reliable; however, its accuracy or completeness cannot be guaranteed. Trading in financial markets involves risks, including the potential loss of principal. Each individual should conduct their own research and consult with professional financial advisors before making any investment decisions. The author or publisher of this content bears no responsibility for any actions taken based on the information provided or for any resultant financial or other losses.

DXY Weekly Chart: "The Bull-trap Breakout"The US Dollar Index is currently positioned at the top of its trading range, which has been in play since 2023 on the weekly timeframe. This presents a solid bearish setup, as the index is likely to reverse and trade back into the range.
This trade idea has been in play since September of 2024 when we were still trading at the BOTTOM of the rang e

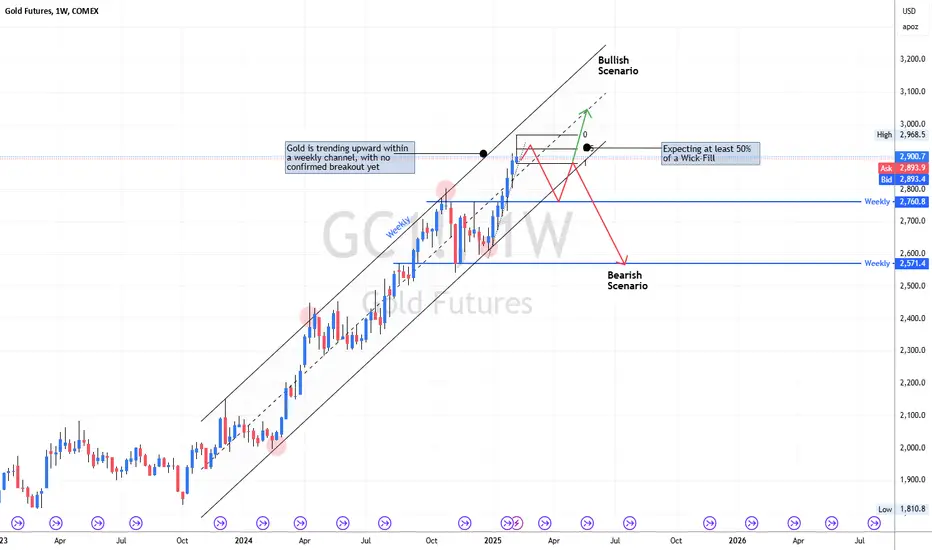
Gold Weekly Analysis – Bullish & Bearish ScenariosCurrent Market Structure:
Gold is trending upward within a well-defined weekly ascending channel and has not broken out yet.
The market is currently near the upper boundary of the channel, meaning a breakout or a potential rejection could occur.
Expected Movement This Week:
Bullish Scenario (Higher Probability If Momentum Holds):
A clean breakout above the channel resistance would signal continued bullish momentum.
The price could consolidate briefly at the breakout level before pushing higher toward $3,000+.
If a pullback happens after breaking out, we expect a retest of previous resistance (now support) before continuing upward.
Confirmation: Strong bullish candles with increasing volume.
Bearish Scenario (If Gold Fails to Break Above Resistance):
If gold fails to break out and rejects from the upper boundary, a correction is likely.
The first key downside target is around $2,760 (weekly level), aligning with previous structure.
A deeper decline could lead to $2,571, which is another weekly support zone.
Confirmation: A strong rejection wick, bearish engulfing pattern, or increased selling pressure.
⚠️ Risk Disclaimer:
Trading involves significant risk and can result in substantial losses. Past performance is not indicative of future results. This analysis is for informational purposes only and should not be considered financial advice. Always conduct your own research and consult with a professional before making any trading decisions.
MES!/ES1! Day Trade Plan for 02/13/25MES!/ES1! Day Trade Plan for 02/13/25
📈6100-6120
📉6060-6040
Like and share for more daily ES/NQ levels 🤓📈📉🎯💰
(💎: IF THERE IS NOT MUCH VOLATILITY; FOCUS ON ZONES VERSES INDIVIDUAL PRICE LEVELS)
*These levels are derived from comprehensive backtesting and research, demonstrating over 90% accuracy. This statistical foundation suggests that price movements are likely to exceed initial estimates.*

MNQ!/NQ1! Day Trade Plan for 02/13/25MNQ!/NQ1! Day Trade Plan for 02/13/25
📈22080-22130
📉21645-21565
Like and share for more daily ES/NQ levels 🤓📈📉🎯💰
(💎: IF THERE IS NOT MUCH VOLATILITY; FOCUS ON ZONES VERSES INDIVIDUAL PRICE LEVELS)
*These levels are derived from comprehensive backtesting and research, demonstrating over 90% accuracy. This statistical foundation suggests that price movements are likely to exceed initial estimates.*

MNQ!/NQ1! Day Trade Plan for 02/12/25MNQ!/NQ1! Day Trade Plan for 02/12/25
📈21870-21889
📉21450-21435
Like and share for more daily ES/NQ levels 🤓📈📉🎯💰
(💎: IF THERE IS NOT MUCH VOLATILITY; FOCUS ON ZONES VERSES INDIVIDUAL PRICE LEVELS)
*These levels are derived from comprehensive backtesting and research, demonstrating over 90% accuracy. This statistical foundation suggests that price movements are likely to exceed initial estimates.*
