EURUSD - Bullish fair value gap and fibonacci support!At the end of July, EUR/USD experienced a sharp and decisive move to the downside, signaling a strong bearish momentum in the market. Following this decline, the pair began to recover, steadily climbing and partially filling the 4-hour Fair Value Gap (FVG). After tapping into the 4-hour FVG, price action has entered a corrective phase, moving lower towards a confluence of bullish levels. This area is defined by both the 1-hour and 4-hour FVGs, which align perfectly with the golden pocket of the Fibonacci retracement tool, a high-probability zone often watched by traders for potential reversals.
Bullish Support
The key bullish support zone sits around the 1.158 to 1.160 range. This area holds significant importance because it combines two strong technical factors: the 1-hour and 4-hour FVGs, as well as the golden pocket Fibonacci retracement. The overlap of these technical elements often acts as a magnet for price and can create a strong foundation for a bullish reaction. If the market respects this zone, we could see EUR/USD push higher in the short term, as traders capitalize on the support to drive price towards higher resistance areas.
Bearish Resistance
On the upside, the main bearish resistance zone lies between 1.170 and 1.174. This area represents the final portion of the unfilled bearish 4-hour FVG and could act as a significant barrier for further bullish progress. If price returns to this level, the strong supply pressure could result in a sweep of recent highs, fully filling the 4-hour FVG before potentially resuming the downward trend. This scenario aligns with the idea that sellers may re-enter the market aggressively once this resistance zone is tested.
Final Thoughts
Given the current market structure, my expectation is that the bullish support zone around 1.158 to 1.160 will hold, providing a potential launchpad for price to revisit and possibly complete the filling of the bearish 4-hour FVG near 1.174. However, if the market breaks decisively below the 1-hour FVG, it could indicate a shift in sentiment, opening the door for a bearish continuation and deeper downside targets. The coming sessions will be critical in determining whether EUR/USD can maintain bullish momentum or if sellers will regain control.
-------------------------
Disclosure: I am part of Trade Nation's Influencer program and receive a monthly fee for using their TradingView charts in my analysis.
Thanks for your support. If you enjoyed this analysis, make sure to follow me so you don't miss the next one. And if you found it helpful, feel free to drop a like 👍 and leave a comment 💬, I’d love to hear your thoughts!
Fvg

"Gold’s Next Big Move? The Hidden Entry Zone Smart Money "Gold’s Next Big Move? The Hidden Entry Zone Smart Money is Watching!"
Gold (XAUUSD) is currently consolidating after a series of higher lows, signaling sustained bullish momentum from the strong support region around $3,280–$3,300. Price has respected key structural points, forming a clean market structure with:
BOS (Break of Structure) confirming bullish intent after reclaiming prior resistance.
Bullish FVG (Fair Value Gap) acting as a liquidity zone for potential re-entries.
Multiple Higher Lows, highlighting strong buyer defense levels.
The chart indicates a possible short-term retracement into the $3,350–$3,357 entry zone, which aligns with demand structure. From this zone, buyers are expected to push toward the $3,400–$3,415 resistance target.
Key technical levels:
Entry Zone: $3,350–$3,357 (demand area)
Stop Loss: Below $3,340 to protect against deeper pullbacks
Take Profit: $3,400 psychological level and $3,414 structural resistance
Market Sentiment:
The combination of a strong support base, sustained higher lows, and bullish imbalance zones suggests a favorable risk–reward setup for long positions. A clean breakout above $3,415 could trigger a larger bullish leg toward the $3,440 resistance zone.
📈 Bias: Bullish above $3,350
💡 Watch for a reaction at the entry zone before committing to positions.

Daily XAUUSD OutlookGood day traders 🌟
Gold opens today’s session still holding strong near the upper boundaries of its daily range, trading just beneath the dominant weekly supply zone. Buyers have kept control above the 3290 handle, while sellers continue to defend the ceiling around 3439. With a busy US data week ahead, the daily chart sets the stage for either a decisive breakout or a calculated pullback into fresh demand.
📌 Bias: Bullish — daily structure remains firmly intact above 3290, dynamic EMA flow is aligned for upside, and momentum is in buyers’ favor. Still, given we’re in premium pricing, waiting for confirmation is essential before entering fresh positions.
Macro Context
Markets are poised for volatility with US CPI, PPI, and retail sales lined up. Softer inflation data could give bulls the push to clear the 3439 ceiling, while stronger numbers may invite a retracement toward lower daily demand zones.
📊 Key Daily Zones
Immediate Resistance / Supply: 3395 – 3439 (HTF supply overlap + liquidity resting above).
Mid-Level Demand: 3330 – 3310 (recent bullish OB, intraday reload zone).
Major Daily Demand: 3290 – 3260 (untested breakout base).
📊 Key Zones
Above Current Price
Immediate Resistance / Supply: 3395 – 3439 (major HTF supply).
3460 – 3475 → H4/D1 imbalance + inducement zone.
3480 – 3490 → 1.618 Fibonacci extension from last weekly swing.
3510 – 3525 → minor HTF supply / wick rejection zone.
Below Current Price
Mid-Level Demand: 3330 – 3310 (recent bullish OB).
Major Daily Demand: 3290 – 3260 (untested breakout base).
3220 – 3200 → daily demand + liquidity sweep zone.
3155 – 3140 → daily OB + HTF BOS retest.
3100 – 3085 → HTF demand + liquidity shelf.
3040 – 3020 → deep daily demand + Fibo 0.786 retracement of May rally.
🚀 Bullish Scenario
A break and daily close above 3439 clears the path toward 3460 – 3475, with extension targets at 3480 – 3490 and 3510 – 3525.
Pullbacks into 3330 – 3310 or 3290 – 3260 with bullish confirmation may offer high-RR entries back toward the highs.
📉 Bearish Scenario
Rejection from 3439 could push price back toward 3330 – 3310 or 3290 – 3260.
A daily close below 3260 opens deeper targets at 3220 – 3200, 3155 – 3140, and potentially 3100 – 3085.
🔍 Confluence & Indicators
Dynamic EMA Flow: Bullish, price above all major EMAs.
RSI: Neutral-to-bullish, no divergence on D1.
FVGs: Unfilled gap above 3439 acts as liquidity magnet.
Fibonacci: Price near 1.272 extension, with 1.618 above at 3480–3490.
📌 Outlook Summary
Gold is coiled near the top of its range in a bullish structure. The best setups will come from either a confirmed breakout above 3439 toward higher HTF targets or a disciplined buy from demand after a healthy retracement.
💬 Your move — will gold finally push through the highs, or is a deeper pullback coming first? Share your thoughts below and let’s track the market together.
If you find these outlooks useful, hit like and follow for precision updates.
— GoldFxMinds
Disclosure: This analysis uses Trade Nation’s price feed and is for educational purposes only — not financial advice.

EURUSDMy Bias: cautiously bearish unless reclaimed.
Context: Price broke the daily structure (“day break”), retraced into a fair value gap and reacted.
Plan: I’ll wait for a clean LTF break of structure and displacement from that FVG before taking shorts on a pullback into fresh imbalance. If the FVG is reclaimed and we close back above it, I will reassess the bias. Be patient until next week’s session opens. NFA.

Weekly XAUUSD Outlook,August 11-15, 2025Hello traders ,
We step into a new week with gold holding its ground in the premium zone, standing just beneath the towering high of 3439. The weekly chart tells a story of persistent bullish momentum — each pullback over the past months has been shallow, showing that institutional buyers remain firmly in control.
The macro calendar is packed with potential catalysts. US CPI and PPI will be the main drivers, shaping inflation expectations and influencing the USD. Stronger readings may spark a controlled retracement, while softer data could be the trigger for gold to finally break through the ceiling at 3439. Retail Sales and Consumer Sentiment later in the week could serve as the final push to decide direction.
📊 Weekly Structure & Key Zones
Major HTF Supply: 3350 – 3439 (full wick-to-body range of the last strong sell-side push; the only true weekly supply left).
First HTF Demand: 3290 – 3260 (breakout origin, untested bullish OB).
Deep HTF Demand: 2920 – 2880 (historical liquidity pocket, unlikely without major sentiment change).
📌 Bias: Bullish — structure, EMA flow, and momentum remain in buyers’ favor, but execution requires patience as we are already in premium pricing.
🚀 Bullish Breakout Path
If we see a decisive weekly close above 3439, gold steps into clear skies. The next reference points are:
3460 – 3475 → imbalance + inducement zone on H4/D1.
3480 – 3490 → 1.618 Fibonacci extension of the last weekly swing.
Beyond this, fresh mapping will be required on daily structure.
📉 Bearish Retracement Path
A rejection from 3439, especially if reinforced by strong USD data, could pull price back into 3290 – 3260 for a potential reload. Only a weekly close below 3260 would shift the bias toward the deeper 3100–3050 area.
🔍 Confluence & Indicators
Dynamic EMA Flow: Fully bullish, EMAs stacked in buy order.
RSI: Holding in bullish territory, no weekly divergence.
FVGs: Small unfilled gaps above 3439 act as liquidity targets.
Fibonacci: Price currently reacts near 1.272 extension; 1.618 remains above.
📌 Outlook Summary
The bulls still have the upper hand, but this is a premium zone where patience matters. The best plays will come from either a disciplined pullback into demand or a confirmed breakout toward 3480–3490.
💬 Your turn — what’s your call? Are we about to see new highs, or will gold take a breath first? Share your thoughts below.
If you enjoy these outlooks, don’t forget to like and follow for precision updates.
— GoldFxMinds
Disclosure: This analysis uses Trade Nation’s price feed and is for educational purposes only — not financial advice.

XLM Price holding multi-TF Bull FVGCRYPTOCAP:XLM is trading inside a multi-timeframe Bullish FVG cluster (0.40 – 0.4368) with confluence from 1W, 1D, and 4H charts. Price is holding above POI that previously triggered bullish continuation.
Bullish scenario (#long):
Accumulate within 0.42 – 0.41 zone.
Breakout above 4H Sell FVG (0.44 – 0.46) confirms upside momentum.
Progressive take-profits: 0.5206 → 0.5606 → 0.6081 → final at 0.6374.
Bearish scenario / Invalidation:
Breakdown and close below 0.41 shifts bias to bearish, opening path to deeper retrace toward 0.36 and potentially re-testing lower 1W Bull FVG levels.
Trading plan:
Entry: 50% at 0.42, 50% at 0.41.
Stop Loss: Below 0.41.
Take Profits: As per targets above.
Bias: Bullish while price remains above 0.41.

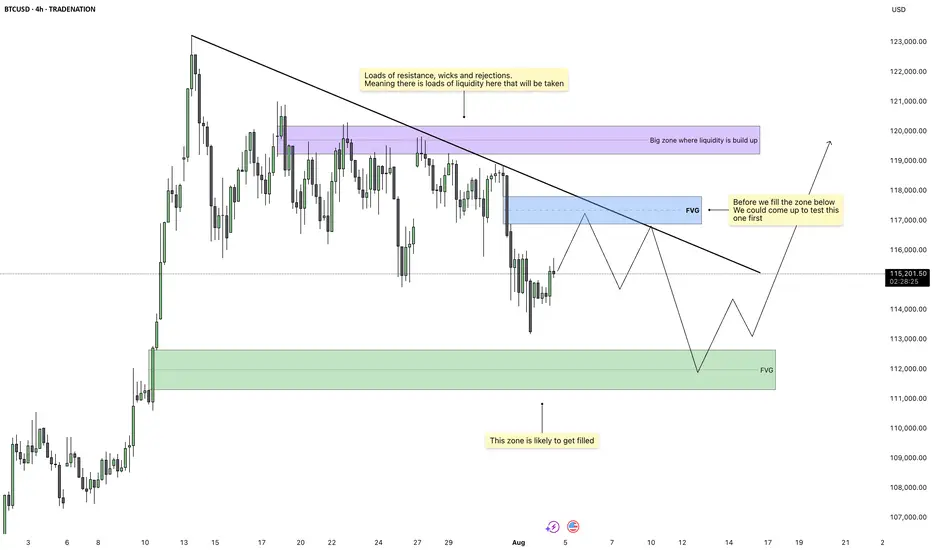
BTCUSD – Bearish Retracement Towards Key Liquidity Zone📊 BTCUSD – Bearish Retracement Towards Key Liquidity Zone
BTCUSD is currently trading near 116,425, showing signs of a potential bearish retracement after testing the previous resistance zone around 117,000–119,000. The chart structure highlights multiple Break of Structure (BOS) points, confirming shifts in market sentiment.
Technical Breakdown
Previous Resistance Rejection
Price failed to hold above the 117,000 mark, indicating strong selling pressure from the prior supply zone.
The rejection aligns with a liquidity grab above the recent highs, suggesting smart money distribution.
Liquidity & Fair Value Gaps
There’s a visible Liquidity/Fair Value Gap from the late July rally, which may now act as a magnet for price.
The market tends to fill these inefficiencies before deciding the next major trend move.
Target & Support Zone
The next key support and liquidity pool rests between 113,500 – 114,000, highlighted as the target zone.
This area has confluence with previous accumulation phases, making it a probable point for a bullish reaction if tested.
Volume Profile Context
Volume nodes indicate heavier trading activity below current levels, suggesting that a drop towards 114,000 could be met with increased buyer interest.
Market Outlook
Primary Bias: Short-term bearish retracement.
Immediate Target: 114,000 liquidity zone.
Invalidation: A daily close above 117,500 may shift sentiment back to bullish, opening the path toward 119,000–121,000.
Trading Insight:
Aggressive traders may look for short setups below 116,500, targeting 114,000. Conservative traders may wait for price to tap into the support/target zone for potential long opportunities with tight risk management.

XAUUSD Bearish SMC Analysis – Institutional RejectionXAUUSD Bearish SMC Analysis – Institutional Rejection from Supply Zone
Gold (XAUUSD) is showing a clear bearish structure after rejecting a major supply zone at premium pricing. This setup is aligned with Smart Money Concepts (SMC) and reflects how institutions manipulate liquidity and order flow before major price moves.
🔍 Market Structure Context:
The market had been trending upward with higher highs and higher lows, until it approached a key premium supply zone near $3,420.
At this level, price stalled, creating internal Equal Highs (liquidity) — a common trap used by institutions to grab orders before reversing.
🔄 Change of Character (CHoCH):
A clear CHoCH was printed when price broke below the most recent higher low, signaling a shift from bullish to bearish structure.
This change marked the first early signal that institutional order flow has flipped bearish, and distribution is underway.
📉 Break of Structure (BOS):
Following the CHoCH, the market confirmed intent with a clean BOS to the downside.
This structural break confirms bearish control and validates short bias.
🧲 Liquidity Engineering:
Equal Highs were swept at the top, indicating a liquidity grab before institutions drove price downward.
This move traps breakout buyers and provides large players with sell-side execution at premium pricing.
🧱 Fair Value Gap (FVG) & Supply Zone Mitigation:
After BOS, price retraced into a Bearish Fair Value Gap (FVG) and the origin of the supply zone, offering a high-probability entry.
The rejection from this zone showed imbalance was respected and no bullish continuation existed — further validating the short setup.
🔍 Confluences for the Bearish Bias:
Confluence Confirmation
CHoCH Structure flipped bearish
BOS Bearish continuation confirmed
Liquidity Sweep Equal highs taken
FVG Retest Smart Money re-entry signal
Supply Zone Mitigation Institutional reaction confirmed
📘 Educational Summary:
This setup exemplifies a complete Smart Money bearish reversal model:
Premium pricing ✅
Liquidity taken ✅
Structure flipped (CHoCH + BOS) ✅
Supply & FVG respected ✅
It reflects how institutions build positions quietly, using engineered liquidity to trap retail traders, and then drive price with high-volume imbalance moves.

"BTCUSD Technical Outlook: Support Holds, Bulls Aim for $117K""BTCUSD Technical Outlook: Support Holds, Bulls Aim for $117K"
Market Structure Overview
BOS (Break of Structure): Multiple BOS points indicate strong shifts in market direction, confirming both bullish and bearish trends across different zones.
Bearish Fair Value Gap (FVG): This zone, marked after a BOS on July 23–24, acted as a rejection area, initiating a sharp sell-off — a classic bearish imbalance fill and reversal.
Equal Lows & Sell-side Liquidity: This area attracted liquidity grabs, as smart money hunts resting stop losses below these equal lows before reversing direction.
🔸 Key Supply & Demand Zones
Previous Resistance Zone (~118,000 - 120,000): Price rejected this area after filling the imbalance, confirming it as a strong supply zone.
Support Zone (~112,000 - 113,000): Currently acting as a high-probability demand zone. Liquidity accumulation here suggests a possible bullish reversal.
📉 Liquidity Zones
Sell-side Liquidity Sweep: Price dipped below equal lows to collect liquidity, often a signal of institutional accumulation.
Liquidity/Fair Value Zone (~116,000): Acts as a magnet for price, offering potential retracement targets before any major trend continuation.
📈 Forecast & Target
Current Price: $114,061
Short-term Target: $117,546 — aligning with previous FVG imbalance and liquidity zone.
Bias: Bullish Reversal expected from support zone toward the previous inefficiency and resistance levels.
🎓 Educational Takeaways
BOS Confirmation is critical in validating trend shifts and structure breaks.
FVGs (Fair Value Gaps) highlight inefficiencies and offer high-probability reversal or continuation zones.
Liquidity Sweeps near equal lows/highs often precede smart money moves — useful for spotting entries and exits.
Volume Profile (left side) suggests higher activity zones — these areas often align with major turning points.
✅ Conclusion
BTCUSD has swept liquidity below support and is showing signs of reversal. If the bullish pressure holds above $113,000, a move toward the $117,500 zone is likely, targeting previously unfilled imbalance and trapped liquidity.

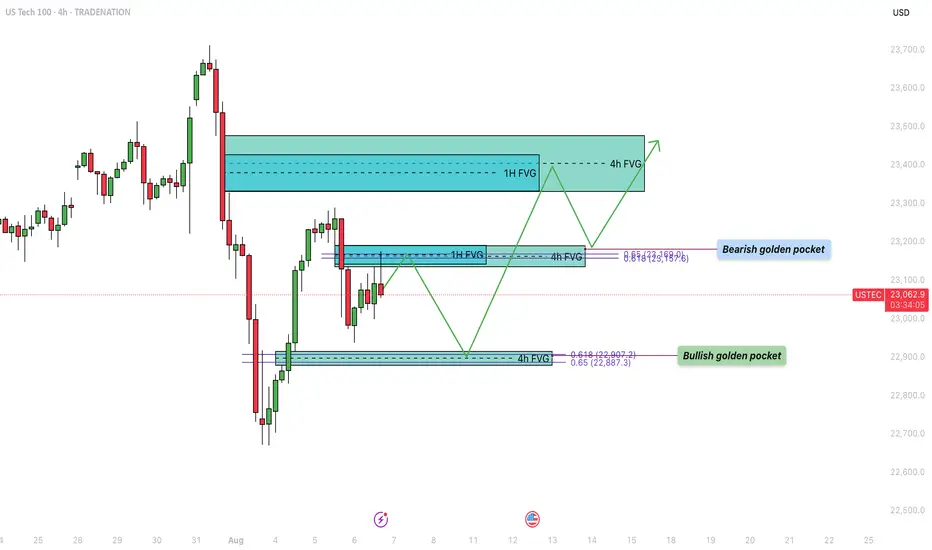
US100 - Bullish trajectory to fill the inbalance zones!Over the past week, the US Tech 100 (US100) experienced a sharp decline, dropping into a significant support zone. During this bearish move, several fair value gaps (FVGs) formed on both the 4-hour and 1-hour timeframes, which remain unfilled. Currently, price action is retracing upward, aiming to fill these imbalances. The structure of the market suggests that both bullish and bearish scenarios are in play, depending on how price reacts to key levels marked by these FVGs and Fibonacci retracement zones.
Bearish Resistance
The first major area of resistance is located around the $23,160 level, which has just been tapped. This zone presents a strong potential turning point due to the confluence of a 1-hour and a 4-hour fair value gap, which perfectly align with the 0.618–0.65 Fibonacci retracement level, also known as the golden pocket. This cluster of technical signals increases the probability that this level will act as a strong supply zone, potentially initiating a rejection back toward the lower support area.
Bullish Support
On the downside, a key level to watch is around $22,900. This zone marks a 4-hour FVG that was formed during the recent upward move. Importantly, this area also coincides with the golden pocket from that very same leg up, offering a compelling confluence for bullish support. If price revisits this level, it may act as a strong demand zone, providing a springboard for the next leg higher, particularly if buyers step in aggressively to defend it.
Bullish Trajectory
If support at $22,900 holds, the bullish trajectory suggests a possible continuation toward the $23,400 region. This upper target contains a large overlapping 1-hour and 4-hour FVG that remains unfilled. Historically, price tends to revisit and fill such imbalances before choosing a definitive direction. A bounce from the lower support zone and a successful break of the $23,160 resistance could pave the way for a clean move toward this higher target, completing the FVG fill sequence.
Final Thoughts
The US100 is currently navigating a key technical crossroads. With multiple unfilled fair value gaps and well-aligned Fibonacci levels on both the upside and downside, the next few sessions will be critical in determining short-term direction. If the $23,160 resistance continues to hold, a pullback to $22,900 could offer a high-probability long setup, while a clean break above this resistance opens the door to filling the higher FVGs.
-------------------------
Disclosure: I am part of Trade Nation's Influencer program and receive a monthly fee for using their TradingView charts in my analysis.
Thanks for your support. If you enjoyed this analysis, make sure to follow me so you don't miss the next one. And if you found it helpful, feel free to drop a like 👍 and leave a comment 💬, I’d love to hear your thoughts!
Trading EURUSD AUDUSD | Judas Swing Strategy 05/08/2025The Judas Swing strategy kicked off the new week with two solid setups on Monday, this time on OANDA:AUDUSD and FX:EURUSD While both played out beautifully from a structure and liquidity perspective, let’s walk through the reasoning behind each trade and how they unfolded
The first setup of the day formed on EURUSD during the early part of the New York session. Price had been ranging during the London hours, setting clear highs and lows. Just as expected, NY brought the liquidity sweep a sharp push above the range high, baiting breakout buyers and triggering stops.
That was our cue. Once the sweep completed, we watched closely for the break of structure to confirm the reversal. It came swiftly, followed by a retrace into the freshly formed Fair Value Gap the same confluence we wait for every time.
As price tapped into the imbalance and printed a bearish close, we executed the short. Risk: 1%. Target: 2R. Price moved cleanly in our direction, offering little drawdown and ultimately hitting our target in due time. A disciplined start to the week with a solid +2% gain.
Not long after we entered the FX:EURUSD position, OANDA:AUDUSD served up a nearly identical setup. Once again, we had a clear range established during the Judas Swing sessions. Then came the sweep price spiked above the range high, taking out buy-side liquidity before quickly reversing.
We marked our structure break and noted the FVG left behind. Just like before, we waited for the retrace no chasing.
Price pulled back, tapped the imbalance, and gave us a strong bearish entry signal. We entered short with the same parameters: 1% risk, aiming for a 2R return. The market delivered. The trade ran smoothly to target, netting our second +2% win of the day.

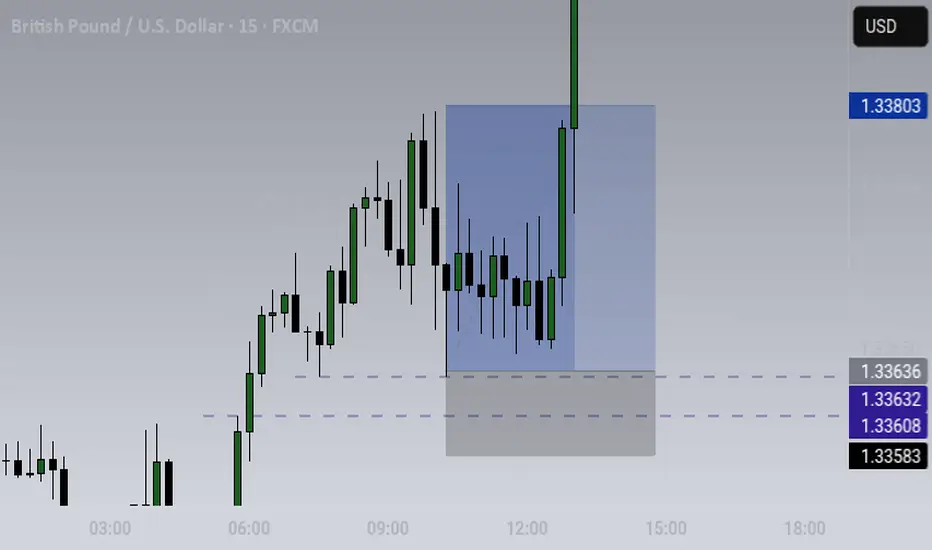
CABLE M15Beautiful delivery. Intraday Order Flow. The IR worked in the favour of the trade. Still bullish, will see how it reacts at the next Daily FVG
EURUSD Bearish Market Structure Unfolding – Liquidity Grab BelowEURUSD Bearish Market Structure Unfolding – Liquidity Grab Below Support Expected"
🔍 Technical Analysis Breakdown:
🔺 Resistance Zone (1.17500 - 1.18500)
Labelled “Strong High”, this is a high-supply zone where price previously reversed.
Multiple Break of Structure (BOS) and Change of Character (CHoCH) confirm this as a strong bearish supply area.
Any retracement toward this level could be ideal for short entries.
🟩 Fair Value Gap (FVG)
This imbalance area previously served as a magnet for price before it broke down.
Price failed to hold inside the FVG, reinforcing bearish sentiment.
🔻 Support Zone (1.13500 - 1.14000)
Marked as a "Weak Low", suggesting this level is likely to be taken out in a liquidity sweep.
Price is expected to retest and potentially break below this zone in the near term.
📉 Current Price Action
Recent CHoCH (Bearish) confirms shift in structure.
Price has made a corrective pullback and seems poised for another leg down.
Highlighted grey zone suggests price may retrace slightly higher before continuing its bearish move.
🎯 Bias: Bearish
Expecting downside continuation toward 1.13500 support, targeting liquidity below.
Traders may wait for rejection signals on lower timeframes around the minor pullback zone before executing shorts.
📚 Educational Notes:
CHoCH indicates a shift in market sentiment (from bullish to bearish).
FVG often acts as a magnet but if not respected, confirms momentum in the opposite direction.
Support/Resistance zones are used to determine institutional activity zones.

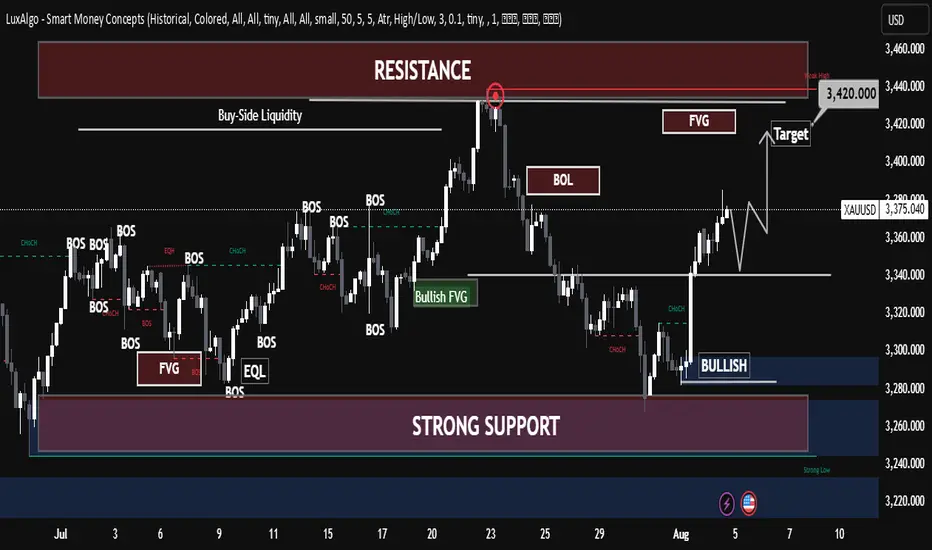
XAUUSD Chart Analysis – Smart Money Concepts (SMC) Based🔍 XAUUSD Chart Analysis – Smart Money Concepts (SMC) Based
1. Market Structure Overview:
The chart clearly shows a bullish market structure forming after a sequence of Breaks of Structure (BOS) and Change of Character (CHoCH) events.
The market has consistently made Higher Lows, indicating strength from the bulls and institutional order flow to the upside.
2. Key Zones Identified:
✅ Strong Support Zone (Demand Area):
Around $3,260–$3,280, this level has been respected multiple times.
It is marked with BOS, CHoCH, and a Bullish Fair Value Gap (FVG) indicating institutional accumulation and unfilled orders.
The area also contains a Weak Low, which gives price a reason to stay above if bullish sentiment continues.
❌ Strong Resistance Zone (Supply Area):
Around $3,420–$3,460, this area shows signs of Level Rejection and is labeled with Buy-Side Liquidity.
This is where price previously reversed after grabbing liquidity—indicating distribution and possible shorting interest from smart money.
3. Liquidity Zones:
Buy-Side Liquidity: Above recent swing highs near $3,420–$3,440. Price tapped this level and sharply rejected.
Sell-Side Liquidity (Target Area): Currently aiming for the zone around $3,350, which aligns with a recent imbalance (FVG) and a clean liquidity pool below short-term higher lows.
4. Fair Value Gaps (FVGs):
A Bullish FVG is seen mid-chart, where price was rapidly driven up, leaving a gap—price later returned to this zone, respected it, and pushed higher again.
This is a strong sign of institutional entry and provides excellent long entries.
5. Trend Confirmation:
BOS + CHoCH + Higher Lows = Bullish Bias.
Each low is forming higher than the previous, with strong rejections from demand zones.
6. Entry & Target Insight:
Entry Point: After price reacted from support and printed another Higher Low.
Target: Currently price is targeting $3,350 (short-term retracement or pullback target).
This target is likely an internal liquidity sweep before potential continuation to retest the resistance zone again.
7. Educational Takeaways:
Market Structure is King: Observe BOS/CHoCH for directional bias.
Liquidity Matters: Understand where liquidity is resting—price seeks it.
FVG as Entry Tool: Fair Value Gaps provide high-probability trade setups when aligned with structure.
Patience at Key Zones: Wait for confirmations at resistance/support rather than impulsive trades.
✅ Summary:
Bias: Bullish, until structure breaks.
Short-Term Target: $3,350 (as per the chart).
Long-Term View: If price maintains higher lows, potential revisit to the resistance zone ($3,420–$3,460) is likely.
Invalidation Level: Break and close below strong support ($3,260) would shift bias.

Gold 15-Min Breakout: Eyes on M30 Supply Zone & FVG RetestPrice is currently approaching a key M30 Supply Zone after a strong bullish impulse from the ascending trendline support.
🔹 Key Observations:
The price broke above a previous short-term resistance zone and is now retesting the Fair Value Gap (FVG) area marked in pink.
The 200 EMA acted as dynamic support, further fueling bullish momentum.
Structure shows a series of higher lows, confirming buyers in control on intraday timeframes.
🔹 Potential Scenarios:
✅ Bullish Continuation:
If the price respects the FVG as demand and forms bullish confirmation, continuation toward the M30 Supply Zone and the 3,399–3,400 region is likely.
⚠️ Pullback Risk:
A deeper retracement below FVG could retest the trendline or the 3,371 support near the 200 EMA before any further upside.
🔹 Trade Plan:
Watching for price action reaction inside the FVG. A clean rejection could offer entries targeting the upper supply zone.

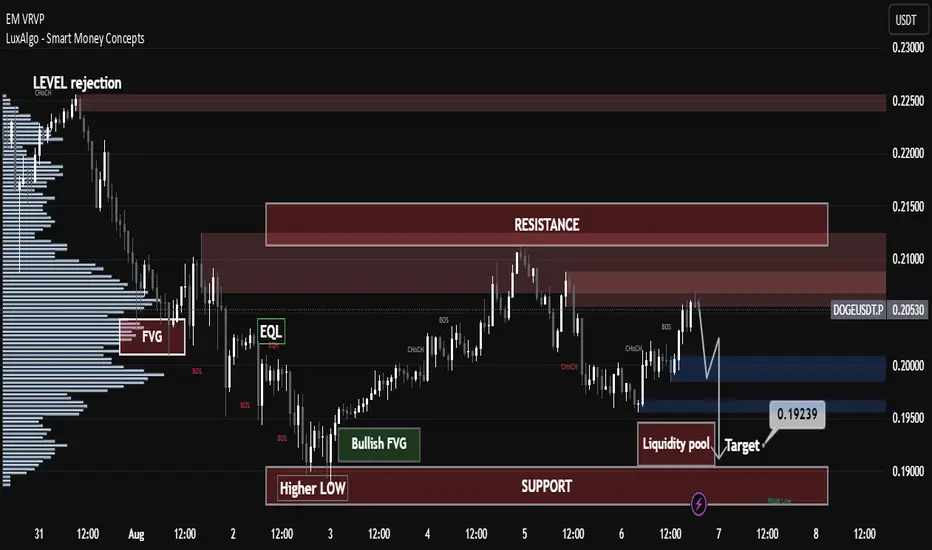
IS DOGE Losing Steam or Gearing Up? Pro-Level Market Structure IS DOGE Losing Steam or Gearing Up? Pro-Level Market Structure
📊 Technical & Trend Analysis
Current Price & Structure:
DOGE is trading around $0.2058 and has recently fallen below both the ascending trendline since late June and the 50‑day EMA (~$0.20), signaling weakening momentum
Resistance & Support Levels:
Major Resistance: ~$0.21–$0.212 — price has repeatedly failed at this zone, forming a possible bearish flag or resistance trap
X (formerly Twitter)
+15
Mitrade
+15
Cryptonary
+15
.
Support Zones: Key levels around $0.196 and $0.18, breach of these may open path to $0.15 or lower short-term
Mitrade
.
Trading Sentiment & Derivatives:
Rising short interest and negative funding rates in futures suggest growing bearish sentiment among traders. Long-short ratio is near 0.86—indicating more shorts than longs
Binance
+1
.
🎓 Technical Setup Summary (Educational Breakdown)
Chart Pattern: Potential bearish continuation forming with flag or descending consolidation after breakdown.
Momentum Indicators: Weak RSI and MACD below zero typically align with this structure—though check live chart from platforms like TradingView or Investing.com
Investing.com
.
Trade Selection Approach:
Short Trade Setup: Wait for confirmation below $0.196 to test trend continuation toward $0.18 or $0.15. Stop-loss above $0.202–$0.205.
Long Trade Setup: If DOGE reclaims $0.21 with volume and breaks above the broken trendline + 50‑day EMA, potential rebound toward ~$0.225 or higher. Stop-loss below $0.20.
🔮 Forecast & Outlook
Short-Term: Likely consolidation or correction toward $0.18 unless bullish momentum resumes. Analysts eye potential targets around $0.199–0.215 in early August, rising maybe toward $0.232 by mid-August if sentiment snaps back
Binance
+2
Indiatimes
+2
Indiatimes
.
Medium to Long-Term:
Some speculative projections place DOGE near $1 by year-end, driven by hype cycles, meme coin revival, celebrity tweets, and ETF optimism. That being said, DOGE’s unlimited supply makes $1 an aggressive target requiring massive capital inflow
Crypto News
+5
Wikipedia
+5
Indiatimes
+5
.
✅ Key Takeaways for Traders & Learners
Concept Insight
Support/Resistance $0.196–$0.18 = bearish supports; $0.21 = strong resistance zone
Trendline & EMA Breaking below trendline/50‑day EMA signals weakening structure
Volume & Funding Increasing shorts and low funding rates hint at bearish pressure
Risk Management Use proper stop-loss zones ($0.196 for shorts, $0.20 for longs)
Catalysts to Watch Whale accumulation, meme hype, ETF news, celebrity endorsements
🚨 Risks & Important Considerations
Volatility & Pump Risks: MEME coins like DOGE are susceptible to pump-and-dump dynamics and social-media driven surges or dumps
Indiatimes
Binance
+1
.
Inflationary Drag: Without a supply cap, DOGE’s price is diluted by thousands of coins mined daily, limiting long-term upward momentum unless demand rises significantly.
Macro Events: Broader economic shocks—such as U.S. tariffs or regulation changes—can rapidly swing sentiment across crypto markets. Recent U.S. tariffs pulled DOGE down ~8% with Bitcoin and Ethereum
Wikipedia
.
🧭 Final Summary
Current Bias: Slightly bearish-to-neutral—downward pressure from technical breakdowns.
Watch Closely: $0.196 support and $0.21–$0.212 resistance; reclaiming one of these defines short-term bias.
Strategy:
Consider short plays below $0.196 toward $0.18.
Consider long plays only after strong breakout above $0.21–$0.212.
Always apply strict risk controls.
—
EURUSD - EURUSD – The Calm Before the SweepAfter months of climbing steadily within a rising wedge structure, EURUSD has finally broken beneath the bullish trend line that previously acted as dynamic support. This shift is significant, as it marks the first decisive violation of the bullish momentum that has carried price from the April lows into the July highs. The break occurred with strong bearish displacement, leaving behind an unfilled daily Fair Value Gap (FVG) just above the current price. This area now acts as a potential magnet for price before continuation lower.
Trend Line Retest and FVG Confluence
Price is currently hovering near 1.1570 after the trend line break. Above, we have a clean FVG on the daily chart which aligns closely with the underside of the broken trend line. A retracement into this zone would offer the ideal setup for short positioning, combining the concept of a bearish retest with inefficiency fill. From a technical perspective, this would give institutions a perfect level to engineer a lower high before continuing the move down.
Sell-Side Liquidity Objective
The major downside target sits below the swing low formed in early May. This area likely holds a large pool of resting sell-side liquidity, which would be an ideal draw for smart money before any potential reversal. If the market respects the bearish structure and rejects the FVG zone cleanly, the move toward this liquidity pocket becomes increasingly probable.
Reversal Conditions
While the short setup is currently the main focus, the area below the May low also presents a key decision point. If price sweeps that low and we begin to see bullish structure return, this could mark the beginning of a new leg up. For that to be valid, we’d need to see signs of strong buying interest, displacement, and reclaim of key short-term highs. Until then, we remain on the lookout for short opportunities into the FVG and trend line retest zone.
Execution Plan and Expectations
Traders should watch for signs of exhaustion or rejection once price enters the FVG zone. Bearish price action on lower timeframes like the 1H or 15M could confirm entry, particularly if the trend line holds as resistance. Stops can be placed above the swing high before the break, with targets below the major low around 1.10500. The reward-to-risk on this setup is favorable, but patience is needed to wait for the retrace to complete.
Conclusion
EURUSD has shifted from bullish to bearish structure after breaking the rising trend line. With an unfilled FVG above and a clean downside liquidity target, this setup offers a well-defined short opportunity. Reactions at the FVG and below the May low will dictate whether we extend lower or begin a new bullish phase. For now, all eyes are on the retrace and short continuation.
Disclosure: I am part of Trade Nation's Influencer program and receive a monthly fee for using their TradingView charts in my analysis.
___________________________________
Thanks for your support!
If you found this idea helpful or learned something new, drop a like 👍 and leave a comment, I’d love to hear your thoughts! 🚀

EURUSD - Major resistance ahead with the fair value gaps!The EUR/USD pair remains firmly within a prevailing downtrend, characterized by a consistent pattern of lower highs and lower lows. This bearish momentum has resulted in the formation of several significant Fair Value Gaps (FVGs) on the 4-hour chart, which now act as potential resistance zones on any pullbacks. These FVGs not only coincide with important technical structures, but also align with key Fibonacci retracement levels, adding confluence to their strength. In the analysis below, we’ll walk through these zones and discuss the most probable scenarios based on the current price action.
First resistance zone
The first major resistance lies within the 4-hour FVG in the 1.1600 to 1.1650 region. This zone coincides with the golden pocket, which is formed between the 0.618 and 0.65 Fibonacci retracement levels. This overlap strengthens the likelihood of price reacting bearishly here, should the market manage to retrace upwards into this area. Given the strong downward momentum, this level may be enough to trigger a continuation to the downside, making it a critical area to monitor for rejection signals.
Second resistance zone
The second key resistance is found in the upper 4-hour FVG, ranging from 1.1690 to 1.1750. This zone aligns closely with the 0.786 Fibonacci retracement level and marks a former support zone that has now been broken, indicating a potential structure break. Price returning to this level would be retesting the underside of broken market structure, which often acts as a powerful resistance area. Given this, a deeper pullback into this region may serve as a trap for late buyers and potentially offer a high-probability short setup.
Bullish bounce area
On the bullish side, the most relevant support is currently found within the 1-hour FVG that was formed last Friday, during the release of the U.S. unemployment rate data. This zone is positioned below current price levels and is likely to act as a strong short-term demand area. It is reasonable to anticipate a bullish reaction from this zone if the market retraces downward, making it a favorable area to seek long opportunities for a potential move into the higher resistance levels described above.
Final thoughts
While the broader trend remains bearish, short-term bullish bounces are likely within defined fair value gaps. Traders should keep a close eye on the 1-hour FVG for possible long entries, while watching the 4-hour FVGs, particularly those aligning with key Fibonacci levels, for signs of bearish continuation. If resistance holds firm, the EUR/USD could resume its downtrend, but any structural breaks or sustained closes above these levels would challenge that view. As always, price action around these zones should guide the final decision-making.
-------------------------
Disclosure: I am part of Trade Nation's Influencer program and receive a monthly fee for using their TradingView charts in my analysis.
Thanks for your support. If you enjoyed this analysis, make sure to follow me so you don't miss the next one. And if you found it helpful, feel free to drop a like 👍 and leave a comment 💬, I’d love to hear your thoughts!

Technical Breakdown (Smart Money Concepts-Based)📊 Technical Breakdown (Smart Money Concepts-Based):
🔹 Market Structure:
Multiple Break of Structure (BOS) signals show a bullish shift in momentum, especially after the recent CHoCH followed by BOS at the current price zone.
Strong bullish confirmation after reclaiming previous liquidity zones, indicating institutional interest.
🔹 Liquidity and Zones:
Buy-Side Liquidity above $3,420 is likely the short-term institutional target.
Price has clearly reacted from a strong support block near the $3,260–$3,280 area, confirming demand and institutional accumulation.
The highlighted Bullish FVG (Fair Value Gap) aligns with a mid-level retracement zone—ideal for potential pullbacks before continuation.
🔹 Key Supply & Demand:
Resistance Zone (3,420–3,450): Contains weak highs and unmitigated FVG—prime liquidity zone for a sweep.
Strong Demand Zone: Around $3,260 has shown repeated reaction; the base of bullish moves.
Imbalance Fill & Rejection Expected in FVG near $3,420.
🔮 Projection & Scenario:
Expected pullback toward $3,340–$3,350, followed by bullish continuation.
Targeting liquidity sweep at $3,420, aligned with Smart Money accumulation and distribution logic.
Monitor for reaction at $3,420 for either a rejection or a clean breakout, confirming further upside.
✅ Conclusion:
This setup suggests institutional buy-side pressure with targets on resting liquidity around $3,420. Smart Money is likely driving price toward that level to grab orders before the next big move.
Bitcoin - Imbalance Fill Before Liquidity ExpansionBitcoin is trading inside a compressing structure beneath a clean descending trendline. Price action has been choppy but controlled, creating multiple zones of inefficiency that remain unfilled. We’re currently positioned between two major Fair Value Gaps, one above and one below, which gives us a clear roadmap. The broader market context suggests accumulation beneath key resistance, and the chart structure points toward a two-legged play before any breakout.
First Target: Upper Imbalance and Liquidity Trap
The first objective for price is to reach into the Fair Value Gap sitting just above current levels. This zone overlaps with the trendline and is backed by several wicks and failed breakouts, which likely means liquidity is built up there. Price may push through this area to trigger stop losses and induce breakout buying, only to reverse shortly after. The imbalance makes it an attractive magnet for price and a likely turning point once filled.
Retracement Move: Clean-Up Below
After sweeping the highs and filling the upper imbalance, price is expected to rotate back down. The area below holds an untouched Fair Value Gap from a previous bullish impulse, now acting as a demand zone. Once the upper inefficiency is filled, the market should drop into this zone to rebalance. This move will also help clear internal liquidity from the structure formed during the short-term rise.
Trendline, Inducement, and Execution Layers
The descending trendline plays a critical role here. With many traders watching it for a breakout or rejection, it acts as inducement. A false break or a touch just above the trendline may trigger entries in the wrong direction. The optimal move would be for price to react from the upper imbalance, reject at or just above the trendline, then fall into the lower zone, where we look for confirmation of reversal or continuation.
Final Expansion: Breakout After Cleanup
Once both Fair Value Gaps are filled and internal liquidity is cleared, Bitcoin will be in a clean position to rally. The area above the prior wicks and rejections is likely to hold significant liquidity, and the final move would aim to sweep that. This would complete the full cycle of imbalance fill, liquidity grab, and directional expansion. Price is unlikely to sustain a move higher until both zones have been addressed.
Conclusion
This setup focuses on efficient price delivery between key imbalances. Expect a short-term push up into the upper FVG and liquidity cluster, followed by a clean rejection into the lower demand zone. Once both sides are filled, Bitcoin should be ready for a real move higher, targeting liquidity above the current range. Let the market complete the cycle before looking for continuation.
Disclosure: I am part of Trade Nation's Influencer program and receive a monthly fee for using their TradingView charts in my analysis.
___________________________________
Thanks for your support!
If you found this idea helpful or learned something new, drop a like 👍 and leave a comment, I’d love to hear your thoughts! 🚀
Hedera (HBAR) – Pullback Opportunity After 100% RallyHBAR has surged 100% recently. With the broader market entering contraction, we’re now watching for a healthy retracement into key support, aligning with the 50% Fibonacci level and a fair value gap (FVG). This could be the formation of a higher low before continuation.
🔍 Setup Overview:
Entry Zone: $0.22 – $0.19
Take Profits: $0.26 / $0.32 / $0.37
Stop Loss: Daily close below $0.18
Bias: Bullish continuation from support
🧠 Trade Idea:
Price is approaching a confluence zone of Fib support and unfilled imbalance. As long as daily structure holds above $0.18, the bullish case remains intact. This zone offers an attractive long setup for the next move higher, targeting previous resistance levels.
⚠️ Invalidation:
A daily close under $0.18 would break structure and invalidate the setup. Monitor price action and volume confirmation around this support zone for entry timing.

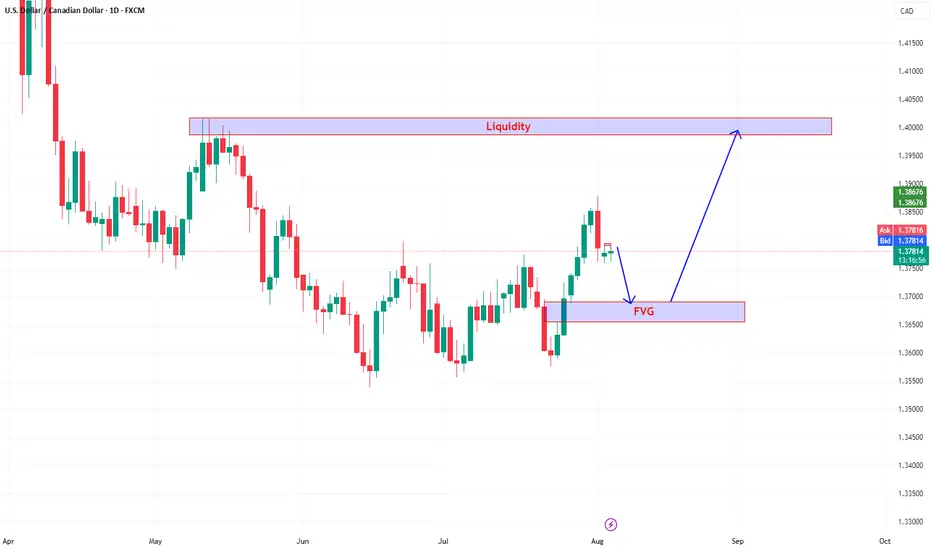
USDCAD is forming a bullish structure.We can a clear bullish structure forming after a series of higher highs and higher lows, indicating bullish momentum building. Recently, price rejected from a key swing high and appears to be pulling back. This pullback is targeting a Fair Value Gap (FVG) marked in the blue zone then bounce from the FVG zone back toward the overhead Liquidity Zone.
Sunday Premarket AnalysisWe will likely hit the 4H FVG not too far above where price left off on Friday.
Then head all the way down take July's low and hit the area below that
because there is a BIG FAT juicy MONTHLY, WEEKLY && DAILY FVG
sitting directly under the July monthly low. We will likely hit all three or maybe just 2
of these FVG's and then head up for super big push, bullish into at least the first week of September. Keep in mind Jackson Hole Symposium is mid month-ish also.
