Bitcoin - Bulls Took Control: 85k Next?Bitcoin continues to show signs of strength as the previously formed double bottom structure remains valid. This pattern, commonly associated with a bullish reversal, suggests that buyers have successfully defended a key support area and are now regaining control. The second bottom reinforced the significance of this level, confirming the presence of demand and a potential shift in momentum.
Unlike the previous scenario where bearish pressure threatened to invalidate the pattern, this time the market has respected the formation. The double bottom is holding firm, and price has begun to move higher, offering further confirmation of short-term bullish intent.
Support Found Within the 4-Hour Imbalance
A critical turning point in the current price action came as Bitcoin dipped into a 4-hour imbalance zone and found strong support. This area, marked by a sharp displacement in price, often acts as a magnet for liquidity before the market continues in its intended direction. The bounce from this imbalance not only held but was followed by a decisive move above the zone.
This development is important because it confirms that buyers were waiting in this inefficiency to accumulate, and the resulting upward movement reinforces the idea that this was a high-probability support level. The break above the imbalance now positions Bitcoin to potentially pursue higher liquidity areas.
Potential Move Toward the 4-Hour Fair Value Gap
With the imbalance zone now acting as support, price appears poised to push higher into the next key area: the 4-hour fair value gap located above. This FVG has not yet been fully filled, and Bitcoin has historically shown sensitivity to this zone, rejecting multiple times from it without managing to reclaim or fill even 50% of the gap.
Given the current bullish structure and momentum, there is now a real possibility that price could seek to fill this fair value gap more substantially—potentially up to the 85,000 region. This would align with the typical behavior of price returning to inefficiencies in the market, especially when backed by a valid reversal pattern such as the double bottom.
The 85,000 area also overlaps with a previously defined resistance, so while this presents a logical target for bulls, it may also be where sellers attempt to reassert themselves. Watching price behavior as it approaches this zone will be crucial for managing risk and spotting any early signs of reversal.
Conclusion
Bitcoin is currently respecting the double bottom structure and has found renewed strength after bouncing from the 4-hour imbalance zone. With price now above this key support, the path of least resistance appears to be to the upside, targeting the fair value gap near 85,000. This zone remains unfilled and represents a likely draw for price in the short term.
Unless we see a strong rejection or sudden weakness, the current setup supports a bullish continuation scenario, with eyes on a partial or full fill of the FVG. Traders should continue to monitor the strength of this move and look for reactions near the 85,000 level to determine whether momentum will sustain or fade.
__________________________________________
Thanks for your support!
If you found this idea helpful or learned something new, drop a like 👍 and leave a comment, I’d love to hear your thoughts! 🚀
Make sure to follow me for more price action insights, free indicators, and trading strategies. Let’s grow and trade smarter together! 📈
Fvg

BTC - breakout or bull trap in progress?Yesterday, Bitcoin broke out of the descending trendline it had been respecting for several days, forming a clear double bottom in the process — a classic reversal pattern suggesting bullish intent. Since then, price action has shifted into a consolidation phase, hovering just beneath a key liquidity zone filled with stop-loss orders from prior short positions.
This area aligns closely with the previous 4H lower high, above which lies a fair value gap (FVG) that hasn't yet been fully filled. A move into this region seems likely, especially with liquidity resting above the prior high. We could see BTC targeting a partial fill — around the 50% mark — of that 4H FVG before any significant reaction occurs.
On the way up, BTC also created another 4H FVG. It’s likely that price could revisit and partially fill this imbalance before continuing its move higher. This zone could serve as an ideal retracement area for bulls to re-enter, especially if the market seeks to rebalance before making a stronger push.
Looking ahead, the $85.5K level stands out as a highly probable target. It marks a key psychological and technical resistance zone and is a magnet for liquidity. With momentum building and the current structure leaning bullish in the short term, a sweep of that level in the coming days is entirely plausible.
However, it's important to zoom out. Despite this bullish momentum, the broader market structure remains bearish. Unless BTC breaks above and holds above this larger structure convincingly, rallies are more likely to be liquidity grabs rather than true trend reversals. Once $85.5K is tagged, there's a real possibility of a sharp rejection — potentially sending price back toward local lows or even printing new ones.

Bitcoin – Double Bottom at Risk as Fair Value Gap Rejects PriceBitcoin recently formed a potential double bottom pattern, a classical bullish reversal formation that often signals a shift in market sentiment from bearish to bullish. This pattern is typically interpreted as a sign that the market has found a significant support level, where buying interest is strong enough to halt the prior downtrend. The structure is generally confirmed when price breaks above the neckline, leading to a continuation move to the upside.
In this case, the double bottom suggests buyers are attempting to establish control and potentially drive price higher. However, while this pattern often results in upward movement, it should not be taken in isolation. The context surrounding this pattern is critical, especially when factoring in additional technical elements currently influencing Bitcoin’s price action.
Fair Value Gap on the 1-Hour and 4-Hour Timeframes
Despite the bullish implications of the double bottom, Bitcoin is currently trading within a fair value gap (FVG) on both the 1-hour and 4-hour charts. Fair value gaps represent zones of inefficiency created when price moves too quickly in one direction, leaving behind an unbalanced area in the market. These gaps often act as magnets for price to return and rebalance before a continuation or reversal.
As of now, Bitcoin has not demonstrated strong acceptance above this fair value gap. Instead, price is consolidating or slightly pulling back within this region, signaling that the move higher might be losing momentum. If the current candle closes below this FVG zone, especially on the 4-hour timeframe, it could indicate that bulls are running out of steam. Such a development would weaken the bullish case and suggest that the earlier double bottom may be invalidated.
This would shift the narrative toward a more bearish outlook, potentially opening the door for a deeper retracement or even a new leg down. It’s crucial to watch how price behaves around the FVG, as a decisive close below it would highlight weak demand and the possible presence of distribution rather than accumulation.
Rejection from a Key Resistance Level
Adding further weight to the bearish risk is the recent strong rejection from a significant resistance level. This area has acted as resistance in the past and once again proved formidable as Bitcoin failed to break through with conviction. The rejection was sharp and occurred precisely as price entered the fair value gap, reinforcing the idea that this zone may be acting as a trap for longs rather than a springboard for further gains.
This resistance area may now serve as a local high. Unless bulls can reclaim this level with strong momentum and volume, the path of least resistance appears to be to the downside. The inability to break through this resistance while trading within a fair value gap further suggests that current market strength may be overstated.
Critical Levels to Watch
The lower boundary of the fair value gap is the most immediate level of interest. A 1-hour or 4-hour close below this area would be a clear sign of weakness.
The support zone formed by the double bottom must hold to keep the bullish thesis intact. A break below this level would fully invalidate the pattern.
On the upside, the resistance that caused the recent rejection needs to be reclaimed decisively to confirm renewed bullish strength.
Conclusion
In summary, while Bitcoin initially showed signs of bullish reversal via a double bottom formation, the surrounding market context introduces significant doubt. Price is currently stalled within a fair value gap on the 1H and 4H timeframes, and the failure to maintain strength within this zone could invalidate the double bottom entirely. Furthermore, a strong rejection from key resistance suggests that sellers are still present and actively defending higher levels.
A close below the FVG zone would signal that bulls are losing control, and downside continuation becomes more likely. Traders should remain cautious here, avoiding premature bullish entries unless there is clear evidence of strength, such as a reclaim of the FVG and a strong move above resistance. Until then, the risk of a deeper drop remains very real.
__________________________________________
Thanks for your support!
If you found this idea helpful or learned something new, drop a like 👍 and leave a comment, I’d love to hear your thoughts! 🚀
Make sure to follow me for more price action insights, free indicators, and trading strategies. Let’s grow and trade smarter together! 📈

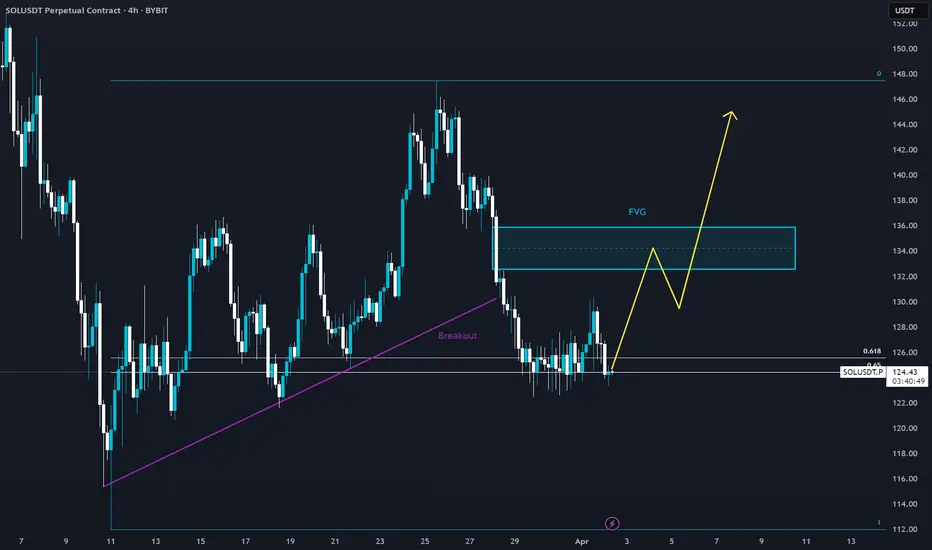
SOL — Clean Liquidity Grab & FVG Flip. Mid-Term Setup in PlayClassic move on SOL — liquidity sweep, inverted the FVG, and pushed higher. Textbook stuff.
Not expecting an instant pump, this one looks more like a mid-term play… although, with SOL, you never know.
Stay sharp. And follow to catch the next ones early.
Entry: 109
TP: 123-148

AUDUSD Long – Fair Value Gap + Macro Confluence + Bullish LEI AUDUSD Swing Long Setup – Technical + Macro Confluence
✅ Bias: Long AUD/SD
Based on a multi-factor thesis:
Macro: RBA steady; AUD LEI rising steadily (87 → 96), Endogenous improving
USD Weakness: Fed dovish + GDP downgraded = downside pressure
Seasonality: USD historically weak entire April

Examples of invalid setups | Judas Swing Strategy 07/04/2025As traders, it's crucial to spend time in the lab backtesting your strategy and exploring ways to optimize it for better performance in live markets. You’ll start to notice recurring patterns, some that work in your favor, and others that consistently lead to unnecessary losses. It might take time to spot these patterns and even longer to refine them to fit your trading system, but going through this process is what helps you evolve. In the long run, this is what you need to do to become a better trader.
We spent a considerable amount of time refining our entry technique for the Judas Swing strategy after noticing a recurring issue where entering with a limit order sometimes gets us stopped out on the very same candle. After testing a few alternative entry methods and making some key adjustments, we finally found an approach that worked consistently for us. On Monday, April 7th, 2025, this refinement proved its worth by saving us from two potentially painful losses. In this post, we’ll walk you through exactly what happened and how the improved entry made all the difference.
We got to our trading desks ready to scout for setups and were drawn to promising setups forming on both FX:AUDUSD and $NZDUSD. This was exciting since the previous week offered no solid trading opportunities. As price swept the liquidity resting above the highs of the zone our bias quickly shifted toward potential selling setups for the session. But before taking any trade, we always ensure every item on our entry checklist is met. Here’s what we look for:
1. A break of structure to the sell side
2. The formation of a Fair Value Gap (FVG)
3. A retracement into the FVG
4. Entry only after a confirmed candle close
With the first two requirements on our checklist confirmed, all that remained were the final two and at this stage, patience is key. As price began retracing toward the FVG on both FX:AUDUSD and OANDA:NZDUSD , things got interesting. Price came into the Fair Value Gap on both pairs, checking off the third requirement. Now, all that was left was to wait for the current candle to close.
But that’s where things will be clear to you now.
Had we jumped in early with a limit order, we would’ve been stopped out on the same candle. This moment served as a perfect reminder of why we now wait for a confirmed candle close before taking any trade. It’s this extra step that helps us avoid unnecessary losses and stick to high-quality setups.
This entry technique like any other, comes with its own set of pros and cons. At times a limit order might offer a more favorable entry price compared to waiting for a candle close and that can influence both your stop-loss and take-profit placements. On the flip side, there are also instances where waiting for the candle close gives you a better entry than the limit order would have. That’s why it’s so important to backtest.
Your job as a trader is to put in the time to study and test what works best for your system. We chose this candle close entry method because we did the work. After extensive backtesting and data analysis, we found this approach aligns best with the results we aim for in the long run.

NZDUSD Long Setup – FVG + Order Block + Macro Bullish BiasI'm looking to go long on NZDUSD based on a strong confluence of fundamentals, seasonal trends, and technical structure.
🔹 Macro bias: USD weakening as Fed leans dovish, while NZD is gaining momentum from rate cuts and improving LEI.
🔹 Seasonality: Historically, NZD shows strength in the first half of April, while USD tends to weaken mid-to-late April.
🔹 Technical setup:
Price left a Fair Value Gap (FVG) on the 4H chart
Pullback into a bullish Order Block (OB)
Entry within imbalance

Ultimate Guide to Smart Money ConceptsWhat Are Smart Money Concepts?
Introduction:
If you’ve been trading for a while, you’ve probably noticed that sometimes the market moves in ways that just don’t make sense. You’ve got your technical analysis all set, but the market seems to go in the opposite direction. That’s where Smart Money Concepts (SMC) come in.
At its core, SMC is all about understanding how big players in the market (think hedge funds, institutions, and banks) move prices. These players have massive amounts of capital and information, and they don’t trade like the average retail trader. Understanding their behavior can help you see where the market is going next before it happens.
What is Smart Money?
In the world of trading, smart money refers to the institutional investors who move markets with their huge orders. Unlike retail traders, who might be relying on indicators or patterns, smart money trades based on liquidity, market structure, and order flow.
While retail traders are typically reacting to price movements, smart money is the one causing those moves. They’re out there seeking out places where they can accumulate positions or distribute them. The tricky part is that they’ll often make the market go in one direction just to trap retail traders and get them to take positions before flipping it back to where they wanted it to go in the first place.
Key Concepts in Smart Money Trading
1. Market Structure
Market structure refers to the way price moves in a trend. It’s essentially a pattern of higher highs and higher lows for an uptrend, or lower highs and lower lows for a downtrend.
Smart money uses these patterns to their advantage. When they see the market creating a series of higher highs and higher lows, they’ll take advantage of that momentum to push prices further, knowing retail traders will follow along.
But when they want to reverse the market, they’ll push it in the opposite direction, creating a market structure shift or a break of structure, which signals that the trend is over and a new one is starting.
2. Liquidity
Liquidity refers to the amount of orders available to be filled at different price levels. Smart money knows exactly where retail traders are likely to place their stops or buy orders.
They’ll often push the price to these levels, triggering those stops and collecting the liquidity. Once that liquidity is grabbed, they’ll reverse the price and move it in the intended direction.
A common way to spot liquidity is by looking for equal highs or equal lows, where traders often place their stop-loss orders. These are often areas smart money will target.
3. Order Blocks
Order blocks are areas on the chart where institutions have placed big orders. These are key levels that represent where price might return to later, and they can act as areas of support or resistance.
Order blocks are usually found after big price moves. Institutions place these orders to either accumulate positions or offload them, and price often comes back to these levels to fill orders that were left behind.
4. Fair Value Gaps (FVG)
Fair value gaps, or imbalances, are price areas where the market moves quickly, leaving gaps between candlesticks. These gaps represent areas where the market has moved too fast for regular orders to fill, and price tends to return to these levels to fill the gaps.
Smart money knows that these imbalances are critical areas for future price action, and they’ll use them to re-enter the market after a move has been completed.
Why Does Smart Money Matter?
Understanding smart money concepts is like learning to think like an institution. Instead of chasing after price based on typical retail indicators, you start looking for the big moves that smart money is making. You begin to notice when the market is setting traps for retail traders, and how these large players accumulate positions before pushing price in a big way.
With SMC, you stop guessing and start anticipating. By looking for liquidity zones, order blocks, and market structure shifts, you can get in sync with the big players and follow their moves, not fight them.
Conclusion
Smart Money Concepts are all about shifting your perspective. Instead of thinking like a retail trader looking for quick breakouts, oversold/overbought conditions, or chasing trends — start looking at the market as the big players do. Pay attention to where the liquidity is, identify key order blocks, and use market structure shifts to guide your trades.
By learning to spot these key signs, you’ll stop being the one who’s trapped and start being the one who’s in sync with the smart money.
Ready to trade smarter? Keep an eye on those order blocks and liquidity zones — they’re where the real money is made.
Next Steps
- Start practicing by reviewing charts through the SMC lens.
- Keep refining your understanding of market structure, liquidity, and order blocks.
- Stay patient, smart money trades aren’t about quick wins, but about positioning yourself for big moves.
__________________________________________
Thanks for your support!
If you found this guide helpful or learned something new, drop a like 👍 and leave a comment, I’d love to hear your thoughts! 🚀
Make sure to follow me for more price action insights, free indicators, and trading strategies. Let’s grow and trade smarter together! 📈

USDJPY = Win. Finally? I have shit winrate, but at least this trade is "logical", and has followed the trading plan lol.
TRADING SPECS:
BIAS = DOWNTREND
NARRATIVE = 4HR BEARISH PD ARRAY(S/R FLIP+FVG)
CONTEXT = RESPECTED PREMIUM ARRAY + A Wave
ENTRY = SELL STOP ORDER @ A WAVE LOW (RUN ON LIQUIDITY). Nearly got SL'd. OPTIMAL ENTRY WOULD HAVE BEEN THE BEARISH FVG AFTER THE "4HR PREMIUM ARRAY REBALANCE" INSIDE CONTEXT AREA. THERE WAS A SHARP TURN IN THERE SOMEWHERE BUT I DIDN'T WAIT FOR THAT.
RISK MANAGEMENT = N/A(?) JUST LET TRADE PLAY OUT. BUT SL WAS INSIDE THE ORDERFLOW LEG(?)
Here's how it went:
1. Assessed Day Bias - price was downtrending. checked orderflow and candle science for this shit
2. Assessed Current Price "Intention" - price only does two things: seek liquidity, and rebalance fair value.
When I plotted my Key Levels, price was at a point where it was just done seeking liquidity(support + poc was swept) and it was reversing.
I see an S/R Flip + FVG area. If price goes here, that means price has rebalanced fair value.. so, logic dictates that it will reverse again to SEEK LIQUIDITY.
When I came back to this chart again, price has already rebalanced fair value, has respected the S/R Flip + FVG, and has started reversing down.
3. Picked Out a Target - I picked out something realistic. Here is where indicators/tools come in.
Instead of using my confluence mix(POC+FVG+OTE pd array) as entry points,
"I just used it as a target since... price has already rebalanced fair value at the higher TF, and it's already going down, so it's probably going to seek liquidity on the other side. It's most probable target before price may or may not do something else is the FVG+POC+OTE AREA."
My choice of liquidity category was the Previous Day Session nPOC. Along with the FVG and OTE, it was a strong "magnet", especially considering that price has finished seeking buy side liquidity and therefore the price's next target are the liquidities below.
Wow, this makes so much sense to me now.
Price always intend to bounce from opposite liquidities, from higher timeframe to lower timeframe... so...
4. Waited for PA that will Deliver Towards Target - I think my entry here was sloppy, the weakest part of this trade. But it made sense, and it still worked anyway.
I just found a sting candle down(the A wave) after tapping the (S/R Flip+FVG).. I set a sell stop limit on the exact low of that candle.
LOGIC was, if price pushed down below that sting, especially with a strong fvg, it would validate the RESPECT of the (SR FLIP+FVG), and it would continue going down(an invalidation of a long continuation idea)... probably to, again, seek liquidity below.
Reason why I think my entry was sloppy, is because I did not validate the trade idea first. I didn't wait for that sting candle to get "run on(liquidity)" first. I think in order to validate it, I would have waited for the sting to become a run on liquidity area first, and then a second bearish fvg candle close to confirm downtrend. It would have been too late and the profit would have been too small at that point.
5. Put SL at the Orderflow Leg Swing High - If price was really not intending to continue going up, it wouldn't have gone here, which it didn't. I nearly got stopped out, like the other trades I had on sunday and monday.
-------------
Here's the pattern that I keep seeing though, when price makes a valid HIGH(like in this case, the SRFLIP+FVG rebalance), price will attempt to go here atleast twice with a WICK, but will still make lower highs. Usually, those second and third wicks will form as if it's going to take the liquidities at those wicks, but it will just take out the CANDLE BODY HIGHS... So take note of these next time.
When price sweeps a higher timeframe FVG/LIQUIDITY, mark out the candle body closes as TARGET LIQUIDITIES, not the wicks. If a downtrend is valid, it will only take out the body close liquidities. I will make a diagram to help make this make sense lmfao.
-------------
I feel like a mad scientist at this point... endlessly trying to see the actual logic in the market. Not the probabilities of patterns playing out, but the CAUSES and EFFECTS.
I think I'm close to finding the pattern within the pattern... or the message hidden in the patterns(Arcane reference, anyone?).
But I think the two things I have found thanks to Arjo is...
"Price only does two things: 1. Seeking Liquidity 2. Rebalancing Fair Value
and Higher TF = Rebalancing Fair Value <-> Lower TF = Seeking Liquidity"
and
"The Higher the Timeframe, The Stronger the Timeframe"
Like... the market isn't random. I think these two things are the core principles of trading.
Because with these two ideas, you don't need a strategy. You need to UNDERSTAND this. And the strategy can be adapted to whatever you see on the chart.
You open EURUSD, and you see that price is on a downtrend, and it has recently rebalanced the bearish fair value gap on the 4HR? You know what price will do next. It will continue going down to seek liquidity below. So, with that information, what will you look for? How will you enter? Where will you set your entry point, your stoploss, and where is your target?
You open USDCAD, and you see that price is on an uptrend, it has already rebalanced fair value below, has made a bullish choch+FVG, and has respected that choch+FVG on a lower timeframe. You know it will seek buy side liquidity next. So how will you enter? Where will you place your stoploss? Where's your exit?
-------
Now, if only I can translate this knowledge into actual consistency in trading, I can finally make money.
But I guess doing the journal is great. I'm consistently at the 25-30% winrate. So with this understanding.. Maybe I can slowly push that winrate up over time.
I think mechanically, the trade entries i had a year ago and now was the same(choch+POC+FVG+OTE), but now I have the understanding of why it may work or why it won't work, and when do I apply it so I increase the odds of winning. So that's something.
Before, I didn't know why it did or did not work. But now, I know.
I can use this info moving forward to increase my odds.
-------
OH WAIT YEAH, IF I KNOW WHAT THE MARKET DOES AND WHY IT DOES WHAT IT DOES, THEN I WILL BE ABLE TO REFINE MY ENTRIES, BECAUSE NOW I KNOW WHY AND HOW I'M MAKING MY MISTAKES. HELL YEAH.
-------
I'm just not sure about whether I can stick to one entry strategy now, or if I should, or I won't trade something that looks doable under my principles... because I've studied everything, and it makes sense now. lmfao.
-------
if people are reading this(up to this point lol that was a long ash read), then thank you. Reply with your thoughts if ever.
Alright thanks bye

EURUSD – Why This Key Level Could Decide the Next Big MoveAt the moment, EURUSD is maintaining a bearish market structure on both the 1-hour and 4-hour timeframes. Price action has been consistently forming lower highs and lower lows, which is a clear indication of sustained selling pressure in the market.
Zooming in, we’ve noticed that previous support zones are no longer being respected, which further supports the bearish narrative. These failed supports are now acting as weak resistance zones, and price is cutting through them with minimal hesitation — a sign that buyers are losing control while sellers continue to dominate the market.
One of the key technical levels on our radar is marked by a horizontal red line, currently acting as minor support. A candle close below this level would be highly significant. It would indicate that the temporary consolidation or hesitation we're seeing is breaking to the downside. If this scenario plays out, it could trigger a strong bearish continuation, with increased volume likely to enter the market from breakout traders and institutions scaling in.
The chart points to a clearly defined target area for this move, located in the 1.07500 to 1.07800 range, which is marked in green. This is a strong historical support zone — one that has previously held and sparked reversals. We anticipate that if price reaches this area, we may begin to see a slowdown in bearish momentum and a potential reversal setup.
1 hour trend
Trade Plan
Bearish Bias While Below the Red Line
If price closes below the red line (~1.09200), I’ll be watching for follow-through to the downside.
Entry opportunity may exist on the retest of this broken level, provided price shows rejection or continuation patterns.
Target area: 1.07500–1.07800 (green support zone)
Bullish Setup at Key Support
Should price reach the green zone, I’ll wait for confirmation before entering a long position.
Ideal signs: bullish candlestick patterns, slowing momentum, volume divergence, or strong reaction wicks.
Potential upside target: reversion back to broken structure or trendline zone.
Fundamental Analysis: U.S.-EU Tariff Situation
In addition to the technical structure, we also need to be mindful of the fundamental backdrop, particularly the recent escalation in tariff-related discussions between the U.S. and the European Union.
The Biden administration is reportedly exploring a fresh round of tariffs on EU imports in response to long-standing disagreements around digital services taxes and subsidies in the aviation industry. These talks have gained momentum recently, with the potential for announcements in the coming days or weeks.
Should these tariffs be confirmed, it would likely:
Weigh heavily on the Euro, especially if the EU responds with retaliatory measures.
Increase uncertainty in trade flows, damaging investor confidence in the region.
Trigger a flight to the U.S. dollar as a safe haven asset, further fueling EURUSD downside.
On the flip side, if negotiations lead to a positive resolution or postponement of tariffs, the Euro could see some relief, which may coincide with a bounce from the green support zone on the chart potentially lining up with our long bias at that level.
Conclusion
The EURUSD pair is currently offering a clean, high-probability setup driven by both technical and fundamental factors. With the market respecting bearish structure on the lower timeframes and support levels being broken with ease, the path of least resistance remains to the downside at least until the 1.07500–1.07800 zone is reached.
From there, a shift in momentum could present a great opportunity to switch bias and look for a long entry with favorable risk-reward.
This trade idea remains valid as long as price respects structure. Always manage risk and stay updated with any breaking news around U.S.–EU trade talks, as those developments could heavily influence the direction of EURUSD in the coming sessions.
__________________________________________
Thanks for your support!
If you found this idea helpful or learned something new, drop a like 👍 and leave a comment, I’d love to hear your thoughts! 🚀
Make sure to follow me for more price action insights, free indicators, and trading strategies. Let’s grow and trade smarter together! 📈

Bitcoin - Bears are winning: is $72k next?After holding strong above $81,000 for a while, Bitcoin has finally broken its critical support zone, diving as low as the $74,000 region. This move signals a clear shift in short-term momentum and brings us closer to a significant imbalance zone that has yet to be tested or filled. The drop wasn’t exactly unexpected, especially with the growing macroeconomic pressure weighing on all markets right now.
Last week’s tariff announcement triggered a wave of uncertainty, and we’re now seeing that impact ripple across crypto, equities, and commodities alike. Risk-on assets are feeling the heat, and BTC is no exception.
Why $72K Is So Important Right Now
Looking at the chart, there’s a large imbalance zone sitting just below current price, right around the $72,000 level. This is an area where price previously moved up very aggressively, leaving a gap in the market structure that now needs to be filled for a healthier market. Markets tend to come back to these areas to rebalance before making the next major move.
What makes this zone even more interesting is the fact that it aligns perfectly with the 0.618 Fibonacci level also known as the golden pocket. This confluence makes $72K a very strong support zone, and a likely area where buyers could start stepping back in.
Because of this, I’m expecting another short-term bearish leg into this zone to complete the imbalance fill and tap into the golden pocket. From there, if we see strong reaction and volume kicking in, this could mark the beginning of a new bullish wave.
But What If $72K Doesn’t Hold?
Of course, no level is guaranteed to hold especially in shaky market conditions. If Bitcoin fails to defend the $72K area and breaks down with conviction, the next major target to watch will be the lower imbalance zone at $64K. That would be a deeper correction, but still within the broader context of a bullish cycle rebalancing phase.
A drop to GETTEX:64K would likely shake out more weak hands and allow for a stronger, healthier base to form before BTC attempts to reclaim higher levels. It’s not the primary scenario, but it’s one we need to keep on the radar if things escalate further.
What Comes Next?
In the short term, eyes are on that $72K zone. If BTC finds support there and gives us bullish confirmation such as higher lows, increasing volume, or a strong engulfing candle we could see a swift move back toward the $85K-$95K range.
But with macro uncertainty still looming, caution is key. Monitor how price reacts at support, keep risk in check, and be prepared for both scenarios a bounce from $72K or a continuation to fill the imbalance at $64K.
__________________________________________
Thanks for your support!
If you found this idea helpful or learned something new, drop a like 👍 and leave a comment, I’d love to hear your thoughts! 🚀
Make sure to follow me for more price action insights, free indicators, and trading strategies. Let’s grow and trade smarter together! 📈

BTC: FVG Filled – Room for Further Downside?#BTC didn’t reach the major demand zones below but gave us a minor bounce and filled the Fair Value Gap (FVG).
Now that the FVG is filled, the chart looks ready to continue the move down into stronger support areas.
Stay locked in—follow me so you don’t miss the next key levels. 📉✅

Bearish on GoldWaiting for price to tap into the imbalances (fvg). Need to have a bearish engulfing candle for entry. Will exit towards discount area of range.

Gold - Bullish Trend Faces a Break – A Deeper Pullback Incoming?Gold has been enjoying a strong and steady uptrend, consistently forming higher highs and higher lows within a well-defined ascending channel. However, we’ve now seen a break of structure, with price closing below the lower boundary of the channel. This signals that Gold might be in for a short-term pullback, as the market seeks to rebalance before the next potential leg up.
A break of an ascending channel often suggests that bullish momentum is cooling off, at least temporarily. While this doesn’t necessarily mean a full reversal, it does indicate that buyers may be taking profits, allowing the market to correct before continuing higher. This is a normal and healthy phase in an overall bullish market.
Why a Drop to $2960 Makes Sense
One of the key reasons to expect a pullback is the large imbalance zone that remains unfilled below current price levels. Imbalances in the market occur when price moves aggressively in one direction without creating proper structural support on the way up. More often than not, the market likes to come back and fill these inefficiencies before continuing in its primary direction.
In this case, we have an important confluence around the $2960 level, where the unfilled imbalance meets the 0.618 Fibonacci retracement level (golden pocket). The golden pocket is a high-probability reversal zone, where price tends to react strongly due to the presence of large institutional orders waiting to be executed.
This area becomes even more significant when combined with psychological levels and previous price action support. If Gold pulls back to this level, it could be an optimal entry point for buyers looking to ride the next bullish wave.
What Comes Next?
Once Gold reaches the $2960 region, we will need to watch for strong bullish reactions. If buyers step in aggressively, we could see Gold resume its uptrend and potentially push towards new highs. However, if buyers fail to hold the line at this level, things could get more interesting.
A failed bounce at $2960 would open the door for a deeper correction, possibly extending down to the $2860 - $2900 zone, where we have additional technical support levels. While this is not the primary scenario, it’s important to remain aware of the possibility in case bearish momentum increases.
Final Thoughts
At the moment, Gold is showing early signs of a pullback after breaking out of its ascending channel. The $2960 level is my primary target for this retracement, as it aligns with both the golden pocket and the unfilled imbalance zone. If price reaches this level and reacts bullishly, it could provide a strong buying opportunity before Gold continues its march higher.
However, if $2960 fails to hold, we need to be prepared for a larger move downward before the uptrend resumes. Either way, the next few days will be crucial in determining Gold’s next big move.
__________________________________________
Thanks for your support!
If you found this idea helpful or learned something new, drop a like 👍 and leave a comment, I’d love to hear your thoughts! 🚀
Make sure to follow me for more price action insights, free indicators, and trading strategies. Let’s grow and trade smarter together! 📈

Bitcoin - Bulls Defend Support: Is a Sell-Off Still Possible?A Major Support Zone Holds Once Again
Bitcoin just tapped into a key 4-hour support level, a zone where price has repeatedly bounced in the past. This area has proven to be a strong demand zone, with buyers stepping in each time price reaches it. What makes this level even more significant is that it perfectly aligns with the golden pocket Fibonacci retracement level, a key technical area where price often finds support before continuing its trend.
As expected, BTC reacted strongly upon reaching this zone, showing a sharp rejection and bounce to the upside. This confirms that buyers are still actively defending this area, and as long as we hold above this level, the probability of a move higher remains strong.
A Huge Imbalance Zone Above – Where Is BTC Likely Headed?
Looking ahead, the most interesting aspect of this setup is the large imbalance zone sitting above the current price. When price moves rapidly in one direction without much consolidation, it creates an inefficiency or imbalance in the market. These imbalances tend to get filled over time as price naturally retraces back to these areas.
In this case, there’s a significant imbalance above us, making it highly likely that Bitcoin will push higher in the coming sessions to correct this inefficiency. I’m targeting at least a 50% fill of this imbalance zone, as this is typically where price starts to show some reaction. This would put BTC at a critical decision point where we could either see further upside or a rejection back down.
If buyers remain in control, we could see Bitcoin fully filling this imbalance, which would push price towards the 84-85K range, a key area to watch for potential reversals.
What If Bitcoin Loses This Key Support?
While the current reaction from support looks promising, we always need to consider the bearish scenario. If Bitcoin fails to hold this golden pocket level and strong support zone, it could open the door for a much deeper retracement.
In this case, BTC could drop significantly, with the next major support sitting around the $72K level. This area represents a critical demand zone where buyers would likely step in more aggressively. A breakdown toward $72K would also signal a much larger corrective move within the broader trend, possibly shifting market sentiment in favor of bears.
What Comes Next?
Right now, Bitcoin is at a crucial point. The bounce from support suggests bullish strength, but the key test will be whether BTC can sustain this momentum and push into the imbalance zone. If we see a clean move into this area, I’ll be watching for potential short setups, as price often struggles to break through these zones in one attempt.
On the other hand, if Bitcoin fails to hold above this golden pocket and key support, the next logical move would be a retest of the $72K region, where buyers will have another chance to defend the trend.
For now, I remain cautiously bullish, expecting at least a partial fill of the imbalance before any major rejection. Let’s see how price action develops in the coming sessions!
__________________________________________
Thanks for your support!
If you found this idea helpful or learned something new, drop a like 👍 and leave a comment, I’d love to hear your thoughts! 🚀
Make sure to follow me for more price action insights, free indicators, and trading strategies. Let’s grow and trade smarter together! 📈

Trading GBPUSD | Judas Swing Strategy 25/03/2025We had a good trading session with the Judas Swing Strategy two weeks ago, as the strategy delivered 3 solid setups, 2 on FX:EURUSD and 1 on $GBPUSD. And guess what? All three hit their targets!
That’s a massive 6% gain for the week! And with these impressive results we wanted to see how the strategy will perform last week.
The strategy did not produce any setups on the currency pair we monitor ( FX:EURUSD , FX:GBPUSD , FX:AUDUSD , OANDA:NZDUSD ) on Monday 24th March and instead of forcing setups like other traders would we sat that day out. Why was this possible? we had backtested the strategy and had enough data to prove that when we stick to this strategy long term we'd be in putting ourselves in a profitable position.
On Tuesday, we returned to the trading desk, scouting for setups, when we noticed a potential opportunity on $GBPUSD. The currency pair had swept liquidity at the high of our zone, signaling a possible shift in direction. We then shifted our focus to selling opportunities for the session. Our strategy required waiting for a break of structure to the downside, followed by a retracement into the FVG before executing a trade
After waiting for an hour and 15 minutes, we finally got the break of structure to the downside. The only step left was a retrace into the FVG. After some patience, the retrace materialized, meeting all the criteria on our entry checklist. We executed the trade, risking 1% of our account with a target return of 2%
Trade Details:
Entry: 1.29513
Stop Loss: 1.29611
Take Profit: 1.29311
After entering the trade, price consolidated around our entry point for a while, showing no clear direction. However, we remained unfazed, trusting our well-backtested strategy, which has a 50% win rate. With a 1:2 risk-reward ratio, we know that consistently following our strategy will yield profits in the long run. Since we had risked only what we could afford to lose, the slow price movement didn’t shake our confidence
Unfortunately, this trade didn’t go in our favor and ended up hitting our stop loss. This serves as a reminder that not every trade will reach take profit and that’s perfectly okay. Losses are an inevitable part of trading, but what truly matters is maintaining a solid risk management strategy, sticking to a proven system, and thinking long-term. As traders, our edge comes not from winning every trade, but from executing consistently and letting probabilities play out over time

SOL - Breakout Retest & FVG Target This 4-hour SOL/USDT chart shows a breakout retest at a key support level, with a potential move toward the Fair Value Gap (FVG).
Key Observations:
🔹 Breakout & Retest: Price has broken below the trendline and is now stabilizing near support.
🔹 FVG Target: A bullish reaction from this level could send SOL toward the FVG before further continuation.
🔹 Potential Bullish Structure: A strong bounce could lead to higher highs, while failure to hold may invalidate the setup.
Will SOL confirm this bullish scenario? Let’s watch how it reacts! 📈🔥
Bitcoin - Bulls Take Control: Short term rally to $86K?Bitcoin has once again reacted to the $81,000 support level, bouncing from this key demand zone and showing signs of bullish momentum. The price is currently moving upwards, and the next logical target appears to be the $85,500 – $86,000 zone, where a Fair Value Gap (FVG) and the Fibonacci golden pocket align. This area is expected to act as a significant resistance level, meaning we could see a rejection from there, leading to another move back toward support.
The plan is to monitor the price as it approaches $86,000, watching for signs of a reversal or continued strength. If a rejection occurs, Bitcoin could make its way back toward $81,000 or lower, providing another potential buying opportunity.
Bitcoin’s Reaction to $81,000 – A Strong Demand Zone
Bitcoin has consistently found support at $81,000, and this level once again played a crucial role in preventing further downside. This area has been tested multiple times, reinforcing its importance in the current price action. Each time the price has dropped to this level, buyers have stepped in aggressively, causing strong rejections to the upside.
The latest bounce from this support level suggests that there is still demand in the market, at least for now. The presence of long wicks at this level indicates that sellers attempted to push the price lower, but buyers quickly absorbed the selling pressure, resulting in a reversal. This move aligns with the broader market structure, which suggests that Bitcoin is still ranging between support at $81,000 and resistance near $86,000.
Short-Term Target: Fair Value Gap (FVG) & Golden Pocket at $86,000
Now that Bitcoin has rebounded from support, the next major area of interest is the Fair Value Gap (FVG) and the golden pocket retracement zone around $85,500 – $86,000. This level is important for several reasons.
First, the golden pocket (0.618 – 0.65 Fibonacci retracement) is a common area where price reversals occur, especially after a significant move. It acts as a magnet for price action, drawing the market toward it before a potential rejection.
Second, the Fair Value Gap (FVG) represents an imbalance in price, meaning Bitcoin could aim to "fill" this gap before making its next major move. Gaps like these often get revisited before the market decides on a new trend direction.
Finally, liquidity is likely concentrated above $85,000, meaning stop losses from short positions could be triggered in this zone, leading to increased volatility. If Bitcoin reaches this level, traders should closely monitor how price reacts. A strong rejection could signal a move back down, while a clean breakthrough could indicate further upside potential.
Potential Rejection and Move Back to Support
Despite the short-term bullish outlook, there is a high probability that Bitcoin will face resistance near $86,000, leading to a pullback. If this rejection occurs, the price could once again retest the $81,000 support level. This would keep Bitcoin within a broader trading range and present another opportunity for buyers to step in.
A failure to hold $81,000 on the next test could open the door for a deeper correction toward $78,000 – $76,000, where more buyers might be waiting. However, as long as Bitcoin remains above the $81,000 mark, the market structure remains relatively stable.
Final Thoughts
Bitcoin is currently in a short-term bullish phase, with price targeting the $86,000 resistance zone. However, traders should be cautious as this level aligns with key technical factors such as the golden pocket, Fair Value Gap, and potential liquidity grab. A rejection from this area could lead to another move back down to support.
For now, the key levels to watch are $86,000 for a potential rejection and $81,000 for a potential retest. If Bitcoin breaks through resistance convincingly, we could see a more extended rally, but until then, the market remains within a defined range.
__________________________________________
Thanks for your support!
If you found this idea helpful or learned something new, drop a like 👍 and leave a comment, I’d love to hear your thoughts! 🚀

Cardano - Bullish Breakout! Can Bulls Finally Take Control? Cardano (ADA) has recently broken out of a prolonged bearish trend on the 4-hour chart, signaling a potential shift in market sentiment. This breakout suggests that bullish momentum could be building, paving the way for a move higher. The price action indicates that ADA may now target areas of confluence, where technical factors align to create significant levels of interest. The breakout itself is a strong indication that buyers are gaining control, pushing the price above previous resistance levels. This shift in momentum could be the start of a more substantial rally, especially if ADA continues to attract buyers as it moves higher.
The breakout from the bearish trend also marks a change in the broader market structure. Previously, ADA was confined within a downward trend, but now it appears to be transitioning into a more bullish phase. This transition is crucial for traders, as it presents opportunities for both short-term gains and longer-term investment strategies. As ADA moves higher, it will be important to monitor how it interacts with key technical levels, as these will provide insight into whether the breakout is sustainable or if it will be met with resistance.
Short-Term Target: Golden Pocket and Fair Value Gap
The next logical target for ADA is the golden pocket zone (0.618–0.65 Fibonacci retracement level), which coincides with a Fair Value Gap (FVG). This confluence creates a magnet for price action due to several reasons. The golden pocket is a key area where reversals or consolidations often occur after significant moves. It acts as a strong resistance level and is widely monitored by traders because it represents a point where price action tends to stabilize or reverse. Historically, the golden pocket has been a reliable indicator of potential price reversals, making it a critical area to watch for traders looking to capitalize on ADA's current momentum.
The Fair Value Gap (FVG) represents an imbalance in price caused by rapid movement, leaving untraded zones behind. Price tends to revisit these areas to "fill" the gap, making this level crucial for predicting future movements. Gaps like these often get revisited before the market decides on a new trend direction, which means that ADA's approach to this zone could be pivotal in determining its next major move. Additionally, liquidity is likely concentrated around this area, as stop-loss orders from short positions could be triggered here, leading to increased volatility. If ADA reaches this level, traders should closely monitor how price reacts. A strong rejection could signal a move back down, while a clean breakthrough could indicate further upside potential.
Potential Rejection and Support Levels
While the breakout is promising, there remains a high probability of resistance at the golden pocket and FVG zone. If ADA faces rejection here, it could retrace toward key support levels. The primary support zone, which has held firm during recent consolidation phases, will be crucial in determining whether ADA can maintain its bullish momentum. A retest of this area would provide another opportunity for buyers to step in, potentially leading to a continuation of the current trend.
In the event of a rejection, ADA might initially pull back to test its recent breakout levels. If this support holds, it would reinforce the idea that the breakout is legitimate and that ADA is poised for further gains. However, failure to hold these levels could open the door for ADA to drop toward secondary support zones. These areas, typically marked by previous lows or significant trading volumes, would be critical in preventing a deeper correction. If ADA fails to find support at these levels, it could signal a broader reversal in the market, potentially leading to a retest of lower support zones.
Final Thoughts
Cardano’s breakout from its bearish trend presents an exciting opportunity for traders. The golden pocket and FVG alignment around the target zone make it a critical area to watch. Traders should remain cautious as price approaches this resistance level, looking for signs of rejection or continued strength. Monitoring the price action closely will be essential in determining whether ADA has the momentum to push through resistance or if it will be forced back into a consolidation phase.
For now, the key levels to monitor include the resistance at the golden pocket/FVG zone and the support at recent breakout levels. A decisive breakout above resistance could signal further upside potential, while failure might keep ADA within its broader range structure. As ADA navigates these technical levels, traders should be prepared for increased volatility and potential trading opportunities. Whether ADA continues its ascent or faces a pullback, the current market conditions offer a compelling setup for traders looking to capitalize on the cryptocurrency's movements.
__________________________________________
Thanks for your support!
If you found this idea helpful or learned something new, drop a like 👍 and leave a comment, I’d love to hear your thoughts! 🚀
Make sure to follow me for more price action insights, free indicators, and trading strategies. Let’s grow and trade smarter together! 📈

XRP - Ascending Channel: Will bulls stay in control?XRP continues to trade within a well-established ascending channel on the 4-hour timeframe, maintaining a bullish structure as long as it respects this formation. The price has consistently formed higher highs and higher lows, signaling that buyers are still in control. However, recent price action suggests that XRP is at a critical decision point, with strong support below and short-term resistance above.
4H Timeframe – Golden Pocket and Imbalance Providing Strong Support
One of the key areas to watch is the golden pocket Fibonacci retracement level (0.618 - 0.65), which aligns with a 4-hour imbalance zone. This confluence has already provided two strong bounces, confirming that buyers are actively defending this area.
The golden pocket is a key retracement zone where price often finds strong support before continuing the trend. Additionally, the imbalance zone represents an area of unfilled liquidity, which price often revisits before resuming its move. The fact that XRP has reacted twice from this level suggests that it remains a critical demand zone.
As long as price remains above this level, the bullish structure is intact, and XRP could continue pushing higher within the ascending channel. The next target for bulls would be the 0.618 Fibonacci extension level, which aligns with the upper boundary of the channel.
However, if this support fails and XRP breaks below the golden pocket and imbalance zone, the structure could shift bearish, leading to a potential breakdown toward lower support levels.
1H Timeframe – Bearish Rejection from Imbalance Zone
While the 4-hour structure remains bullish, the 1-hour timeframe presents a short-term bearish case. Recently, XRP was rejected from a significant imbalance zone, suggesting that sellers are stepping in. This rejection indicates a potential short-term pullback before the next major move.
When price fails to break through an imbalance zone, it often signals that there isn’t enough liquidity to sustain the uptrend. This could lead to a retracement back to lower levels, possibly retesting the golden pocket on the 4H timeframe before another push higher.
Key Levels to Watch
Support Zone: Golden pocket (0.618 - 0.65) + 4H imbalance
Resistance Zone: 1H imbalance rejection area
Bullish Target: 0.618 Fibonacci extension, aligning with the upper boundary of the channel
Bearish Breakdown Level: A break below the golden pocket and imbalance could trigger a deeper retracement
Final Thoughts – Bullish Structure, but Short-Term Weakness
The 4H ascending channel remains intact, and the golden pocket support has held twice, indicating that the uptrend is still in play. However, the 1H bearish rejection from an imbalance zone suggests that XRP could face short-term weakness, leading to a possible retest of support before the next major move.
If XRP holds the golden pocket, the bullish bias remains strong, and we could see a continuation towards 2.80 – 2.90 in the coming sessions. However, if support fails, the structure could shift bearish, bringing lower retracement levels into play.
This setup presents both bullish and bearish scenarios, making it crucial to monitor key levels and wait for confirmation before making a trading decision.
__________________________________________
Thanks for your support!
If you found this idea helpful or learned something new, drop a like 👍 and leave a comment, I’d love to hear your thoughts! 🚀
Make sure to follow me for more price action insights, free indicators, and trading strategies. Let’s grow and trade smarter together! 📈

EURUSD - Will Bears Keep Pushing Lower?Overview of Market Structure
The EUR/USD pair has been experiencing strong bullish momentum over the past few weeks, leading to the creation of an extended bullish leg. However, as with most impulsive moves, the market has left behind imbalances—price inefficiencies where the market moved too quickly without sufficient pullbacks to ensure order fulfillment.
Recently, we have observed a break in bullish structure, signaling a potential shift in momentum. This break suggests that the market may now be in a phase where it seeks to rebalance inefficiencies before deciding its next directional move.
My expectation is that price will first retrace to fill the imbalance zone above, which acts as a supply area, before reversing and targeting the imbalance zones left behind in the bullish rally.
Key Resistance and Market Rejections
A crucial area in this setup is the strong resistance zone (marked in red), which has been rejected twice. Each time price attempted to break through, sellers stepped in, pushing price lower. This level serves as a significant supply zone where institutions may have unfilled sell orders.
With this in mind, the most logical movement for price would be to return to this area, collect liquidity, and then initiate a bearish move.
Imbalance Zones and Market Efficiency
Imbalance zones are areas on the chart where price has moved too quickly, leaving behind inefficiencies. These areas often get revisited later as price seeks to rebalance liquidity.
There are two key imbalance zones in this setup:
The imbalance zone above the current price (first target) – This is the area where price is expected to retrace before reversing.
The imbalance zone below the current price (final target) – Created during the rapid bullish rally, this area remains untested and is likely to be filled once bearish momentum takes over.
These zones are high-probability areas where price is expected to react due to unfulfilled institutional orders.
Break of Bullish Structure & Shift in Momentum
A key element of this trade idea is the break in bullish structure. This break was confirmed when a bearish candle closed below the previous higher low, invalidating the uptrend.
This structural shift suggests that bulls may be losing control, and a deeper retracement is likely before any potential continuation of the overall trend. The break also increases the probability of the lower imbalance zone getting filled before the market makes its next major move.
Trade Execution Plan
Step 1: Identify the Optimal Short Entry
Wait for price to fill the imbalance zone above.
Once confirmation is seen, a short position can be entered.
Step 2: Bearish Move to Lower Imbalance Zone
After rejection from the supply zone, expect price to break lower.
The target for this move will be the imbalance left behind in the bullish rally.
Trailing stop-loss can be used to maximize profits while reducing risk.
Why This Trade Has High Probability
Market Favors Liquidity Grabs – The imbalance zone above is a likely liquidity grab area before the bearish move.
Break in Market Structure – The recent bearish structure break increases the probability of downside continuation.
Historical Resistance Rejection – The resistance zone above has already rejected price twice, indicating strong selling pressure.
Imbalance Fill Below – Price tends to fill inefficiencies left behind in fast-moving markets, making the lower imbalance zone a logical target.
Risk Management Considerations
Stop-loss should be placed slightly above the imbalance zone above to protect against unexpected breakouts.
Take-profit should be set at the lower imbalance zone, allowing for a strong risk-to-reward ratio.
If price breaks past the resistance zone above without rejection, it would invalidate this bearish setup, signaling a reevaluation of market conditions.
Conclusion
This trade idea is based on a smart money concept (SMC) approach, focusing on liquidity grabs, imbalance fills, and structural shifts. If the market follows the expected path, we could see price first push up to fill the imbalance above, reject from that level, and then begin a bearish move to fill the imbalance left in the previous bullish rally.
By patiently waiting for price to reach key areas and confirming rejections, this trade setup provides a high-probability opportunity with a strong risk-to-reward ratio.
__________________________________________
Thanks for your support!
If you found this idea helpful or learned something new, drop a like 👍 and leave a comment, I’d love to hear your thoughts! 🚀
Make sure to follow me for more price action insights, free indicators, and trading strategies. Let’s grow and trade smarter together! 📈

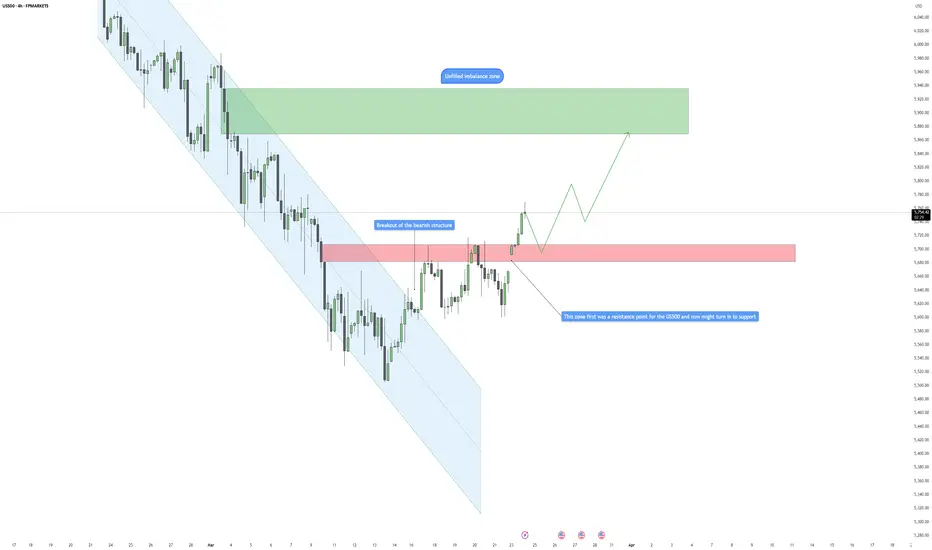
US500 - Are Bulls Setting Up for a Bullish Push?Overview of Market Structure
The US500 has been trading in a well-defined bearish channel for an extended period, continuously making lower highs and lower lows. This downtrend was respected until recently, when the price broke out of its bearish structure, signaling a potential shift in market sentiment.
Following the breakout, price also breached a key resistance level (marked in red), which had previously acted as a significant supply zone. Now that this resistance has been broken, it may flip into a support level, offering a high-probability area for a bullish continuation.
I expect price to retest this newly-formed support zone before continuing its move upward, targeting the unfilled imbalance zone above (highlighted in green).
Breakout of the Bearish Structure
One of the most important aspects of this setup is the confirmed breakout of the bearish structure. The market was respecting a descending channel, creating lower highs and lower lows. However, with this breakout, price is no longer following the previous downtrend pattern.
A breakout like this often leads to a shift in market direction, meaning buyers are now in control, and the next likely move is bullish continuation.
Resistance Break & Potential Support Retest
The red zone represents a major resistance level that has now been broken. This area had previously rejected price multiple times, showing that sellers were strongly defending it.
Now that price has successfully closed above this level, we can anticipate a retest of this area as new support before price resumes its move higher. This is a classic example of a resistance-turned-support flip, a key concept in technical analysis.
Imbalance Zones & Price Efficiency
An important part of this trade setup is the unfilled imbalance zone above. When price moves too quickly in one direction, it often creates gaps or inefficiencies in the market, which tend to get revisited later.
The unfilled imbalance zone above (highlighted in green) is a key target for this bullish move.
Price is likely to fill this inefficiency after confirming support at the previous resistance level.
Since price action tends to seek out liquidity and inefficiencies, this gives us a clear roadmap for the next likely movement in the market.
Why This Trade Has High Probability
Breakout of Bearish Structure – This suggests a potential shift from a downtrend to an uptrend.
Resistance Turned Support – A classic market structure retest that provides strong confluence for a bullish move.
Imbalance Fill – The market tends to fill inefficiencies left in impulsive moves, making the imbalance zone above a logical target.
Liquidity Grab Potential – Retesting the broken resistance could serve as a liquidity grab before price moves higher.
Conclusion
This setup provides a high-probability long opportunity based on a bearish structure breakout, resistance-turned-support retest, and imbalance fill target. If price follows the expected path, we should see a retest of the red zone before a bullish continuation into the imbalance zone above.
By patiently waiting for price confirmation at key levels, this trade offers a strong risk-to-reward ratio while aligning with smart money concepts and price efficiency principles.
__________________________________________
Thanks for your support!
If you found this idea helpful or learned something new, drop a like 👍 and leave a comment, I’d love to hear your thoughts! 🚀
Make sure to follow me for more price action insights, free indicators, and trading strategies. Let’s grow and trade smarter together! 📈
TRADE ASSESSMENT: March 23 EuroUSD - LOSSwhen price has made a sweep and is making higher highs on the 15min, look for 1hr FVGs to rebalance. that's your narrative. then look for context and entry. (POC+OTE+FVG)
when price has made a sweep and is making higher highs on the 15min, look for 1hr FVGs to rebalancewhen price has made a sweep and is making higher highs on the 15min, look for 1hr FVGs to rebalancewhen price has made a sweep and is making higher highs on the 15min, look for 1hr FVGs to rebalancewhen price has made a sweep and is making higher highs on the 15min, look for 1hr FVGs to rebalancewhen price has made a sweep and is making higher highs on the 15min, look for 1hr FVGs to rebalancewhen price has made a sweep and is making higher highs on the 15min, look for 1hr FVGs to rebalancewhen price has made a sweep and is making higher highs on the 15min, look for 1hr FVGs to rebalance
