EURUSD Interim Short Active, Looking for the LongInterim short active from our analysis posted last night, rejected off the lower end of the supply zone highlighted. Looking for the trade to trade down to a good Demand level to then take this trade up to the higher levels of the supply zone. Targeting the 1.1500 region. This will be all dependent on price action. If price moves to plan and 1.1500 is achieved we then can look for the original short position highlighted in last nights analysis.
Fvg

NASDAQ failed to capture hourly fair value gap multiple times.The US100 index failed to close a body above the hourly fair value gap multiple times. I would expect it to go towards sellside liquidity marked on the chart after multiple failed attempts at closing above an important level .

NASDAQ 100 Long up to 22,000 then shortLooking for the short around 22,000-22,1000 region. Only valid on bearish PA confirmation. Looking for that 1,500+ point downside move. Some target in between.

Bitcoin - Will the $100K Level Hold?Since reaching its all-time high (ATH) on May 22nd at an impressive $112,000, Bitcoin (BTC) has entered a corrective phase that has caught the attention of traders and analysts alike. After a strong and relentless move to the upside, such a phase is not uncommon in crypto markets, where rapid rallies are often followed by cooling-off periods. As of now, BTC is trading at around $101,000, marking a decline from its peak but still maintaining a significant portion of its recent gains. This retracement has not only been healthy in terms of price structure but also offers potential opportunities for those closely monitoring key technical levels.
4H FVG
One important aspect of the move leading up to the ATH was the formation of a 4H Fair Value Gap (FVG). These imbalances, left behind during aggressive moves in the market, are often revisited and filled as part of a broader effort by price to return to equilibrium. The current FVG spans from approximately $100,500 to $99,800. This range is especially noteworthy, as such gaps tend to act as magnets for price action, creating zones of potential support where buyers may step in to defend the structure. As BTC approaches this region, it's plausible to expect at least a temporary bounce, particularly if market sentiment remains constructive.
Golden Pocket Fibonacci
Adding further weight to this zone is the confluence of the Golden Pocket, the area between the 0.618 and 0.65 Fibonacci retracement levels, derived from the latest upward leg. This specific Fibonacci region is widely regarded in technical analysis as a high-probability reversal zone, often attracting significant buying interest. Interestingly, the Golden Pocket aligns almost perfectly with the aforementioned FVG, both residing in the $100,500 to $99,800 range. The overlapping of these two technical indicators strengthens the case for this area to act as a firm support level, or at the very least, a point where the ongoing correction could take a breather.
Conclusion
Taken together, the alignment of the 4H FVG and the Golden Pocket around the $100,000 mark creates a technically compelling scenario. The psychological impact of a round number like $100,000 only adds to its potential as a battleground between buyers and sellers. If this zone holds, it could spark a notable bounce, either a temporary relief rally or potentially the beginning of a renewed leg to the upside, depending on broader market conditions.
Thanks for your support.
- Make sure to follow me so you don't miss out on the next analysis!
- Drop a like and leave a comment!

Bitcoin - Reclaim or Reject? Key 4H FVG Levels in FocusAfter an extended move lower, Bitcoin has just swept the major 4H lows and immediately bounced back with strength. This aggressive reaction suggests the sweep was likely a liquidity grab rather than a continuation. Price is now trading back inside a large 4H fair value gap, which could serve as a short-term magnet while market participants reassess direction.
Key Price Reaction and Fair Value Gap Context
The current rebound into the 4H FVG is notable. This zone holds significance because it's the last inefficiency left unfilled before the final leg down. If buyers manage to push through and close above this imbalance, it would indicate a short-term reclaim and open the door to a bullish liquidity sweep higher. The clean highs just above are marked by the $$ label, which align with a key inducement zone and should attract price if bullish momentum sustains.
Upside Scenario – Targeting the Liquidity Sweep
If we do see a clean move and close above the fair value gap, I’ll be looking for price to extend toward the highs just above it. These highs are likely to be the next target for liquidity collection, especially if short-term traders begin chasing strength. However, I’m not expecting price to trade beyond that zone. There’s a protected high resting above, and unless a significant fundamental shift occurs, it’s unlikely we break that structure.
Downside Risk – Failure to Hold Could Lead to 99K
If the market fails to close above the FVG or quickly gets rejected on a wick into it, the bullish scenario becomes invalid. That would confirm the move back up was simply a retracement after the sweep, setting the stage for further downside continuation. In that case, I expect the market to break lower and move toward 99K, which remains my downside target under bearish conditions.
Conclusion
Bitcoin just swept key 4H lows and is now testing a large imbalance. A close above could trigger a run on the $$ liquidity, but I do not expect price to move beyond that due to the presence of protected highs. On the other hand, failure to break and hold above the FVG opens the door for a deeper flush toward 99K.
___________________________________
Thanks for your support!
If you found this idea helpful or learned something new, drop a like 👍 and leave a comment, I’d love to hear your thoughts! 🚀

EUR/USD - After taking the highs, are the lows next?The EUR/USD currency pair is moving between two important price levels. The top level is 1.1454 and the bottom level is 1.1357. This means the price is staying inside a range. Yesterday, the price of EUR/USD went above the top level of 1.1454. By doing this, it triggered many stop-loss orders from traders who were expecting the price to go down. These traders had placed their stop-losses just above this level, and the market moved up to take them out.
Current support of the 1H FVG
Now, the price is starting to go down again. It is getting closer to the lower level of the range, which is around 1.1357. There is a chance that the market will go below this level as well. If that happens, it may take out the stop-loss orders of traders who are expecting the price to go up. These traders often place their stop-losses just below the low point of the range. When the market goes below the low, it collects liquidity. In simple words, it grabs the orders that are waiting there.
Looking at the chart, we can see that EUR/USD has found some support at the 1-hour Fair Value Gap (1H FVG). This area is acting like a short-term floor for the price. If a full 1-hour candle closes below this support area, then the price will likely fall further. In that case, it may reach the bottom of the range and possibly move below it to take out more stop-losses.
Why below support?
But why would the market go below the low on purpose? The reason is that many retail traders, those are small traders who trade from home, often put their stop-losses just below the recent low. If the market moves there, it activates those stop-losses. These stop-losses are usually sell orders, and when they get triggered, it gives the market extra selling power. After collecting this liquidity, the market often uses the new buying interest (from other traders entering long positions) to push the price back up again.
Conclusion
So in summary, the EUR/USD is still inside a range. It has already moved above the top to take out stop-losses, and now it might go below the bottom to do the same. After that, there could be a strong move upward, powered by the new liquidity in the market.
Disclosure: I am part of Trade Nation's Influencer program and receive a monthly fee for using their TradingView charts in my analysis.
Thanks for your support.
- Make sure to follow me so you don't miss out on the next analysis!
- Drop a like and leave a comment!

XAUUSD Short idea for todayWe are now in an bearish imbalance in 4H TF and now looking for break of structure on m15 to validate the idea to short as per the chart, still waiting for confirmation in the form of break of structure or 15m imbalance.

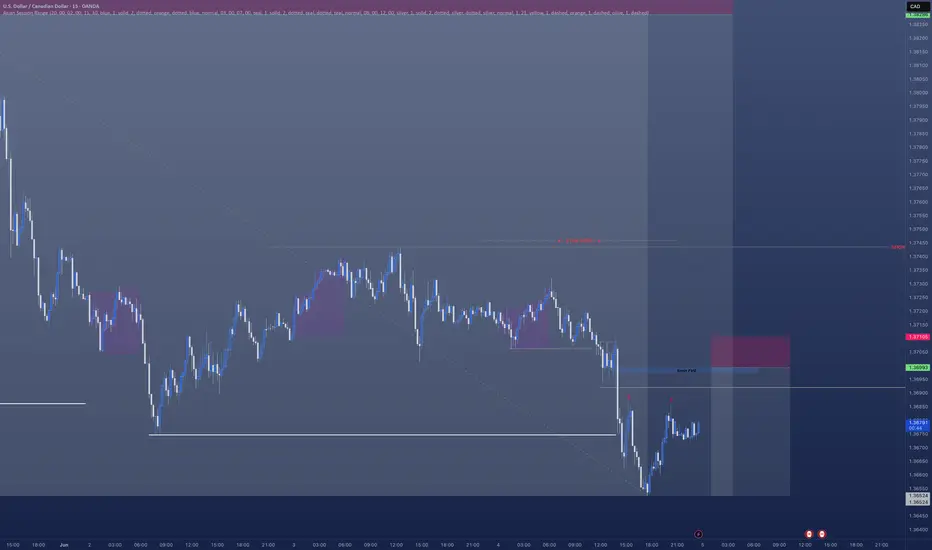
USDCAD - Short ContinuationHave a really nice short currently open on USDCAD
However I am looking to get a further position opened which come in the morning.
There's a clear break of structure.
- A nice FVG left behind.
- We are creating liquidity / inducement
- All pointing towards a nice further sell off in the morning.
Ideal situation is we sweep Asian session highs in the morning in the hope we move lower
EURUSD - Potential Bearish ContinuationEURUSD recently tapped into a 4-hour Fair Value Gap, aligning perfectly with a prior liquidity sweep just above the recent swing high. This zone acted as a magnet for buy-side liquidity, and price reacted sharply once that liquidity was taken out. The rejection confirms this area was used by larger players to offload positions rather than push higher.
Rejection and Structure Shift
After the sweep and tap into the FVG, we saw an immediate and aggressive bearish reaction, signaling a clear rejection of higher prices. Momentum flipped decisively, breaking smaller structural points on the way down. The rejection is not just technical, it’s reactive, showing that the intent was never to sustain the breakout.
Break of Support Zone and Bearish Setup
Price is now testing the critical mid-range structure marked in red. This zone previously held as support multiple times, but it is now under pressure. If we get a clean 4H close below this area, it confirms a market structure shift and opens the door for further downside.
Bearish Target and Liquidity Zone Below
If the break confirms, the next logical move would be a push down into the broader support area below. That zone holds untapped liquidity and marks the base of the recent rally. A sweep of those lows would align perfectly with the narrative of a failed breakout, followed by a deeper correction.
Conclusion
The rejection from the 4H Fair Value Gap, combined with a liquidity sweep and a pending structure break, builds a clean bearish case. A confirmed close below the marked zone would shift this into a continuation setup, with expectations for a move toward the lower support and a potential sweep of the lows.
Disclosure: I am part of Trade Nation's Influencer program and receive a monthly fee for using their TradingView charts in my analysis.
___________________________________
Thanks for your support!
If you found this idea helpful or learned something new, drop a like 👍 and leave a comment, I’d love to hear your thoughts! 🚀

BTC - Will BTC fill the 4H inbalance at $107.400Bitcoin (BTC) is currently exhibiting a clear downtrend on the 4-hour timeframe. During the most recent downward move, it left behind an imbalance, specifically, a 4-hour Fair Value Gap (FVG), which the price is now retracing toward. This area represents a potential zone of interest for entering a short position, given the prevailing bearish structure.
At the same time, BTC is approaching the golden pocket of the Fibonacci retracement, a level often watched by traders for potential reversals. This zone coincides with a former support level that provided multiple bounces in the past, but has now flipped into a potential resistance. The confluence of these factors could add significant selling pressure.
It’s important to note that BTC does not necessarily need to reach the imbalance zone to resume its downward movement. However, the presence of that FVG remains a relevant detail to monitor in case price action does continue higher before reversing.
Thanks for your support.
- Make sure to follow me so you don't miss out on the next analysis!
- Drop a like and leave a comment!

EUR/USD - Sweeping the highs, retracement following?The EUR/USD has experienced a steep and aggressive bullish run today, showing strong upward momentum across multiple timeframes. This impulsive move has led to a sweep of the recent highs, taking out key liquidity levels that were resting above previous swing points. In the context of smart money concepts and institutional trading models, such a move typically signifies the activation of buy-side liquidity, where stop-loss orders and breakout entries are triggered above a well-defined high. This behavior is often engineered by larger market participants to fulfill liquidity objectives before potentially reversing or retracing.
During this strong bullish leg, the EUR/USD left behind a noticeable imbalance, commonly referred to as a Fair Value Gap (FVG), on the lower timeframes. This imbalance reflects an area where price moved too rapidly, leaving behind unfilled orders and creating a price inefficiency. Specifically, an FVG remains open around the 1.13700 level, a zone that was bypassed during the impulsive rally and now stands as a likely magnet for price in the near term. These imbalances are significant because price tends to revisit them to seek equilibrium and fill in the inefficient areas, especially after a major liquidity grab.
The sweep of the highs was a classic liquidity-taking event. When price runs above a prominent high, especially one that's visible on higher timeframes like the 4H or daily, it often signals that buy stops (retail breakout entries or protective stops) have been targeted. Once these stops are taken, there is typically a shift in market behavior. The aggressive buyers have been filled, and institutional players may look to reverse or retrace price toward areas of unfilled orders, such as the aforementioned FVG. The market often transitions from a state of expansion (impulse move) to a state of rebalancing or consolidation, which opens the door for a pullback.
Given that the liquidity above the highs has been taken and that the 1.13700 gap remains unmitigated, it becomes increasingly likely that EUR/USD will begin a retracement. This corrective move would serve to rebalance the price, revisit the inefficiency, and potentially test the validity of any newly-formed demand zones. From a technical standpoint, this area is crucial, not only because of the gap itself but also due to its positioning in relation to prior market structure.
In summary, today’s bullish extension in EUR/USD accomplished a major liquidity objective by sweeping the highs. However, the move left behind a significant imbalance at 1.13700, suggesting that the pair could be due for a corrective pullback to fill the gap. Traders should monitor lower timeframes for signs of distribution, potential shifts in market structure, or bearish order blocks forming after the sweep. All of these could provide clues that the market is preparing to return to the gap and restore price efficiency.
Thanks for your support.
- Make sure to follow me so you don't miss out on the next analysis!
- Drop a like and leave a comment!

Bitcoin - Bears in control: Back to $103kPrice just swept the 1-hour and 4-hour swing highs, grabbing liquidity from anyone who had stops above the high. This was followed by an immediate and aggressive selloff, showing a clear bearish displacement. That move confirms smart money was unloading into retail longs, and we now have a shift in momentum pointing down.
Liquidity Sweep and Displacement Context
The sweep of the high was immediately followed by a strong bearish displacement. There was no hesitation after the breakout, which confirms this wasn’t a real breakout but a stop hunt. The reaction tells us that price was tapping into a key supply area or simply running out of buying interest above the high. This kind of rejection usually signals that smart money is positioning for a move lower.
Fair Value Gap and Pullback Zone
The drop left behind a clear 1-hour Fair Value Gap, sitting just below the swept high, between roughly $105,600 and $106,000. Price hasn’t returned to it yet, which opens the possibility for a short-term retracement back into that imbalance before continuation. That FVG becomes the main short entry zone, if price trades back into it, it’s likely to reject again.
Bearish Target and Market Structure Outlook
If we retrace into the FVG and reject, I expect a break of the recent short-term low around $104,300. That level will act as the first sign of bearish continuation. If that goes, there’s clean liquidity sitting below near the higher-timeframe low in the $103,600 zone. That’s the larger target for this setup, sweeping those lows would complete the move.
Conclusion
This is a clean high sweep followed by strong displacement and an unfilled FVG. If price trades back into that imbalance and shows rejection, I’m expecting continuation lower, with targets at $104,300 and ultimately down to $103,600.
___________________________________
Thanks for your support!
If you found this idea helpful or learned something new, drop a like 👍 and leave a comment, I’d love to hear your thoughts! 🚀

BITCOIN LONG TRADE IDEAI'm looking forward to buying BTC in this price level if I see a good bullish price action which confirm my trade idea.
Market structure on 4HR is currently bullish.
Looking at the monthly and weekly time frame, BTC is extremely bullish and it's clear that BTC is not done with it's bullish run.
I expect to see BTC give another good run to the 120k-150k price level

GOLD LONG IDEAGold has been extremely bullish in the last few months on higher time frame.
Monthly : Bullish
Weekly : Bullish
Daily: Bullish
4HR : Bullish
I will be buying this bullish trend retracement on 4HR time frame.
But I want to see a bullish price action before I enter the trade for long.
My overall target is the major high created in April.
My RR is 1:5.

USDCHF SELL IDEAUSDCHF is Ready to continue It's SELL Move to the higher time frame recent swing low of 0.803.
SELL IDEA BREAKDOWN;
Weekly is bearish and price is moving closer to the 0.803 swing low.
Daily is also bearish, price is moving towards the weekly swing low.
4HR had a bearish break in market structure, followed by a retest of the recent swing low that was broken by price to give MSS.
My entry was taken after the formation of a swing low and price is done retesting the old low.
This is a continuation trade.

USDJPY 4H Analysis – Market Dynamics ChangingDear Traders,
Guys, the bearish trend in USDJPY has now shifted into a bullish uptrend. My target level for USDJPY is 146.330. Once it reaches my target, I will share updates under this post.
Friends, every single like from you is my biggest source of motivation when it comes to sharing my analysis.
A huge thank you to everyone who supports me with their likes!

EURUSD - Bullish Continuation SetupEURUSD recently retraced into a key demand zone where a 4H Fair Value Gap (FVG) aligned perfectly with the golden pocket (between 61.8% and 65% Fibonacci levels). This confluence provided a high-probability setup for a bullish reaction. After testing this level, price rebounded sharply, confirming that buyers are still active and protecting discounted imbalances.
Imbalance Reaction and Demand Strength
The initial bounce from the 4H FVG was clean, with price quickly reclaiming structure and leaving behind a fresh series of upside imbalances. These newly formed gaps are now being respected on smaller retracements, showing that the market is still imbalanced to the upside and that buyers are stepping in early during pullbacks.
Bullish/Bearish Scenarios
As long as price continues to respect these imbalances, the short-term outlook remains bullish. The next major test lies at the resistance zone around 1.14000, which previously caused a sharp rejection. A minor reaction is expected there, but if the market maintains bullish momentum, we could see a clean break above that level. A failure to hold above the smaller imbalances near 1.12800 would be the first sign of weakness and could open the door for a deeper retracement back into the original 4H FVG.
Price Target and Expectations
If the current structure holds, I expect price to push into the 1.14000 resistance zone and eventually aim for the 1.15270 level as the next major liquidity target. The current price action shows a healthy series of higher highs and higher lows, supported by imbalances being filled and respected, suggesting further upside continuation.
Conclusion
EURUSD is showing clean bullish structure following a textbook reaction from the 4H imbalance and golden pocket zone. As long as the market continues to respect the newly formed imbalances, the path of least resistance remains to the upside. Eyes are now on the resistance zone for signs of either rejection or breakout continuation.
Disclosure: I am part of Trade Nation's Influencer program and receive a monthly fee for using their TradingView charts in my analysis.
___________________________________
Thanks for your support!
If you found this idea helpful or learned something new, drop a like 👍 and leave a comment, I’d love to hear your thoughts! 🚀

FVG, D1 Breaker, H4 OBit looks like Dogecoin might find some support at the current level. There are some relative equal highs near a internal range liquidity D1 fair value gap.

BTCUSD HTF cycle analysis
Hi, I’m from Phoenix FX, and today I’ll be sharing my perspective on Bitcoin (BTC) price action based on the higher timeframes.
I’ll also give you my outlook on potential trade setups for today and tomorrow. Please remember that this is not financial advice—use this information as a guide only. If you find it helpful, don’t forget to like and share it with your like-minded communities.
Higher Timeframe Analysis
In my view, BTC tends to follow clear bullish and bearish cycle zones. Typically, we see a pump to new all-time highs (ATH), followed by the formation of resistance and a retracement down to a key support level. Our trading approach focuses on identifying those critical support and resistance levels, with some interim trades based on shorter-term analysis—occasionally even counter-trend, depending on the day’s market bias.
Over the past eight years, BTC has respected a major trend resistance line. The most recent ATH, around $112K, reconfirmed the relevance of this trendline. This makes it a valuable tool for projecting future ATH levels.
Looking ahead, I expect a move towards the $115K level in the coming weeks. This would likely act as a point of resistance, at which stage we might see a reversal and a drop back down to a key support zone.
Trade Setup
The chart I'm referencing highlights what I would consider the first premium buy zone, identified using a 4-hour Fair Value Gap (FVG).
The 50% level of this zone sits at $99,450. If this zone fails to hold, we may drop further to the secondary premium buy zone, which aligns with our higher timeframe (HTF) trend support and a weekly FVG. The 50% level of this deeper zone is around $89,150.
A potential long entry at $92,550, with a stop loss around $88,000, offers an excellent risk-to-reward (RR) ratio, targeting a move up to the $115K level.
Intraday Outlook
For today, I see bearish price action, with potential rejection around the $104,300–$105,000 range. Go short around the $104,750 to $105,000 zone
This could lead to a move down toward the lower key zones highlighted in the HTF analysis.
I recommend taking partial profits (TP) at every $1,000 increment and setting your stop loss to breakeven (BE) after hitting the first target.
Final Thoughts
Price action analysis is always subjective, so I’d love to hear your thoughts and ideas in the comments—each one, teach one.
Thanks for giving me some of your time.
From the Phoenix FX team, have a great weekend!

BTC targets.Last level was broken down and retested on 1H.
Now we are on last swing VAH.
If will not hold - next targets are on the way to POC magnet (green lines one the chart)
They are middles of 12H FVGs.

Bitcoin - Will we go back to $99k?Bitcoin is showing its first real signs of weakness after an extended bullish run. The current price action around $106,700 suggests a loss of momentum, with price hovering just above a key daily low that could act as a pivot point. If this low gets taken out, it would likely mark a short-term shift in sentiment from bullish to bearish, opening the door for a deeper retracement toward key inefficiency zones that remain unfilled.
Consolidation and Liquidity Structure
After the sharp breakout in early May, price rallied aggressively with minimal pullbacks, leaving behind several imbalance zones that now act as downside magnets. The previous range high around $99,000, which acted as a strong resistance level earlier this year, has not yet been properly retested. This area aligns with a large daily imbalance, making it a highly probable target in the event of a breakdown. Currently, price is consolidating just above this previous resistance-turned-support zone, and pressure is building.
Bearish Breakdown Potential
If the current daily low breaks, it would likely trigger a flush into the $99,000 to $95,000 range, where we find that unfilled imbalance waiting to be closed. A break and acceptance below the $99,000 level could suggest deeper trouble for the bulls. In that case, the next major downside target sits around $92,000, where an even larger inefficiency from earlier in the year remains open. This level also coincides with a significant accumulation zone that could provide the next strong base of support if the market continues correcting.
Bullish Recovery Conditions
On the flip side, if Bitcoin holds this low and finds demand stepping in at current levels, we could see a local bottom form. A recovery and push back toward $108,000 or even a reattempt of the $112,000 highs would be back on the table. But for this bullish case to stay alive, the current daily low must hold. A sweep and reclaim could trap late sellers and fuel a quick reversal. However, right now, the pressure is clearly leaning to the downside unless buyers show strong intent soon.
Imbalance Zones and Key Price Areas
The most critical area to watch is the $99,000 level. It’s the confluence of an old resistance, an unfilled imbalance, and psychological round number support. If price tags this zone, we’ll need to monitor reaction closely. Weakness below $99,000 opens the door to $92,000, which is where the next higher timeframe imbalance sits. If we start accepting below $92,000, that would confirm a much more extended corrective phase is underway.
Price Target and Expectations
The primary expectation is a move into the $99,000 imbalance zone, assuming we get a clean daily low break. A bounce there would offer the first chance for a bullish reaction, but if sellers dominate, $92,000 becomes the secondary and more extreme downside target. A reclaim of $108,000 would invalidate this short-term bearish thesis and shift the focus back toward the highs.
Conclusion
All eyes are on the daily low. A clean break below it would change the tone of this market and likely initiate a short-term bearish cycle, targeting inefficiencies left behind during the rally. $99,000 is the key zone to watch first. If it holds, bulls may step back in. If not, $92,000 becomes the next target in line. For now, caution is warranted as the risk of deeper downside continues to grow.
___________________________________
Thanks for your support!
If you found this idea helpful or learned something new, drop a like 👍 and leave a comment, I’d love to hear your thoughts! 🚀

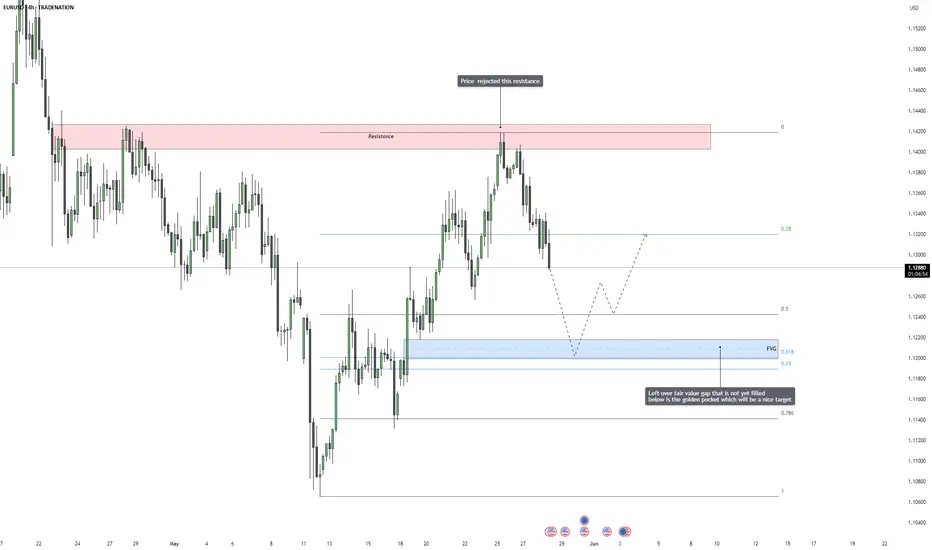
EURUSD – Bearish Reversal in Motion, Fair Value Gap Draws Price EURUSD has recently reacted strongly to a major resistance zone, where price previously stalled and reversed in the past. After running into this area again, we saw a sharp and immediate rejection, which confirms the presence of aggressive selling pressure. This rejection was not just a weak pullback, but a strong displacement candle that shows real intent from institutional participants.
This kind of price action is typically a sign that the market has found a short-term top, and will now look to rebalance lower, especially if there are inefficiencies left behind during the last move up. With the rejection now confirmed and price starting to rotate lower, the odds increase that we see a deeper retracement in the coming sessions.
Resistance Reaction and Liquidity Story
The price reached into a well-defined supply area and rejected cleanly. This level was likely filled with buy-side liquidity from breakout traders and late longs, which institutions needed in order to fill their sell orders. After sweeping above the previous highs and triggering breakout entries, price snapped back below, creating a shift in short-term structure.
That move also created a market imbalance, a price inefficiency that the market tends to come back and correct. With bullish liquidity absorbed at the highs, price is now looking for sell-side liquidity, which can typically be found below the previous higher lows and inside unfilled value areas.
Fair Value Gap and Fibonacci Confluence
Below the current market, we have a clean fair value gap that was left behind during the most recent impulsive bullish move. What makes this area even more attractive is that it overlaps perfectly with the golden pocket zone, the 0.618 to 0.65 Fibonacci retracement level. This confluence creates a high-probability target area, not just because of the imbalance, but also because this level acts as a common retracement zone where institutional traders often look to reaccumulate or exit short-term positions.
This area is also likely to hold resting liquidity from traders who placed stop losses under recent higher lows. All these factors combined make the fair value gap plus golden pocket area a natural draw for price, the market tends to gravitate toward these zones when there’s unfinished business left behind.
Expectations and Potential Development
Going forward, I expect price to continue bleeding lower in a controlled fashion, possibly forming minor lower highs along the way. Once the fair value gap is reached and filled, we could see signs of support or accumulation, depending on the context at the time. It’s important not to blindly long from that area, but instead wait for a market reaction, ideally a shift in structure on the lower timeframes, to signal that buyers are stepping back in.
If the market holds that area and confirms support, it could launch a new leg higher. However, if the fair value gap fails and price continues to break down, it would signal that this move is not just a retracement but possibly the start of a larger bearish leg.
Conclusion
The rejection from resistance has opened the door for a deeper retracement. With a clear fair value gap and Fibonacci golden pocket below, the market now has a logical destination to correct toward. This level offers a clean narrative for continuation lower, and it aligns with both price action structure and algorithmic models. Patience is key now, the best opportunities come when price delivers into clean zones like this one.
Disclosure: I am part of Trade Nation's Influencer program and receive a monthly fee for using their TradingView charts in my analysis.
___________________________________
Thanks for your support!
If you found this idea helpful or learned something new, drop a like 👍 and leave a comment, I’d love to hear your thoughts! 🚀
NQM2025 outlook for the week ahead 05/19/2025Hello World.
for the week ahead i have a bullish bias im looking to target the bearish fvg created on mon 24 feb 2025 ( daily TF) i expect the fvg formed on tue 13may2025 (Daily TF) reject the price higher, if the bullish fvg didnt hold maybe we will se a drop to the V.I bellow.
i will give updates
