what is fair value gap ? what is fair value gap ?
-This Analysis is based on educational purposes using the concepts of Smart Money and Liquidity Sweep area
- We create two fair Value gaps in which market will act on that
first one is between 3247 to 3260 area expecting move down from that point and touched 3192 to 3165 which is a strong liquidity zone
Fvg

ETH - Consolidating before a major breakout!About a week ago, Ethereum (ETH) saw a strong upward move, pushing the price up with notable momentum. Since then, it has entered a period of consolidation, trading within a tight range as the market awaits the next decisive move.
-------------------------------
Which Direction Will ETH Break?
After such a strong rally, this kind of consolidation is normal. It could signal a continuation to the upside, especially if this is part of a broader relief rally. However, it's important to note that during the rapid move up, ETH left behind a 4h Fair Value Gap (FVG), which may attract price back down for a potential fill in the event of a breakdown.
-------------------------------
Stochastic RSI insight
On the daily chart, the Stochastic RSI remains in the overbought zone. Historically, when this indicator lingers in such territory, ETH has seen notable pullbacks. This could be an early sign that a downward move is more likely unless momentum changes soon.
-------------------------------
ETH vs. the 50-Day Moving Average
ETH is currently struggling with the 50-day Moving Average (MA), trading just below this key resistance level. As long as ETH remains under the 50-day MA, bearish pressure could continue. However, a reclaim and sustained hold above this level would likely indicate a shift toward bullish momentum.
-------------------------------
My Outlook
This range is tricky to trade, and a breakout in either direction is possible. Personally, I think there's a chance ETH could sweep the recent highs before a larger move down. The overbought Stochastic RSI and resistance at the 50-day MA both suggest that the rally might be losing steam in the short term.
-------------------------------
Thanks for your support.
- Make sure to follow me so you don't miss out on the next analysis!
- Drop a like and leave a comment!
US100 – Bullish Continuation Setting Up Inside the ChannelUS100 remains firmly bullish, showing consistent strength after breaking out from the prior consolidation range in mid-April. Price action has been moving cleanly within a well-defined ascending channel, supported by strong impulsive moves followed by shallow retracements. Each pullback so far has been relatively controlled, and buyers have been stepping in aggressively from clearly defined zones, which aligns with the current risk-on sentiment across tech-heavy indices.
Consolidation Structure
We’ve now had two solid retests of prior fair value gaps (FVGs), both of which acted as demand zones and helped fuel continuation. The first pullback dropped into a previously formed imbalance, consolidated briefly, and then launched a strong bullish leg. The second did the same, creating a layered structure of bullish continuation through efficient retracements. Each of these reactions confirms that price is respecting areas where institutional orders may have been left behind, which adds confluence to the trend’s strength.
Currently, price is working on forming a third FVG within the upper half of the channel. This is developing just below recent highs and has not yet been retested, which makes it a key area of interest. If the market pulls back into that imbalance with proper structure, it could offer the next high-probability opportunity to join the trend.
Bullish Scenario
If price retraces into this newly forming FVG and holds, especially with a wick or lower timeframe rejection candle inside the zone, it could mark the start of the next impulse. The overall trend remains intact as long as we stay within the channel and each FVG continues to serve as valid support. Given the strength of the previous bounces and the orderly nature of this structure, any retest into this new FVG would likely lead to another push into fresh highs and a move toward the upper boundary of the channel.
Bearish Scenario
On the flip side, if price fails to respect this new FVG and breaks below with momentum, especially if the channel support fails at the same time, it would be a sign that buyers are losing control. In that case, we’d want to see how price interacts with the last confirmed FVG below before making any bearish assumptions. A deeper pullback into that area could still provide another long opportunity if structure holds, but any sharp momentum break through both imbalances would put the bullish trend on pause and shift focus to downside levels.
Price Target and Expectations
Assuming the bullish structure continues to play out, the next projected move would be a clean rally toward the top of the channel. There’s enough space left between current levels and the upper trendline to justify an entry on the next pullback, provided it lands inside the newly created FVG. The setup is fairly straightforward, let price come back into the imbalance, confirm with lower timeframe strength, and ride the continuation leg.
Current Stance
There’s no need to chase price here. The best scenario is waiting for a patient retest of the fresh FVG forming now. If it pulls back cleanly, holds the zone, and gives confirmation, that would be the entry. Momentum, structure, and market context are all aligned for continuation, but the trade needs to be built off a level that shows actual commitment from buyers.
Conclusion
US100 is holding its bullish structure well, forming clean legs within an ascending channel, and repeatedly respecting fair value gaps as demand zones. With a new imbalance forming beneath the most recent high, the setup is shaping up for another continuation play if price rotates back and holds. It’s a wait-and-see moment for now, but if the FVG gets tagged and buyers show up, this could be the next leg higher in an already strong trend.
___________________________________
Thanks for your support!
If you found this idea helpful or learned something new, drop a like 👍 and leave a comment, I’d love to hear your thoughts! 🚀
Make sure to follow me for more price action insights, free indicators, and trading strategies. Let’s grow and trade smarter together! 📈

"XAUUSD Double Setup After Massive Manipulation! 200+ Pips"🚨 Gold (XAUUSD) Smart Money Play Unfolding!
Here's a clean breakdown of the current structure and why this could be a high probability setup:
🔥 First, notice the manipulation zone — classic Smart Money move where liquidity was grabbed aggressively before a shift in market structure. This sets the stage for a bigger play.
📉 Change of Character (ChoCh) confirmed after the sweep, showing clear intent for price to reverse. This is the first signal that buyers are losing control and sellers are stepping in.
📍 First Key Area: Fair Value Gap (FVG)
Price is now retracing into the FVG.
This is our 1st Entry Setup opportunity.
High R/R setup if rejection happens around this level.
📍 Second Key Area: Order Block (OB)
A stronger zone for deeper mitigation.
If price pushes through the FVG, this OB becomes a prime entry spot.
This is the 2nd Setup for another potential short entry.
🏹 Targets and Pip Count:
Immediate target zone offers around 211 pips from the first setup.
Deeper target from second setup offers up to 253 pips move.
🧠 Market Structure & Psychology:
After manipulation, Smart Money always seeks to rebalance inefficiencies (FVG) and mitigate institutional orders (OB).
Weak lows created will likely be swept to fuel the bigger move down.
Multiple liquidity pools above and below current price hint at another round of liquidity hunting.
⚡ Game Plan:
Monitor price action reaction around FVG for short triggers.
If broken, reposition entries at the OB zone.
🚀 Risk Management Reminder:
Always use calculated risk per trade.
Don't chase; let price come to your zone.
Protect capital first, then maximize profits.
✍️ In summary:
This setup shows classic Smart Money Concepts in action: manipulation, structure shift, FVG, OB mitigation — all aligning for a clean bearish move. If executed with patience, this could be one of the smoothest setups of the week!
➡️ Comment "GOLD READY" if you’re stalking this setup with me!
➡️ Tag your trading buddy who needs to see this!

"BTCUSD | FVG + Order Block Alignment | High Probability Play"⚡ BTCUSD Analysis - 1H Timeframe | April 28, 2025
📊 Price Action Breakdown:
BTC printed a textbook liquidity sweep earlier today, tapping into the Discount Zone perfectly.
Now, the market is pushing up into a high-probability reaction zone where Fair Value Gap overlaps with an Order Block.
🔥 Confluences:
Fair Value Gap (FVG) = Imbalance zone needing filling.
Order Block = Institutional demand/supply where Smart Money left a footprint.
Fibonacci 79% retracement = Sweet retracement level for low-risk entries.
🧠 Why It's Exciting:
The more confluences, the more Smart Money interest.
Price is currently kissing the edge of the FVG, teasing a deeper tap into the OB. This overlap stacks probability heavily for a reaction — either a quick scalp rejection or a full-on move downward.
🎯 Potential Play:
Entry: Inside the FVG or deep into the Order Block for premium entries.
Stop Loss: Just above the Strong High (~94,629) to avoid wicks.
Targets:
Partial at 50% retracement for safer players 🛡️
Full send toward Weak Low zone (~92,839) for maximum RRR hunters 🏹
💬 Pro Tip:
"Always let price show its hand first. Don’t assume, confirm."
🚀 Summary:
✅ Liquidity swept
✅ FVG + OB stacked
✅ 79% Fib lining up
✅ Smart Money trap possibly setting
🧘♂️ Play it with patience. The sniper eats last... but he eats the most.
✍️ Save this chart, tag your trading buddy, and prepare to strike when the premium entry triggers!
➡️ Comment "SETUP LOADING" if you’re stalking this with me!
➡️ Share this with someone who’s tired of guessing entries.

Bitcoin - Repeating History: 100k Next Target?Bitcoin is continuing to move with clean structure, driven by demand imbalances and breakout continuation setups. After the initial breakout from the mid-April range, price moved in a highly technical fashion, consolidating, breaking out, forming a fair value gap, and then retesting it before continuation. That exact structure looks like it's playing out again. Bitcoin just broke out of another multi-day consolidation and left behind a fresh 4h imbalance, suggesting the potential for another leg higher if it respects that zone on a pullback.
Consolidation Structure
The prior breakout came from a tight range just below $86,000. BTC spent several days compressing in that area, then broke out impulsively, creating a 4h FVG and retesting it cleanly. That retest held perfectly and launched a rally of nearly $10,000.
The current setup is structurally the same. BTC spent 8 days consolidating under $95,000, repeatedly testing the resistance without breaking it. It finally closed decisively above, leaving behind another fair value gap. The sequence is familiar, sideways accumulation, breakout, FVG left behind, and now a setup for retest.
Bullish/Bearish Scenarios
The bullish scenario is centered on a retest of the new 4h FVG, located between roughly $94,200 and $95,000. If price pulls back into that imbalance and buyers defend it, the setup for continuation is clean. Based on recent behavior, a successful retest here could easily carry BTC toward the $100,000 level.
If price instead breaks back below $94,000 and falls into the previous consolidation range, that invalidates the breakout structure. In that case, Bitcoin could either enter another range-bound phase or trap longs with a deviation. That would shift the focus to reassessing structure instead of chasing continuation.
Price Target and Expectations
The short-term upside target is $100,000. That level is both a psychological milestone and a likely liquidity magnet. From a structural perspective, it aligns with the last breakout leg, which moved over $9,000 after a similar retest setup. If buyers defend the FVG, there is not much in the way until $100,000.
The momentum behind the breakout supports that expectation. The move was impulsive, clear, and not showing signs of exhaustion. As long as structure holds, price is in a strong position to continue toward that key round number level.
Current Stance
This setup is not a breakout chase, it’s a retest setup. The breakout already happened, and the market left behind a fair value gap that now needs to be tested. If price pulls into the $94K to $95K zone and reacts strongly, that would confirm demand. That’s the moment to step in, with invalidation placed below the FVG and former resistance.
Until then, it's about staying patient and letting price come to the key level. The structure is clear, the plan is defined, and there’s no need to force a trade in the middle of the range.
Conclusion
Bitcoin looks like it’s repeating the exact same structure we saw earlier this month. Range, breakout, FVG, retest, that sequence played out before and led to a major leg higher. It’s playing out again now with nearly identical timing and behavior.
If the 4h imbalance holds, the next phase of this rally likely targets $100,000. The structure is clean, the behavior is technical, and there’s no reason to overcomplicate it. Let price do its thing, wait for the retest, and if the reaction is strong, follow the same playbook that’s already worked once this month.
___________________________________
Thanks for your support!
If you found this idea helpful or learned something new, drop a like 👍 and leave a comment, I’d love to hear your thoughts! 🚀
Make sure to follow me for more price action insights, free indicators, and trading strategies. Let’s grow and trade smarter together! 📈

EURUSD - CONSOLIDATION TO MANIPULATION?OANDA:EURUSD is currently going through consolidation on daily time frame, i expect price to manipulate a little by taking out the relatively equal lows below to tap into the weekly and daily fair value gap below around 1.12000 price level as illustrated in the chart attached.
Overall, my bias on EURUSD still remain bullish until the weekly time frame shift market structure to bearish.
Monthly bullish, weekly bullish, now I will wait for daily to correct and turn bullish back for me to take a trade.

Bitcoin - Gearing Up for a Break Above Key ResistanceBitcoin has been grinding just below a key resistance zone, marked clearly around the 95,400–95,800 region. This area has seen multiple rejections in the past, making it a strong level where sellers are actively defending. Despite this, the broader trend structure remains intact to the upside, with price respecting a higher-timeframe ascending trendline and forming higher lows.
Consolidation Structure
Current price action shows a range developing just under resistance, with signs of weakening bullish momentum in the short term. We’ve had multiple wicks into the highs, but no convincing close above. On the flip side, there’s a visible support zone around 93,000–93,800, which has previously been used to absorb liquidity and fuel moves higher. This zone is confluenced by the ascending trendline from previous swing lows, offering a clear area for a liquidity sweep.
Bullish/Bearish Scenarios
In the short term, a pullback into the green support block looks likely. This would serve two purposes: sweep out late longs and provide fresh liquidity for a stronger bullish push. A dip into this level that still respects the trendline would maintain bullish structure despite violating the local higher low.
If price holds this zone and begins forming higher lows again, we could see an impulsive move into and possibly through the resistance. A clean break and close above 95,800 would likely open the door for much higher prices, as the level has capped upside multiple times and a breakout would likely trigger stop orders and breakout buying.
Failure to hold the green zone and the trendline, however, would break the short-term bullish structure and increase the probability of a deeper retracement, possibly invalidating the breakout thesis temporarily.
Price Target and Expectations
If the resistance breaks, the path toward 105,000 remains in play. That target aligns with the macro breakout structure and continuation from the trendline, supported by higher timeframe bullish sentiment.
What do do now
Watching for a pullback into 93,000–93,800 to see if liquidity is swept and support holds. No interest in chasing price into resistance. The key is to see how price reacts at the next low and then again at 95,800. If the pullback unfolds and buyers step in with momentum, that would provide the cleanest long opportunity into new highs.
Conclusion
The market looks poised for a short-term dip to rebalance liquidity before mounting a serious attempt to break a long-standing resistance zone. As long as the trendline is respected, the bullish structure is intact, and any sweep of local lows may offer a strong risk-reward entry for continuation toward 105k.
___________________________________
Thanks for your support!
If you found this idea helpful or learned something new, drop a like 👍 and leave a comment, I’d love to hear your thoughts! 🚀
Make sure to follow me for more price action insights, free indicators, and trading strategies. Let’s grow and trade smarter together! 📈

Bitcoin - Major Daily Imbalance and Possible Move to $105k?Bitcoin already broke out of the bearish structure a while back, and honestly, that was the first major shift everyone should have been paying attention to. Ever since that breakout, we have been building bullish structure on the higher timeframes, higher highs, higher lows, and overall strong momentum to the upside. This gave the bulls a clear advantage, and so far, nothing has really changed that bigger picture.
Consolidation Structure
Now, looking at the current price action, something important stands out. During the last big push up, Bitcoin left behind a massive daily imbalance zone. It is way too big to just leave open like that. Markets hate inefficiencies, especially ones of that size, and more often than not, these kinds of imbalance zones get filled at some point.
Because of that, I am fully expecting price to come down, revisit this imbalance area, and fill it properly before making any serious move higher. It is a natural thing for the market to do, clean up inefficiencies, grab liquidity, and then continue the main trend if the structure holds.
Bullish/Bearish Scenarios
The most important thing to watch here is how Bitcoin reacts once it gets into the imbalance zone. If we dip into it and then start seeing bullish reactions, I will be looking for confirmation that the bullish structure is still intact. Specifically, if we can avoid a daily candle close below the bottom of that imbalance, the bullish case remains valid.
However, if we get a full daily close below the imbalance, that would be a strong warning sign. That would tell me that the bulls lost control and we could be looking at deeper downside or a shift back into bearish conditions.
But as long as that does not happen, I am still looking for the market to respect the structure. A dip into the imbalance, hold, and then continuation higher, that is the ideal scenario.
Price Target and Expectations
If we get the reaction I am looking for after filling the imbalance, I think Bitcoin has a real shot at rallying towards $105,000. That level lines up perfectly with a strong resistance area on the chart, and it would make sense for price to reach for it if the momentum stays bullish.
Now, reaching $105,000 will not be easy. That is going to be a major test for the market. There will likely be heavy selling pressure around there. But if the trend stays strong and we keep putting in bullish structures even as we approach that resistance, it is definitely possible to break through eventually.
Current Stance
Right now, I am being patient. I am not chasing the current move higher. I am waiting for price to come back down into the imbalance zone. If we get a proper retest and hold, that is where I will be looking for my entries, targeting the move towards $105,000.
No daily close below the imbalance zone = bullish continuation plan still in play,
Daily close below = reassess everything and possibly step aside.
Conclusion
To sum it up, Bitcoin already shifted bullish a while ago with the structure break. Now it is just about cleaning up the inefficiencies it left behind during the move up. If the market does what it usually does, fill the imbalance and maintain bullish structure, then the setup towards $105,000 is very much alive.
Patience is key here. Let the market come to us. No need to force anything.
___________________________________
Thanks for your support!
If you found this idea helpful or learned something new, drop a like 👍 and leave a comment, I’d love to hear your thoughts! 🚀
Make sure to follow me for more price action insights, free indicators, and trading strategies. Let’s grow and trade smarter together! 📈

GBP/USD - Watch out for a possible rejection!The British pound is currently moving towards the upside, showing a gradual but steady climb. However, it is approaching a significant resistance area that could pose a challenge to further gains.
-------------------------------
Double top
This resistance zone was previously a strong support level before the market formed a double top pattern and subsequently broke below it. As is often the case in technical analysis, this former support has now flipped into resistance, making it a key area where price could face strong selling pressure and potential rejection.
-------------------------------
1h FVG
Adding to the confluence, this resistance zone aligns closely with a 1h Fair Value Gap (FVG). FVGs often attract price back into them before a reaction occurs, making this area even more significant for a potential reversal.
-------------------------------
Golden Pocket
Just below the FVG lies the "Golden Pocket", the 61.8% Fibonacci retracement level from the most recent drawdown. The Golden Pocket is one of the most closely watched Fibonacci levels by traders and is known for its strong influence on price action. Its proximity to the current structure increases the likelihood of a notable reaction, as many market participants will be watching this area closely for signs of rejection.
-------------------------------
Conclusion
Overall, the combination of previous support-turned-resistance, the 1-hour FVG, and the Golden Pocket retracement forms a high-probability zone where the British pound could encounter heavy resistance and a potential downside move.
-------------------------------
Thanks for your support.
- Make sure to follow me so you don't miss out on the next analysis!
- Drop a like and leave a comment!

Stromm | SOLANA Key Zones for Next MovesWe've seen a very solid reaction here — similar to Bitcoin, but still with its own flavor.
The Previous Monthly Low was swept and then reclaimed, which is always a strong bullish signal.
On top of that, the Monthly Open was reclaimed and successfully retested, flipping market structure back to bullish.
No doubt: the trend right now leans upward.
The big question is: where do we go from here?
When you look left on the chart, you see two massive candles:
One day, +30% straight up,
Followed by -22% the very next day.
Pure chaos.
Now, price is pushing back into that zone — and we need to watch how it reacts inside those previous candles.
For targets:
The Weekly Fair Value Gap near the Previous Monthly High is a major zone to watch.
After that, there’s the 2h Fair Value Gap around the Yearly Open — the next big magnet for price.
And it’s worth noting:
Compared to Ethereum, Solana’s Yearly Open is way closer and much more realistically within reach. Another subtle hint that SOL is showing way better relative strength.

XRP - Bulls Preparing to Push Towards $2.50XRP has maintained a bullish tone after completing a significant gap fill, currently consolidating around $2.18. The previous impulsive move left behind an unmitigated imbalance below, suggesting that the market could be preparing for a controlled retracement. The overall structure remains bullish, but a corrective dip into key demand zones would align with healthy price development before the next leg higher.
Imbalance Structure and Retest Expectation
During the rally from the sub-$2.00 range, XRP formed a sharp move that created an inefficiency between approximately $2.05 and $2.12. This gap between buyers and sellers indicates that liquidity was left behind, often acting as a magnet for price.
Currently, XRP appears to be positioning itself to retest this imbalance, refilling orders and potentially gathering the momentum needed for a stronger continuation. I expect price to sweep into this zone, likely finding responsive buyers as it rebalances the inefficiency and revisits previous structural points of interest.
Reaction Zone and Bullish Confirmation
The primary area of interest lies firmly within the $2.05 to $2.12 range. A reaction from this zone, confirmed by strong bullish price action such as a higher low formation or a bullish engulfing candle, would validate the setup for further upside.
Following the retracement and bounce, the immediate objective will be a clean break above the $2.30 resistance. This level has acted as a cap on recent price action and represents a key liquidity threshold. A decisive move through this resistance would open the path toward higher targets, confirming the strength of the new impulsive phase.
Upside Target Projection
My upside target for this trade idea is located at $2.47. This level coincides with a previous high and clusters near the upper boundary of visible supply zones on the higher timeframes. Reaching this target would represent a continuation of the broader bullish structure while also completing a logical expansion leg relative to the recent price range.
Risk Management and Invalidation
The bullish bias remains valid as long as XRP holds above the lower boundary of the imbalance zone, around $2.05. A sustained breakdown below this level, particularly if accompanied by strong bearish momentum, would invalidate the idea, signaling that a deeper retracement is unfolding.
Until such invalidation occurs, the approach remains to monitor the retracement into the key demand zone and assess the strength of the subsequent reaction for potential long entries.
Conclusion
XRP is showing strong structural signs of bullish continuation but may first revisit the unfilled imbalance below. A clean reaction from this zone, followed by a break above $2.30, would likely set the stage for a rally into the $2.47 target. Patience is key in awaiting the retest and confirming bullish intent before execution.
___________________________________
Thanks for your support!
If you found this idea helpful or learned something new, drop a like 👍 and leave a comment, I’d love to hear your thoughts! 🚀
Make sure to follow me for more price action insights, free indicators, and trading strategies. Let’s grow and trade smarter together! 📈

Bitcoin - Trap the Breakouts, Ride the PullbackBitcoin has been trading in a clearly impulsive structure, showing bullish intent after reclaiming previous consolidation zones. Recently, price action has driven into a significant area of interest, approaching the highs set on the 4-hour timeframe. These highs have not yet been swept, making them a likely target for liquidity grabs. Given the market's recent strength, it's reasonable to anticipate that market makers and larger participants may aim to run these stops to fuel a deeper retracement or set the stage for further upside.
The higher timeframes continue to favor bullish structure overall, with price making higher highs and higher lows. However, within this bullish context, the market has left behind notable inefficiencies, particularly an untapped imbalance zone just below current price levels. These inefficiencies typically act as magnets, especially when preceded by strong directional moves, making them key zones of interest for potential pullbacks.
Consolidation Structure and Key Zones
After bottoming out near the $77,000 to $78,000 area in early April, Bitcoin has steadily climbed, forming intermediate accumulation structures and minor consolidations before each breakout leg. During the recent surge, price left behind a unified imbalance zone roughly between $89,000 and $91,000, which remains untouched. This area is highly relevant, as price has not yet returned to rebalance it.
Just below that sits a previous strong support zone in the $82,000 to $84,000 region, which provided a solid base for the current leg higher. An additional lower imbalance zone lies slightly above $80,000, offering a potential secondary demand area in case the primary zone fails.
Liquidity and Imbalance Zone
The current expectation is for Bitcoin to complete a sweep of the 4H swing high, tapping into the resting buy stops above. These types of moves often serve as traps for breakout buyers, allowing institutions to offload positions into demand and prepare for a retracement. Once the liquidity is taken, the next logical move would be a return toward the unfilled imbalance zone highlighted on the chart.
This zone not only represents technical inefficiency, but also aligns with the concept of fair value. Price often returns to these areas to find willing buyers, rebalance supply-demand discrepancies, and establish a base before continuing in the prevailing direction. Given the strength of the previous rally, a healthy retracement into this zone would still maintain overall bullish market structure.
Bullish Scenario
If the price sweeps the high and retraces into the $89,000 to $91,000 zone, we want to see signs of absorption and bullish structure forming within this region. Confirmation may come in the form of bullish order blocks, internal BOS (break of structure), or a clear rejection wick indicating buyers are stepping in. Should these conditions be met, this zone provides a compelling long opportunity, with upside targets set toward previous highs and potential extension levels above $96,000.
Bearish Contingency Plan
In the event that the unified imbalance fails to hold, attention shifts to the next key zones. The first is the minor imbalance closer to $85,000, which could offer a short-term bounce. Failing that, the broader support zone at $83,000 highlighted on the chart, becomes a more significant area to watch. This zone previously acted as the springboard for the current rally and may provide the structural support necessary for a larger bullish continuation.
Conclusion
This setup reflects a classic smart money concept, liquidity engineering followed by a return to inefficiency. The trade idea rests on the premise that markets rarely move in a straight line and often seek to rebalance themselves after aggressive trends. By allowing price to sweep the highs, fill the imbalance, and re-establish support, we can position ourselves with the trend in a favorable risk-reward context. The bias remains bullish, but execution depends on price reaction at key levels and confirmation of intent.
__________________________________________
Thanks for your support!
If you found this idea helpful or learned something new, drop a like 👍 and leave a comment, I’d love to hear your thoughts! 🚀
Make sure to follow me for more price action insights, free indicators, and trading strategies. Let’s grow and trade smarter together! 📈

What is ICT FVG ? – ICT Fair Value Gap Explained Step by Step !ICT FVG knowns as Fair Value Gap, is a three-candle formation having an un-retraced area between the high and low of 1st and 3rd candlestick.
A fair value gap is indicated by an imbalance and it acts as a level of support and resistance in the price chart.
This blog post will teach you all about the ICT FVG from their formation to identification and their use in trading.
You can jump to the section you are most interested in from below or can continue reading the whole article for better understanding.
Table of Contents
What is ICT FVG (Fair Value Gap)?
How to Identify an ICT Fair Value Gap?
Types of ICT FVG
(I) Bullish Fair Value Gap
(II) Bearish Fair Value Gap
ICT FVG Trading Strategy
Best Time Frame for ICT FVG Identification
Best Pair for ICT FVG Trading
Final Thoughts
What is ICT FVG (Fair Value Gap)?
ICT fair value gap is a three-candle structure indicating a gap between the high and low of 1st and 3rd candlestick.
The gap between three candles is created because price does not retrace in that area and leaves it open.
You can see the example of ICT FVG in the picture below :
ICT FVG acts as a magnet for price and price retrace back to the fair value gap to balance the price delivery.
After retracing to the FVG price then reverses and continues its trend .
How to Identify an ICT Fair Value Gap ?
To identify an ICT FVG, you need to look for a large candlestick with most body range.
After identifying the large candlestick, mark the high of candlestick prior to the large candle and low of the subsequent candlestick .
There will be a visible gap between the high and low of the two candlesticks which indicate the ICT fair value gap .
Types of ICT FVG
On the basis of price move the ICT FVG has two types which are explained below :
(I) Bullish Fair Value Gap
A bullish fair value gap in ICT terms appears during an uptrend with a three-candle pattern.
It happens when the middle candle has a large body , leaving a gap between the high of the first candle and the low of the third candle .
In an uptrend , a fair value gap can serve as strong support, with the price often retracing to fill the gap before moving higher .
You can see the example of bullish fair value gap in the picture below :
(II) Bearish Fair Value Gap
A bearish fair value gap appears in a downtrend within a three-candle pattern.
It forms when the middle candle has a large body, creating a gap between the low of the first candle and the high of the third candle .
In bearish trend a fair value gap can act as a good resistance and mostly price tends to fill this gap before moving lower .
You can see the example of bearish fair value gap in the picture below .
ICT FVG Trading Strategy
To trade using an ICT fair value gap, you need to go through below steps.
Step 1 – Determine Market Trend: First of all we need to identify the market trend of any asset whether it is bullish or bearish.
You can use ICT Daily Bias to anticipate the direction of price move.
In bullish trend price makes higher highs and higher lows, while in bearish trend price makes lower lows and lower highs
Step 2 – Identify Premium and Discount Zone: You would be looking for the premium fair value gap in bearish trend, while in bullish trend you would be looking for discount FVG.
Step 3 – Identify Large Candle:Once you have determined the trend, next step is to find a large candle with large body & small wicks.
If market is in bullish trend, we look for strong bullish candle with most body range while in bearish trend we look for large bearish candle with most body range.
Step 4 – Study Preceding & Proceeding Candles: Once you have identified one large candle, now study the one candle before it & the one candle after it.
Both of these candles should have such a structure that their bodies should not overlap the body of middle candle thus confirming a fair value gap between the wicks of first & third candle.
Step 4 – Mark Fair Value Gap: In bullish trend the gap between the high of first candle and the low of third candle.
While in bearish trend the gap between the low of first candle and the high of third candle will be marked as your fair value gap.
Step 6 – Execute the Trade: If the price is in bullish trend, we will wait for price to retrace and test the discount fair value gap to balance the move.
When price tests the discount fair value gap you can execute a buy trade with other technical confirmations like rejection or structure shift in lower time frame.
In the picture given below you can see price is in bullish trend making higher highs and higher lows.
It retraces back to test the fair value gaps and rejects from the fair value gaps, eventually going higher.
In a bearish trend, you would wait for the price to retrace up and test the premium fair value gap to balance the bearish price delivery.
When the price visits this gap, it can offer sell opportunities, especially when combined with additional confirmations like rejection or a shift in market structure.
In the image below, the market is in a downtrend, forming lower highs and lower lows.
It repeatedly tests bearish fair value gaps and rejects from these levels, leading to further price declines.
Best Time Frame for ICT FVG Identification
ICT FVG can serve different purpose, like it can be used as a tool to find the Daily Bias using higher timeframe like 1-Day.
But if you are using the fair value gap as a PD Array to find trade entry then you would be looking for a fair value gap in lower timeframes like 15-Minutes or lower than that.
Best Pair for ICT FVG Trading
Initially the ICT introduced the fair value gap using the index trading like Nasdaq and S&P-500 and it yielded best results in that market.
After that he demonstrated some examples of forex pairs using the FVG and it was equally good for that market too.
So, now a days ICT FVG serve as a key tool for traders in every market.
Final Thoughts
While trading using a fair value gap we should keep in mind that every fair value gap in the market is not tradeable , to trade using fair value gap, we should use it in conjugation with other strategies like demand & supply or support & resistance . At these levels fair value gaps can act as a more reliable tool to take a trade.
You can also check this article how traders use fair value gap to open the right trade.
Plus to mitigate your risks, you should always trade with stop loss in place as no strategy is foolproof in trading.

Trading EURUSD AUDUSD NZDUSD | Judas Swing Strategy 22/04/2025We've executed 4 trades so far this week using the Judas Swing Strategy and in this write up, we're breaking down exactly how each one played out. We didn't get any trading opportunities on Monday but Tuesday gave us textbook setups on both FX:EURUSD and OANDA:AUDUSD , and if you’ve been following this series, you know the Judas Swing Strategy thrives where liquidity lies and manipulation gives way to opportunity.
Tuesday’s price action on FX:EURUSD opened with familiar signs: ranging structure and liquidity building on both sides. By 09:05 EST, price made the typical fakeout a sharp move to the downside that swept the lows and trapped breakout sellers.
This gave us confirmation to look for the real move, the reversal.
Price broke structure to the upside, creating a Fair Value Gap. As expected, price retraced into that imbalance, and we executed the buy.
Entry: 1.14677
SL: 1.14559
TP: 1.14913
Take profit was cleanly hit with minimal drawdown. No stress. No second-guessing
OANDA:AUDUSD printed a similar setup. The fake move to the downside swept liquidity below an earlier low and shifted structure to the upside. We entered buy once price returned to fill the Fair Value Gap
The trade nearly hit TP but reversed just shy of it, eventually stopping us out.
Entry: 0.63868
SL: 0.63770
TP: 0.64064
It stung a little, but here's where our data-driven edge comes in. We follow a set-and-forget execution model because our backtesting shows that this approach works more in our favor than not. Situations like this will happen. Sometimes price dances around your TP before flipping. It’s part of trading
The next day was a solid one using the Judas Swing strategy, this time across both OANDA:AUDUSD and $NZDUSD. Let’s walk through how the setups unfolded on Wednesday and why both trades played out almost identically in terms of narrative and structure.
The session kicked off with a consolidation forming, setting up a clean range to be targeted. Liquidity had built up nicely above the highs and lows of the pre-market structure. Classic.
As expected, once our session started, price punched higher, sweeping the buy-side liquidity above the early session range. This was our Judas move a strategic fakeout to trigger breakout longs and inject liquidity.
But the key here is what came next.
Price immediately stalled after the sweep and printed a clean break of structure to the downside. That shift was our clue that the buy-side move was done and the real selloff was likely on deck for OANDA:AUDUSD and $NZDUSD.
Price pulled back into the Fair Value Gap (FVG) formed during displacement, giving us a clean entry setup:
Entry: 0.64130
SL: 0.64360
TP: 0.63669
As soon as we entered, the trade moved with conviction minimal drawdown and a smooth ride into target but the OANDA:NZDUSD couldn't hit TP and the trade is still running

GBPUSD AnalysisGBP could potentially start its next bearish leg from the current level.
Price has reacted off a lower timeframe IFVG, which is currently acting as support.
If we get a clean close below this IFVG, along with proper short confirmation,
I'll be looking for bearish setups to target lower levels

Bullish BiasPrice broke above the minor resistance at ~189.50 and appears to pull back to OB for a bullish continuation toward the next significant resistance zone (~195).

EUR/USDPrice is currently reacting off a 4H FVG and retracing towards the 50% level of the last bearish move.
I'm anticipating a continuation down to the weekly FVG, waiting for a 15min bearish confirmation to enter.
Target: Weekly FVG
Waiting for: 15min entry confirmation

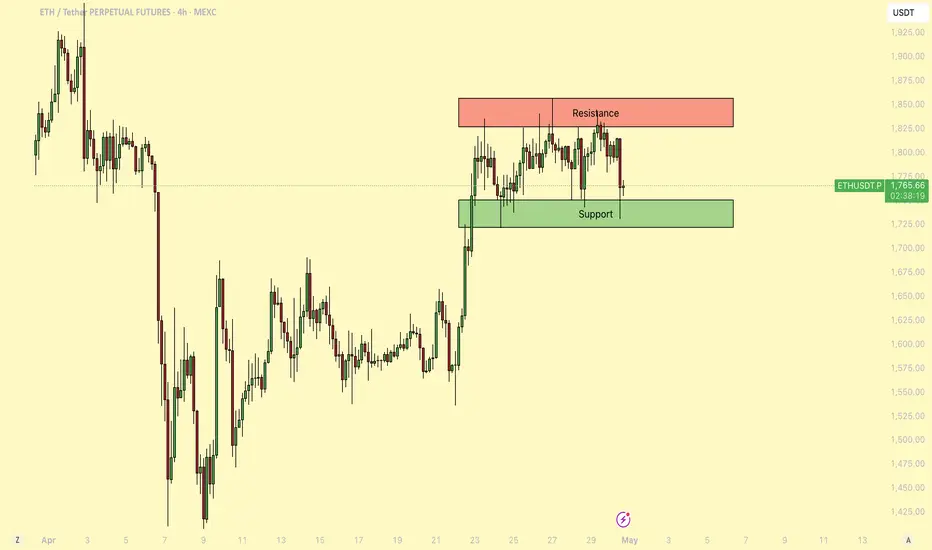
Ethereum Hits Critical Resistance — Is a Drop to $1400 Next?Introduction
Ethereum has been in a sustained downtrend over the past weeks, struggling to gain any real bullish traction. After a sharp decline last Sunday, the market remains under pressure, and although we’ve seen short-term attempts to recover, the broader trend still points downward. Technical indicators and price structure suggest this may not be over, with both Fibonacci levels and momentum oscillators hinting at further downside potential.
Resistance from the FVG and Fibonacci
Last Sunday, Ethereum dropped over 10% in a single move, forming a large 4-hour Fair Value Gap (FVG) in the process. This gap signaled a strong imbalance between buyers and sellers, with sellers clearly in control. Earlier this week, ETH managed to retrace up to the 50% level of that FVG but faced immediate rejection, highlighting the strength of the resistance. Currently, price is once again moving into the FVG zone and has reached the golden pocket Fibonacci level between $1650 and $1664. This area often acts as a key pivot for price direction. If bulls manage to break through, the next logical target would be the 0.786 Fibonacci retracement at $1724, potentially completing the fill of the FVG.
Stochastic RSI weakening on the daily timeframe
While the short-term price action shows some bullish effort, the daily Stochastic RSI tells a different story. It has now almost entered the overbought zone, suggesting that Ethereum’s current upward move may be running out of steam. This indicator often precedes a shift in momentum, and if history repeats itself, we could soon see bears stepping back in. With ETH still unable to break recent highs, the setup favors a continuation of the downtrend. If selling pressure resumes, we could be looking at a move down to the $1400 level, or potentially even lower.
Thanks for your support.
- Make sure to follow me so you don't miss out on the next analysis!
- Drop a like and leave a comment!

Gold - Why a drop to 3250 could be the perfect buy!Gold has been in a strong and sustained uptrend, showing impressive momentum with minimal pullbacks along the way. At the moment, Gold is forming a rising wedge pattern, which could indicate potential short-term downside price action. If we see a retracement from current levels, I’ll be watching closely for a long opportunity.
A break below this rising wedge would suggest possible short-term downside movement. This would actually be healthy for the overall trend, as small pullbacks are a natural and necessary part of a strong uptrend. It helps shake out weak hands, reset indicators, and build stronger support for the next leg higher.
Why a drop to around 3250?
If the wedge breaks, there’s an imbalance zone (4h FVG) sitting just below the current price level that has yet to be filled. These imbalance zones are created when price moves sharply in one direction, leaving gaps in the market structure. These areas often act as magnets, drawing price back to fill them before the trend resumes.
This particular imbalance zone lines up perfectly with the golden pocket Fibonacci retracement, adding further significance to the level as a strong area of support for the bulls. When technical confluences align like this, they tend to become high-probability reaction zones.
It’s also worth noting that this was the last major high that was broken before Gold made its most recent move upward. That makes this level even more likely to be defended by buyers. Bulls who missed the initial breakout will be watching this level closely for entries.
What are we watching for?
If Gold fails to hold the structure of the rising wedge, it opens the door for a sharper pullback towards the 3250 zone. This level aligns with multiple key confluences: the support zone, the 4h FVG, and the golden pocket. All of these factors together make it a prime level to look for bullish setups.
Conclusion
Gold remains in a strong uptrend but is starting to show early signs of a potential short-term pullback if it loses the rising wedge structure. Should that happen, the primary target for downside would be the 3250 level. This is where I’ll be looking for long opportunities, as it aligns with major support, the 4h imbalance zone, and the golden pocket retracement.
While this pullback would be short-term in nature, the broader trend remains bullish. As long as key levels hold and market structure stays intact, the bigger picture favors further upside. A healthy retracement here could set the stage for a more sustainable and explosive next leg up.
Thanks for your support.
- Make sure to follow me so you don't miss out on the next analysis!
- Drop a like and leave a comment!

Bitcoin – Testing Major Resistance: 95k next target?Bitcoin is currently trading inside a significant resistance zone between $88,000 and $89,000. This area has acted as a strong supply zone in the past, evidenced by multiple rejections that led to notable sell-offs. The recent upward momentum that brought price back into this area was backed by a strong rally off the April lows, pushing through local structure and recovering critical levels. However, despite the strength of this move, price is now approaching a decision point where bulls need to prove continuation capacity or risk triggering another corrective leg.
Consolidation Structure
The current structure reflects a potential accumulation base forming below resistance, marked by a series of higher lows and a compression of volatility. This typically precedes a breakout, though it also heightens the risk of a sharp rejection should buyers fail to sustain pressure. The local trend remains bullish on the 4H timeframe, but the lack of follow-through above resistance so far suggests hesitation. Price is essentially coiling beneath a ceiling, building pressure for a breakout or breakdown move in the coming sessions.
Bullish Scenario
If Bitcoin is able to cleanly break above the $89,000 resistance level, the key confirmation will be a successful retest of this zone from above. This area, once flipped into support, would offer a strong launchpad for continuation toward the next key target at $95,000. This target aligns with the measured move projection from the recent range and also represents a psychological milestone that may attract momentum buyers. A confirmed breakout and retest would signal strength from bulls and invalidate the prior resistance structure, transitioning it into new support.
Bearish Scenario
Alternatively, if price fails to break above the resistance zone and prints another rejection, I expect a retracement to follow. The first major area of interest on the downside is the imbalance zone between approximately $84,000 and $85,500. This level also aligns with the 0.236 Fibonacci retracement, and given the inefficiency left behind from the recent rally, it serves as a logical short-term support area. A bounce here would not be surprising, particularly on the first touch. However, should price break below and close beneath this zone, it would indicate weakness and open the door for a deeper corrective move.
The next major downside target in that case would be the golden pocket between $79,500 and $80,500. This zone carries strong confluence: it’s formed by the 0.618–0.65 Fibonacci retracement, a previously unfilled price void (PVG), and the base of the recent rally. Price reaching this area would likely attract interest from both buyers looking for re-entry and shorts looking to cover. A reaction from this level could set the stage for a medium-term bounce or even a new accumulation phase.
Current Stance
At the moment, my stance is neutral-to-bullish while price remains within the resistance zone. I'm closely monitoring for a clean breakout and retest, which would trigger a long setup targeting the $95K area. Until that breakout occurs, caution is warranted due to the risk of rejection and retracement. If price breaks down from the current level, I will shift my focus to lower support zones, particularly the imbalance region and the golden pocket, for potential long opportunities or further confirmation of bearish momentum.
Conclusion
Bitcoin is at a pivotal point technically. The structure and momentum suggest the possibility of a bullish continuation, but confirmation through breakout and retest is essential. A failure to break and hold above resistance will likely initiate a retracement, with the imbalance zone serving as the first major test. If that zone fails, a trip toward the golden pocket at $80K becomes increasingly probable. This is a reactive zone-to-zone environment, and both breakout and breakdown scenarios offer actionable setups based on confirmation.
__________________________________________
Thanks for your support!
If you found this idea helpful or learned something new, drop a like 👍 and leave a comment, I’d love to hear your thoughts! 🚀
Make sure to follow me for more price action insights, free indicators, and trading strategies. Let’s grow and trade smarter together! 📈

DXY - soon to the longWe are currently withdrawing liquidity that has accumulated over a couple of years and will go to close the gaps at the top
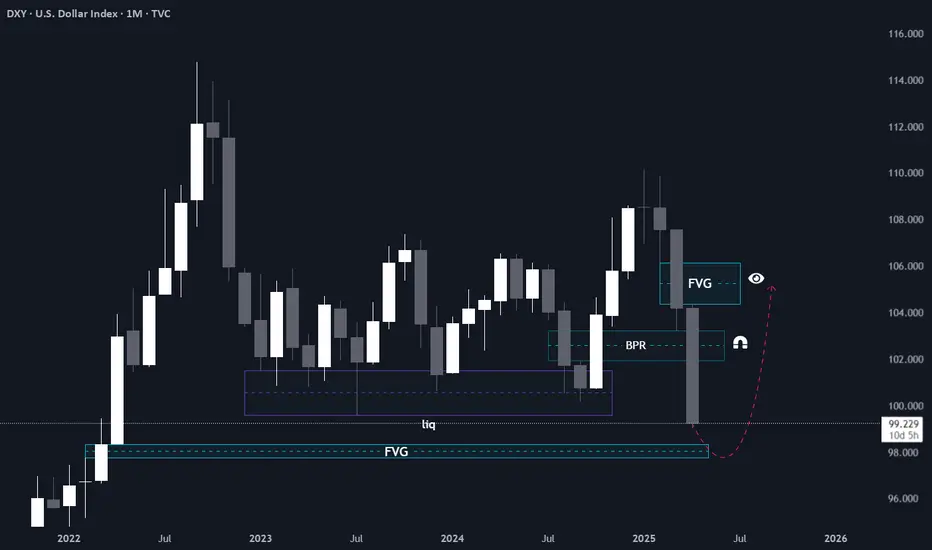
DXY - Monthly - ShortWe have reached the FVG Monthly, which we have been striving for more than two years.
