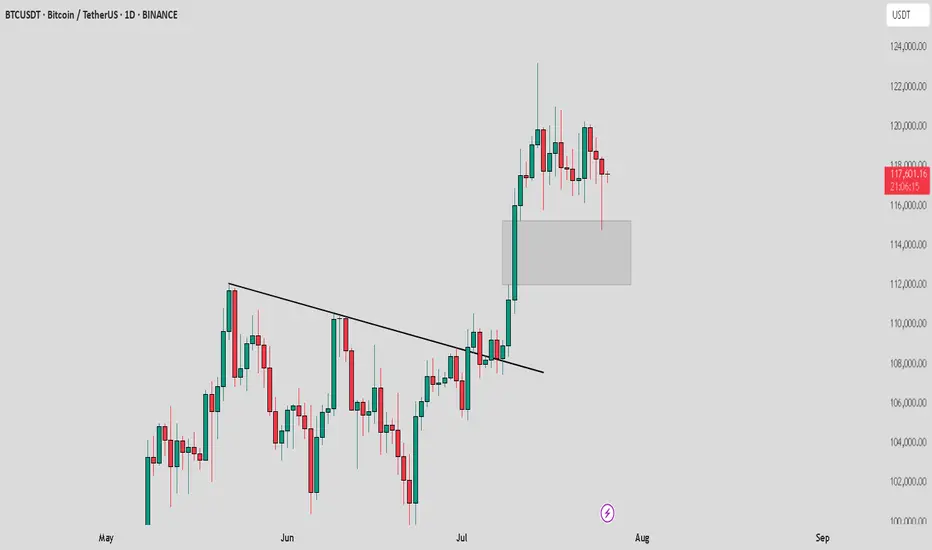
BTC /USDT : Getting support from FVG BTC Support from FVG - Bullish & Bearish Scenarios:
Bullish Scenario:
BTC is holding support from the FVG. As long as BTC stays above this zone, the market remains bullish. A bounce here could lead to further upside.
Bearish Scenario:
If BTC breaks below the FVG, it signals a potential downtrend. A breakdown may lead to more pain and further declines in the market.
Tips:
1. Wait for Confirmation: Look for a clear candle close above/below FVG for validation.
2. Risk Management: Set stops near the FVG to manage potential losses.
3. Monitor Volume: Strong volume during support retests increases bullish potential.
4. Stay Flexible: Be prepared for a market shift if BTC breaks the FVG support.
Fvg_strategy
XAUUSD H1 BUYING SETUPScenario:
Gold is showing strong buying momentum 📈. The best entry points are around the H1 FVG (Fair Value Gap) and Order Block (OB) zones. Wait for confirmation signals in either of these areas.
Gold could take off 🚀 from the FVG or OB. Once you see confirmation in any of these zones, take the entry ✅.
Use a small lot size and follow strict risk management rules ⚠️💰.
Stay disciplined and trade smart! 🧠📊

XAUUSD Technical Analysis – Resistance Turned Support, 📈 XAUUSD Technical Analysis – Resistance Turned Support, Bullish Continuation Expected
Gold (XAUUSD) has shown strong bullish momentum after breaking above the key resistance zone around $3,400, which now appears to be acting as a new support level. This structure shift signals a classic break-and-retest scenario, commonly observed in bullish continuations.
🔍 Key Observations:
Structure Shift: Previous resistance near $3,400 has been broken with strong bullish candles, suggesting buyer dominance. This level is now expected to serve as support.
Bullish Momentum: The move from the $3,320 support zone to above $3,430 was accompanied by clear trend formation and clean market structure, indicating sustained momentum.
Retest in Progress: Price is currently pulling back toward the new support zone ($3,400). If this area holds, a bullish reaction is expected.
Next Target: If support at $3,400 holds as expected, price could rally back toward the next resistance and projected target of $3,460.
📚 Educational Insight:
This setup illustrates the principle of resistance becoming support (RBS)—a foundational concept in technical analysis. After a breakout, a successful retest of former resistance often provides a high-probability entry point for trend continuation trades.

USDJPY Correction Complete, Is the Bullish Trend Back in play?After pulling back from the recent high near 149.17, USDJPY has shown signs of strength again, rebounding off the confluence support at the ascending trendline. The bullish narrative is supported by a hawkish FOMC tone and news that a U.S. federal court temporarily blocked Trump-era tariffs. The pair now awaits upcoming U.S. economic data for further directional clarity.
🔍 Technical Outlook – Structure & Momentum
✅ Primary trend: Bullish
✅ Correction phase: Completed near CP zone and trendline
✅ Key structural areas: FVG Zone, CP Zone, and trendline remain intact
Price has responded positively from the CP Zone + OBS Buy Zone around 147.438, aligning with the uptrend line. As long as this structure holds, buyers may push the market toward the next resistance zones.
🧭 Trade Scenarios
🔸 Bullish Bias (preferred scenario):
As long as price holds above 147.438, we expect continuation toward the FVG zone, with immediate targets at the GAP + OBS Sell Zone (148.703) and extended potential to the Buy-side Liquidity zone at 149.122.
A clean breakout above 149.122 opens the door to Fibonacci extensions: 149.72 and 150.05.
🔹 Bearish Scenario (if invalidated):
If price breaks below 147.438 and loses the trendline, we may see a deeper drop toward the Liquidity Buy Zone at 146.825, where strong buying interest is expected to re-enter the market.
⚠️ Macro Risk Drivers
Hawkish FOMC minutes continue to support USD strength
Paused trade tariffs reduce political headwinds, improving risk sentiment
Upcoming U.S. economic data could trigger sharp intraday moves → watch closely
📌 Key Price Zones
Liquidity Buy Zone 146.825 Major long re-entry zone
CP + OBS Buy Zone 147.438 Current active support
FVG Zone 148.20 – 148.68 Intraday bullish target
GAP + OBS Sell Zone 148.703 Short-term resistance
Buy-side Liquidity Zone 149.122 Final bullish objective
💬 Structure remains bullish unless the trendline breaks. Stay patient, wait for confirmations at key zones, and follow your plan with disciplined risk management.

BITCOIN current and past FAIR VALUE GAPS -Watch for the future ?An explanation of what a FAIR VALUE GAP ( FVG) is at the end of this post.
The stand out for me here is simply how almost EVERY Fair Value Gap ( FVG) gets filled in every cycle. There are very few FVG from the 2017 to 2021 ctcle and only one from 2013 to 2017.
The question I now pose to myself is what will happen this time ? Because things are very different.
The potential for a return to the 50K area is Very real should we go back into a BEAR.
But to enter a Bear, we need the corporations to sell up..
Will they ?
We have to wait and see
Fair Value Gap
A fair value gap (FVG) is a price range on a chart where an imbalance exists between buyers and sellers, often resulting from sudden and strong price movements that leave a void where little or no trading took place.
These gaps occur when there is a significant difference between buy and sell orders, indicating an imbalance that can influence market prices.
Traders use FVGs to identify market imbalances and inefficiencies, which can present potential trading opportunities.
Definition: A fair value gap is a price range on a chart where an imbalance exists between buyers and sellers, often resulting from sudden and strong price movements that leave a void where little or no trading took place.
Formation: FVGs occur when buying or selling pressure leads to significant price movements, leaving behind gaps on price charts. These gaps can be identified through technical analysis involving the analysis of candlestick patterns and price chart patterns.
Types: Traders can categorize FVGs into two types: Undervalued FVGs, where prices are lower than fair value, and Overrated FVGs, where prices are higher.
Identification: FVGs are typically identified through a three-candle pattern on a price chart. The first and third candles serve as barriers, while the middle candle is the largest, creating a gap between the wicks of the first and third candles.
Trading Strategy: The fair value gap trading strategy involves identifying price gaps, waiting for the price to return to the gap, and executing trades based on the expectation that the price will resume its original trend. This approach requires a disciplined risk management plan.

XAUUSD M30 BEST BUYING SETUP FOR TODAY📈 Scenario:
Gold is currently in a strong bullish trend, making this one of the best buying setups for today. ✅
We have confirmations across 3 timeframes:
🔹 4H FVG
🔹 1H OB
🔹 30M FVG & OB
🎯 Entry Zone: 3355–3357 (with candlestick confirmation)
📌 Take the trade with confidence but always follow strict risk management 🛡️
💡 Remember: Trade smart, not just fast. 🧠💸

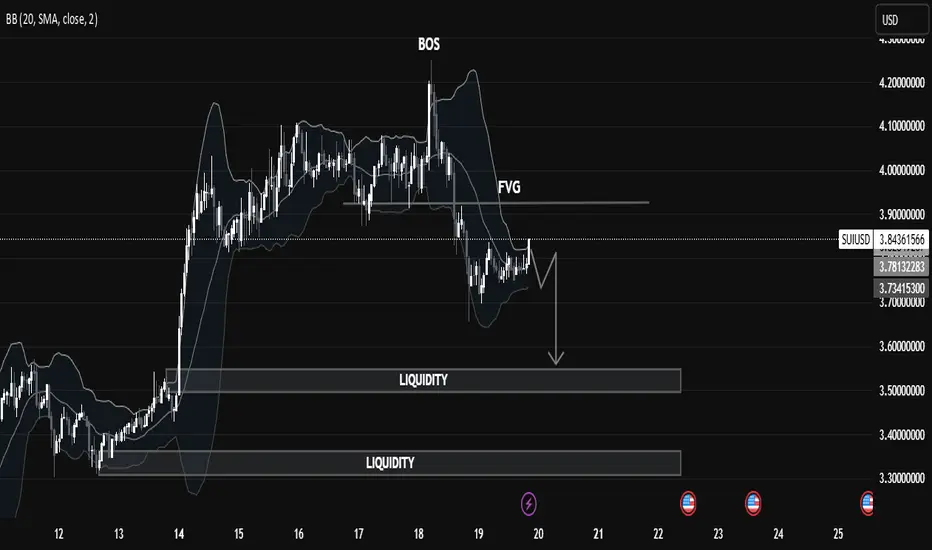
SUIUSD Liquidity Trap in Motion: Price Targeting Deeper Pools🧠 Market Structure Insight (SMC Framework)
🔍 1. Break of Structure (BOS):
The most recent BOS around the $3.95 level marked a bull trap, indicating a transition from bullish momentum to a distribution phase. This suggests institutional players offloaded liquidity at premium prices before initiating a markdown.
🕳️ 2. FVG (Fair Value Gap):
A visible Fair Value Gap (Imbalance) remains unmitigated above the current price action. This zone acted as a supply area, where price sharply moved down, leaving inefficiency in its trail—now serving as a potential point of rejection if revisited.
📌 Liquidity Zones:
Upper Liquidity Cleared: Price has swept highs before reversal (a sign of engineered liquidity grab).
Double Liquidity Pools Below:
First pool: Around $3.55 - $3.60
Second pool: Deep liquidity around $3.30 - $3.35
These levels are highly attractive for Smart Money to target next, suggesting continuation to the downside.
📉 Current Price Behavior:
Market is consolidating in a tight range just below FVG, signaling potential re-accumulation of sell orders.
The chart pattern suggests a potential lower high forming, likely to precede a bearish leg towards liquidity zones.
Bollinger Bands show compression, hinting at volatility expansion soon.
🎯 Trade Outlook (Not Financial Advice):
🔻 Bearish Bias:
Unless price breaks above the FVG zone with strong bullish momentum, the probability favors a bearish continuation targeting:
1st Target: ~$3.55
2nd Target (Deeper liquidity grab): ~$3.30
A rejection from FVG followed by a BOS to the downside would serve as confirmation for this bias.
📚 Educational Takeaway:
This chart is a clean illustration of Smart Money Concepts in play:
BOS > FVG > Liquidity Sweep
Price respects institutional footprints: grab liquidity, fill imbalances, then drive toward untouched liquidity zones.
Recognize market intent through structure shifts and imbalance reaction.
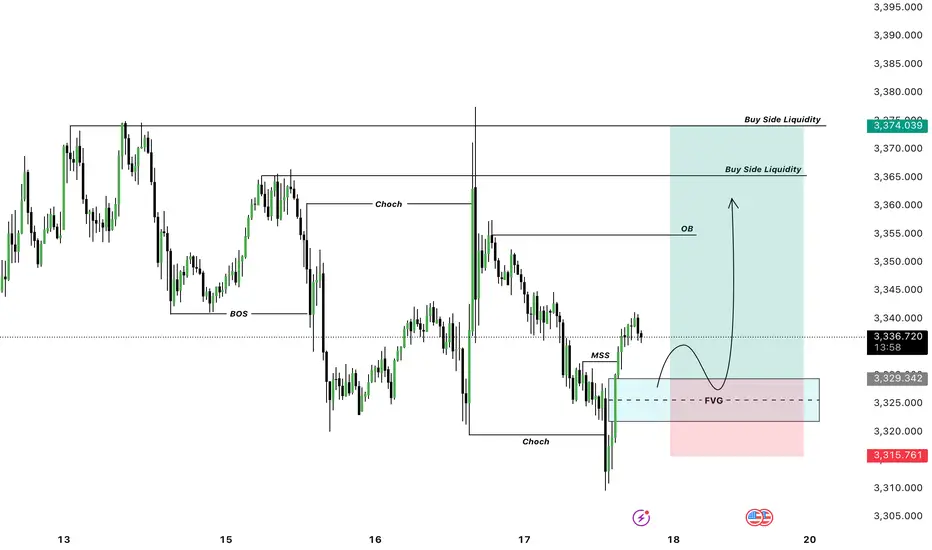
GOLD LONG SETUP Gold Bullish Long Setup
Startegy : FVG + MSS + BUY STRUCTURE
Where To Buy ?
3329 - 3320 Area FVG Buy
Targets : 3350 , 3355, 3360
Stop Loss Previous Low
$BTC All Eyes on the FVG Zone. CRYPTOCAP:BTC broke out above key resistance and is now retesting the FVG zone near $112K–$115K.
Holding this level could trigger a fresh rally toward $127K–$132K.
DYRO, NFA

Played it perfectly: grabbed long liquidity and rode down to ourHey everyone!
Move unfolded exactly as we planned:
Minor price spike – a classic false breakout to collect liquidity in the long zone.
No valid short formation, so I stayed sidelined during that spike.
Once long liquidity was swept, the market reversed sharply downward—right toward our objective.
Price then steadily slid to our lower target, closing the trade with the planned profit.
📊 Key takeaways:
Don’t force entries without clear setups.
Liquidity grabs in line with your overall scenario are powerful signals.
Patience and discipline remain the ultimate edge.
What are your thoughts? Share your experiences with similar liquidity hunts!

BTC Short | FVG Setup + RSI Filter | 18.06
Smart Money Concept | Intraday Trade | 1:2 RR
🔍 The setup:
Today I was watching for a short opportunity.
Price reached a key level and formed a bearish FVG — looked clean at first.
But I held off entering because I noticed RSI divergence — a red flag I always consider when expecting a potential level break.
💡 Why it matters:
RSI divergence often signals weakness in momentum.
For me, it's a key filter that helps avoid fake breaks — this was a good example of how I apply it.
📈 What happened next:
Price moved up to test the 1H FVG (zone #2) and formed another FVG slightly lower.
That second one was my entry point for the short.
🎯 Target:
I exited at a 1:2 risk-reward, which is my minimum.
The day was ending, and I didn’t want to hold the position longer — I’m not convinced the down move would continue cleanly (possible wicks or traps).
🤔 Question to the community:
How do you filter FVG entries?
Do you also use RSI or wait for structure shifts?
And what’s your outlook on BTC from here?

XAUUSD Short idea for todayWe are now in an bearish imbalance in 4H TF and now looking for break of structure on m15 to validate the idea to short as per the chart, still waiting for confirmation in the form of break of structure or 15m imbalance.

EURO-USD BUY STRONG 1. "EUR/USD Strong Buy Alert 🚀 | Key support zone holding firm – bulls eyeing the next leg up!"
2. "Strong Buy Zone ✅ | EUR/USD showing bullish momentum from this support level – eyes on 1.09+"
3. "EUR/USD Reversal Zone 💥 | Buyers stepping in strong – potential rally ahead!"
4. "Watch this zone! EUR/USD strong buy setup forming – bullish confirmation underway 📈"
5. "EUR/USD bouncing from key demand zone 🔥 | Technicals align for a strong buy signal!"

Fair Value Gap (FVG) in Crypto: The Complete Guide🔸Introduction:
In financial markets in general—and the crypto market in particular—understanding market liquidity and imbalance zones is essential for building successful trading strategies. One of the most prominent modern price analysis concepts, especially within the Smart Money Concepts (SMC) framework, is the Fair Value Gap (FVG). This refers to a price imbalance between buyers and sellers.
🔸What is the Fair Value Gap (FVG)?
A Fair Value Gap is an area on the price chart that shows an imbalance between supply and demand. It occurs when the price moves rapidly in one direction without being fairly traded within a balanced price range. This usually happens due to the entry of large players or “smart money,” creating a gap between three consecutive candlesticks on the chart.
Classic Bullish FVG Setup:
Candle 1: A bearish or neutral candle.
Candle 2: A strong bullish candle (usually large).
Candle 3: A bullish or neutral candle.
🔸Where is the Gap?
The gap lies between the high of candle 1 and the low of candle 3.
If candle 3 does not touch the high of candle 1, an unfilled price gap (FVG) is present.
🔸How is FVG Used in Market Analysis?
Traders use Fair Value Gaps as potential areas for:
Entering trades when the price returns to retest the gap.
Identifying zones of institutional interest.
Setting potential targets for price movement.
🔸Common Scenario:
If a strong bullish candle creates a Fair Value Gap, the price often returns later to retest that gap before continuing its upward movement.
The gap can be considered "delayed demand" or "delayed supply".
🔸🔸Types of FVG:🔸🔸
🔸Bullish FVG:
Indicates strong buying pressure.
The price is expected to return to the gap, then bounce upwards.
🔸Bearish FVG:
Indicates strong selling pressure.
The price is expected to return to the gap, then continue downward.
🔸Relationship Between FVG and Liquidity:
Fair Value Gaps are often linked to untapped liquidity zones, where buy or sell orders have not yet been fulfilled. When the price returns to these areas:
Institutional orders are activated.
The price is pushed again in the primary direction.
🔸How to Trade Using FVG (Simple Entry Plan):
Steps:
Identify the overall trend (bullish or bearish).
Observe the formation of an FVG in the same direction.
Wait for the price to return and test the gap.
Look for entry confirmation (like a reversal candle or a supporting indicator).
Set your stop loss below or above the gap.
Take profit at a previous structure level or the next FVG.
🔸🔸Real-World Examples (Simplified):🔸🔸
🔸Bullish Example:
A strong bullish candle appears on BTC/USD.
A gap forms between $74K and $80K.
The price rises to $108K, then returns to 74K$ (inside the gap).
From there, it begins to rise again.
🔸Important Tips When Using FVG:
Don’t rely on FVGs alone—combine them with:
-Market Structure.
-Support and resistance zones.
-Confirmation indicators like RSI or Volume Profile.
-Best used on higher timeframes (15m, 1H, 4H, Daily).
-The gap can be filled the same day or after days/weeks.
🔸Conclusion
The Fair Value Gap is a powerful analytical tool used to identify zones of institutional interest. It plays a key role in the toolset of professional traders who follow smart money principles. By mastering this concept, traders can improve entry and exit timing, reduce risk, and increase their chances of success.
Best regards Ceciliones🎯

Possible Next Move AUD JPYLooking at the Daily & 1HR Chart. Bearish trend over all. Likely to take out the Daily FVG to head down to the next significant price zone of 86.981. This area also shows a 1HR liquidity zone.

Possible Next GBP JPY MoveLooking at the Daily, 1HR and 15M charts, looking to take out the 1HR FVG. Then head down toward the 15M FVG. To then continue a downward move, taking out recent lows to the Daily FVG.

Possible Move For NZD JPYLooking at the Daily, 1hr and 15m charts. I feel moves will continue to be bearish. Heading into fill the 15m FVG. Possible small move up from here before continuing down to fill the Daily FVG and aiming for the next big price zone of around 83.413. Let's see.

Possible Next Move GBP USDLooking at the Daily, 1hr and 15m time frame. I think we could take out the 15m low FVG into the liquidity zone. Stretch back up to the 15m high FVG, hitting the high liquidity zone. Then down to target the untested Daily FVG's below.

what is fair value gap ? what is fair value gap ?
-This Analysis is based on educational purposes using the concepts of Smart Money and Liquidity Sweep area
- We create two fair Value gaps in which market will act on that
first one is between 3247 to 3260 area expecting move down from that point and touched 3192 to 3165 which is a strong liquidity zone

SOL — Clean Liquidity Grab & FVG Flip. Mid-Term Setup in PlayClassic move on SOL — liquidity sweep, inverted the FVG, and pushed higher. Textbook stuff.
Not expecting an instant pump, this one looks more like a mid-term play… although, with SOL, you never know.
Stay sharp. And follow to catch the next ones early.
Entry: 109
TP: 123-148

GBPUSD – Bearish Setup Forming | Fair Value Gap Rejection PlayThe 4H chart on GBP/USD shows a clean bearish market structure, with price currently in a corrective phase after recent downside momentum. A Fair Value Gap (FVG) has been identified between the 1.29700–1.30000 range, which acts as a key supply zone for potential short setups.
📊 Technical Breakdown
1. Fair Value Gap (FVG)
A visible imbalance was left after an aggressive bearish move—marked in the yellow zone.
Price is expected to retrace into this inefficient zone to fill orders before continuing downward.
The anticipated entry for shorts is around 1.29798, near the midpoint of the FVG.
2. Bearish Market Structure
Lower highs and lower lows dominate the current structure.
The bounce is corrective in nature and lacks momentum, indicating a potential bull trap.
Expecting a short-term retracement up to the FVG zone, followed by a continuation to the downside.
3. Target Zone
Target: 1.28042 — this level sits just above a previous demand zone, making it a natural TP1.
This area also overlaps with previous price reactions, giving it high confluence.
🧠 Trade Idea
Entry: ~1.29798 (within the FVG)
Target: 1.28042
Risk Management : A stop loss above 1.30000 or above the upper boundary of the FVG to account for false breaks.
Rationale: Risk-reward is favorable due to tight invalidation zone and strong downside continuation probability.
⚠️ Key Notes
Watch for confirmation at the FVG zone such as bearish engulfing or lower timeframe break of structure.
If price breaks above 1.3000 and holds, the idea will be invalidated.

USDJPY Long SetupUSDJPY Looks Bullish, Previous Day Candle Has closed above Friday Candle and we still have a LTH not taken i think today we will be bullish we might have a correction drop down to 0.25 or 0.5 of the previous day and continue higher

Fair Value Gaps vs Liquidity Voids in TradingFair Value Gaps vs Liquidity Voids in Trading
Understanding fair value gaps and liquidity voids is essential for traders seeking to navigate the complexities of the financial markets. These concepts, deeply rooted in the Smart Money Concept (SMC), provide valuable insights into the dynamics of supply and demand, helping to identify potential price movements. In this article, we’ll delve into both ideas, exploring their characteristics, differences, and use in trading.
Fair Value Gap (FVG) Meaning in Trading
A fair value gap, also known as an imbalance or FVG, is a crucial idea in Smart Money Concept that sheds light on the dynamics of supply and demand for a particular asset. This phenomenon occurs when there is a significant disparity between the number of buy and sell orders for an asset. They occur across all asset types, from forex and commodities to stocks and crypto*.
Essentially, a fair value gap in trading highlights a moment where the market consensus leans heavily towards either buying or selling but finds insufficient counter orders to match this enthusiasm. On a chart, this typically looks like a large candle that hasn’t yet been traded back through.
Specifically, a fair value gap is a three-candle pattern; the middle candle, or second candle, features a strong move in a given direction and is the most important, while the first and third candles represent the boundaries of the pattern. Once the third candle closes, the fair value gap is formed. There should be a distance between the wicks of the first and third candles.
Fair value gaps, like gaps in stocks, are often “filled” or traded back through at some point in the future. They represent areas of minimal resistance; there is little trading activity in these areas (compared to a horizontal range). Therefore, they are likely to be traded through with relative ease as price gravitates towards an area of support or resistance.
Liquidity Void Meaning in Trading
Liquidity voids in trading represent significant, abrupt price movements between two levels on a chart without the usual gradual trading activity in between. These are essentially larger and more substantial versions of fair value gaps, often encompassing multiple candles and FVGs, indicating a more pronounced imbalance between buy and sell orders.
While FVGs occur frequently and reflect the day-to-day shifts in market sentiment, liquidity voids signal a rapid repricing of an asset, typically following significant market events (though not always).
These voids are visual representations of moments when the market experiences a temporary absence of balance between buyers and sellers. This imbalance leads to a sharp move as the market seeks a new equilibrium price level. Such occurrences are not limited to specific times; they can happen after major news releases, during off-market hours, or following large institutional trades that significantly move the market with a single order.
Liquidity voids are especially noteworthy on trading charts due to their appearance as particularly sharp moves. Though they appear across all timeframes, they’re most obvious following major news events when the market rapidly adjusts to new information, creating opportunities and challenges for traders navigating these shifts.
Fair Value Gap vs Liquidity Void
Fair value gaps and liquidity voids are effectively the same thing in practice; a fair value gap is simply a shorter-term liquidity void. Both indicate moments of significant imbalance between supply and demand. At the heart of both phenomena is a situation where one significantly outweighs the other, leading to strong market movements with minimal consolidation. The distinction between them often comes down to scale and timeframe.
An FVG is typically identified by a specific three-candle pattern on a chart, signalling a discrete imbalance in order volume that prompts a quick price adjustment. These gaps reflect moments where the market sentiment strongly leans towards buying or selling yet lacks the opposite orders to maintain price stability.
Liquidity voids, on the other hand, represent more pronounced movements in a given direction, often visible as substantial price jumps or drops. They can encompass multiple FVGs and extend over larger portions of the chart, showcasing a significant repricing of an asset.
This distinction becomes particularly relevant when considering the timeframe of analysis; what appears as a series of FVGs on a lower timeframe can be interpreted as a liquidity void. On a higher timeframe, this liquidity void may appear as a singular fair value gap. This can be seen in the fair value gap example above.
For traders, it’s more practical to realise that both FVGs and liquidity voids highlight a key market phenomenon: when a notable supply and demand imbalance occurs, it tends to create a vacuum that the market is likely to fill at some future point. Therefore, it’s important to recognise that both these types of imbalances can act as potential indicators of future price movement back towards these unfilled spaces.
Trading Fair Value Gaps and Liquidity Voids
Trading strategies that leverage fair value gaps and liquidity voids require a nuanced approach, as these concepts alone may not suffice for a robust trading strategy. However, when integrated with other aspects of the Smart Money Concept, such as order blocks and breaks of structure, they can contribute significantly to a comprehensive market analysis framework.
Primarily, both FVGs and liquidity voids signal potential areas through which the price is likely to move rapidly to reach more significant zones of trading activity, such as order blocks or key levels of support and resistance.
This insight suggests that initiating positions directly within an FVG or a liquidity void may not be effective due to the high likelihood of the price moving swiftly through these areas. Instead, traders might find it more strategic to wait for the price to reach areas where historical trading activity reflects stronger levels of buy or sell interest.
Additionally, these market phenomena can inform the setting of price targets. If there is an FVG or liquidity void situated before a key area of interest, targeting the zone beyond the gap—where substantial trading activity is expected—could prove more effective than aiming for a point within the gap itself.
It's also useful to note the relative significance of these features when they appear on the same timeframe. An FVG, being generally smaller and indicating a discrete order imbalance, is more likely to be filled before a liquidity void. This is because liquidity voids represent more considerable and pronounced market movements that can set market direction, marking them as less likely to be filled within a short space of time.
Limitations of Fair Value Gaps and Liquidity Voids
While fair value gap trading strategies and the analysis of liquidity voids offer insightful approaches to understanding market dynamics, they come with inherent limitations that traders need to consider:
- Market Volatility: High volatility can unpredictably affect the filling of fair value gaps and liquidity voids, sometimes leading to incorrect analysis or false signals.
- Timeframe Relativity: The significance and potential impact of gaps and voids can vary greatly across different timeframes, complicating analysis.
- Incomplete Picture: Relying solely on these phenomena for trading decisions may result in an incomplete market analysis, as they do not account for all influencing factors.
- Expectations: There is no guarantee that a FVG/void will be filled soon or at any point in the near future.
The Bottom Line
As we conclude, it's essential to remember that while fair value gap and liquidity void strategies provide valuable insights, they’re part of a broader spectrum of SMC tools available to traders. They’re best combined with other analytical techniques to form a comprehensive approach to trading.
For those looking to delve deeper into trading strategies and enhance their market understanding, opening an FXOpen account can be a step toward accessing a wide array of resources and tools designed to support your trading journey.
FAQs
What Is a Fair Value Gap?
A fair value gap occurs when there's a significant difference between the buy and sell orders for an asset, indicating an imbalance that can influence market prices.
What Are Fair Value Gaps in Trading?
In trading, fair value gaps reflect moments where market sentiment strongly favours either buying or selling, creating potential price movement opportunities.
What Is the Difference Between a Fair Value Gap and a Liquidity Void?
The main difference lies in their scale: a fair value gap is typically a smaller, discrete occurrence, while a liquidity void represents a larger, more pronounced price movement.
How to Find Fair Value Gaps?
Traders identify fair value gaps by analysing trading charts for areas where rapid price movements have occurred. A FVG consists of three candles, where the second one is the largest and the first and third serve as barriers. The idea of the FVG is that it leads to a potential retracement to fill the gap in the future.
Is a Fair Value Gap the Same as an Imbalance?
Yes, a fair value gap is the same as an imbalance in the Smart Money Concept.
*Important: At FXOpen UK, Cryptocurrency trading via CFDs is only available to our Professional clients. They are not available for trading by Retail clients. To find out more information about how this may affect you, please get in touch with our team.
This article represents the opinion of the Companies operating under the FXOpen brand only. It is not to be construed as an offer, solicitation, or recommendation with respect to products and services provided by the Companies operating under the FXOpen brand, nor is it to be considered financial advice.
