EURGBP Analysis : Bullish Setup + Support & Reversal Zone Ahead🔍 Overview:
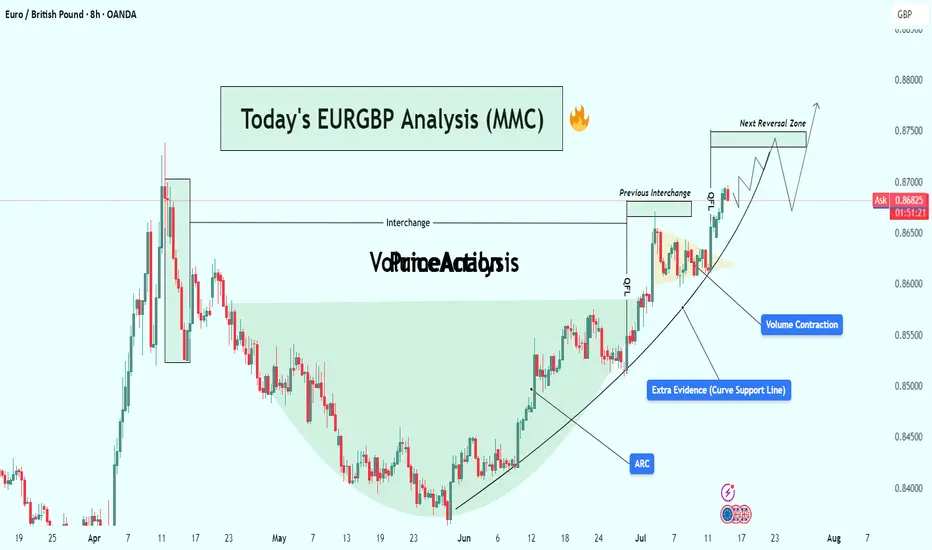
This analysis explores a well-developed Mid-Market Cycle (MMC) pattern playing out on the EUR/GBP 8H chart. The price action has transitioned from accumulation to markup, forming a classic cup-shaped recovery structure supported by a parabolic ARC curve. With strong volume contraction, historical interchange zones, and clean breakouts, this setup indicates bullish momentum heading into the next reversal zone.
Let’s walk through each component in detail and build the case for this trade setup.
🧩 1. MMC Cycle Framework
The chart structure aligns with the MMC (Mid-Market Cycle) model:
Phase 1 – Accumulation:
From April to late May, price formed a rounded bottom resembling a "cup" — a known sign of smart money accumulation. The downward momentum stalled, and sellers were gradually absorbed by larger participants.
Phase 2 – Breakout & Expansion:
Early June saw price breaking out of this base, beginning an aggressive uptrend supported by rising structure. This marks the transition to the markup phase of the MMC.
Phase 3 – Pullback & Continuation:
Price pulled back slightly into previous resistance (now turned support), forming a bullish continuation triangle and breaking out again. A textbook MMC continuation.
🧠 2. Technical Confluences
✅ A. ARC Support Curve
The curved support line (ARC) acts as dynamic demand.
Price has bounced multiple times off the curve, reinforcing its strength.
ARC patterns often signal increasing bullish acceleration, reflecting market psychology as traders gain confidence with each higher low.
✅ B. Interchange Zones
The concept of Interchange refers to zones where support becomes resistance or vice versa.
This chart features two key interchange levels:
First interchange formed after the April high.
Second interchange was retested and held cleanly after the breakout.
These areas indicate institutional interest, and their successful retests confirm trend continuation.
✅ C. Volume Contraction
Volume has been shrinking during the markup, which is counterintuitive but strategic.
In Wyckoff theory, this shows absorption of supply — institutions deliberately suppress volatility to accumulate before the next breakout.
Once the contraction ends, explosive moves often follow.
🎯 3. Target Zone: Next Reversal Area
Price is now heading into a clearly defined resistance zone around 0.87400–0.87500.
This level was respected in prior price history (April peak) and may trigger short-term selling or distribution.
The chart shows a possible liquidity grab scenario at the reversal zone, followed by a corrective move (mini bearish ABC).
📈 4. Price Projection & Scenarios
Bullish Case (High Probability)
Breakout Above 0.87500: Triggers a major leg upward.
Potential extension targets:
0.87850 (Fibonacci projection)
0.88200 (next higher timeframe resistance)
Bearish Case (Short-Term Pullback)
Rejection at Reversal Zone:
A corrective leg toward the ARC or prior interchange.
Ideal re-entry for buyers near:
0.86400–0.86600 zone
Or curve retest near 0.86000
🧭 5. Trade Strategy
🔹 Entry Options:
Breakout Entry: Above 0.87500 on strong candle + volume.
Retest Entry: On dip toward ARC curve or interchange.
🔹 Stop-Loss Ideas:
Below ARC line (~0.86000)
Below last bullish engulfing (~0.86250)
🔹 Targets:
TP1: 0.87500
TP2: 0.87850
TP3: 0.88200 (longer-term swing)
💡 6. Trader Psychology in This Chart
This chart represents a controlled bullish structure — a hallmark of smart money participation. Here’s why:
The rounding base was methodically built without sudden volatility.
Each breakout was followed by healthy retests (no fakeouts).
Volume stayed low during markups, reducing retail confidence and allowing institutional loading.
The ARC curve reflects increasing confidence and participation — buyers consistently stepping in on higher lows.
📌 Conclusion
This EUR/GBP setup is a textbook MMC/ARC structure with multiple confirmations:
Smart accumulation
Curve support respected
Volume and structure aligned
Clear next resistance zone
Whether you’re swing trading or monitoring for breakout scalps, this is a high-quality setup worth tracking. Be ready to act at the reversal zone, as it will either confirm continuation or offer a lucrative retest entry.
🔔 Follow for More:
I post regular MMC, structure-based, and Smart Money trade setups. Drop a like, comment your thoughts, or ask questions below!
Fxanalysis
USDJPY Analysis : Bearish Setup from Reversal Zone + Target⚠️ Overview:
The USDJPY 4H chart reveals a smart money-driven bearish setup, unfolding precisely from a major Reversal Zone, which aligns with a key supply area. Price action is now offering high-probability short trade opportunities, supported by structural breaks, clear CHoCHs (Change of Character), and BOS (Breaks of Structure).
🔎 Detailed Technical Breakdown:
🔹 Bearish Pattern + Channel Formation:
The pair formed a bearish price pattern earlier, which initiated the previous downtrend. This move developed into a well-formed descending channel, showing controlled distribution from the institutional side. The channel break marked a liquidity grab below previous lows, trapping retail sellers before shifting structure.
🔹 Channel Insider Demand + Breakout:
After reaching the Channel Insider Demand, USDJPY made a strong bullish push, causing a Minor BOS — a sign of temporary bullish pressure. However, this move served to rebalance price into a premium zone, which is the current Reversal Zone. This zone lies near previous imbalance/fair value gaps and coincides with a supply structure, making it a high-reaction area.
🔹 Reversal Zone (Premium Area):
Price tapped the Reversal Zone and began rejecting aggressively. This reaction indicates the presence of large sellers and order blocks. The current price action now displays a Minor CHoCH, suggesting a short-term bearish shift in order flow.
This is a textbook case of premium vs. discount pricing, where price seeks liquidity above recent highs before reversing to more balanced zones.
🔹 Price Flow Expectations (Downside Targets):
The first confirmation of bearish continuation will come with a clean break below the Minor CHoCH level (~144.400). Following that, momentum is expected to carry USDJPY toward:
🥇 Target 1: 144.00 – Local support / liquidity pocket
🥈 Target 2: 143.00 – Key psychological & structural support
🥉 Target 3: 142.00–142.50 Zone – Marked as the Next Reversal Zone, which could act as demand
This setup remains valid as long as the price remains below 147.200, which is the high of the Reversal Zone. A breakout above this invalidates the bearish thesis.
🧠 MMC (Mind Market Curve) Interpretation:
The chart clearly respects Mind Curve Theory structure:
CHoCH/BOS confirms internal order flow
Reversal zone is placed at a curve top (premium)
Support base (discount zone) is yet to be revisited
The curve shape guides a possible rounded rejection scenario, pushing price down into the major support, aligning with smart money liquidity grab behavior.
📊 Strategic Insight:
This is a classic smart money trap — fake bullish breakout, quick grab of early breakout traders’ stops, followed by a decisive turn from supply.
Traders should monitor:
Candle structure at current levels
Reaction to minor CHoCH zone (~144.400)

AUD/USD: The Clearest Short Opportunity This WeekThis week, the macro and market landscape provides a rare alignment across all major models—making AUD/USD the standout short opportunity among G10 FX pairs.
Key Reasons for the Bearish AUD/USD Bias:
1. Commitment of Traders (COT):
Institutional positioning has turned decisively bearish on the Australian dollar, with net shorts increasing and sentiment remaining negative.
2. Z-Score & Positioning Extremes:
Z-Score indicators confirm a below-average long bias for AUD, highlighting that recent speculative flows are heavily skewed to the short side.
3. EXO/Score Model:
Our EXO (macro scoring) model gives AUD/USD a clear SHORT rating, with no offsetting bullish factors in the “core” or “risk/reward” signals.
4. Commodity Edge – Iron Ore:
Iron ore prices, a crucial driver for AUD, have sharply declined in recent weeks. This is a classic “canary in the coal mine” for AUD weakness historically, persistent iron ore declines precede broader AUD selloffs.
5. Sentiment & Risk Environment:
Despite global “risk-on” sentiment, AUD is unable to benefit, as both macro and market participants rotate away from commodity FX and into USD strength.
6. Endo (Fundamental) Model:
While Australia’s macro data still looks solid on a lagging basis, all faster models (positioning, flows, sentiment, commodities) point to an imminent shift typically, ENDO lags in catching turning points.
Conclusion & Tactical View:
SHORT AUD/USD is the highest conviction trade for this week, backed by full alignment of macro, positioning, sentiment, and real-economy factors.
Expect continued downside pressure while commodity markets and COT data remain bearish.
For active traders, the first 3–7 days following this setup historically provide the highest reward-to-risk moves.

GBPUSD: Potential Reversal After Strong RallyThe British Pound has shown strong gains against the US Dollar, approaching a key resistance area. After such an extended move, a correction or reversal would be a logical expectation.
Technical Setup
There is a clear series of bearish divergences on the CCI (14) indicator. Price is forming a narrowing rising wedge, which often signals trend exhaustion.
Trade Plan
Sell limit orders: 1.3690 and 1.3850
Market entry: Only after confirmation — either a trendline break or a moving average crossover
Conclusion
GBPUSD shows signs of weakening at the top. I remain focused on short setups from resistance areas, waiting for confirmation to act.

EURUSD Weekly Analysis (MMC) – Bearish Path to Target Zone📈 Market Narrative – Understanding EURUSD's Path with MMC
The EURUSD pair is currently navigating a critical phase in its macro price structure, aligning closely with the Mind Market Concept (MMC) methodology — a trading framework rooted in institutional price behavior, psychological arcs, and structured market mapping.
This chart reveals a story of accumulation, expansion, manipulation, and rebalancing — classic smart money behavior playing out on the higher timeframe. The current move is not just price action — it's a strategic delivery of price toward imbalance, guided by volume vacuums, liquidity zones, and engineered traps.
🧩 Phase-by-Phase Technical Analysis
🔷 1. Arc Accumulation Zone – The Beginning of Institutional Positioning
In the latter half of 2024, EURUSD entered a rounded arc formation, which marks a textbook accumulation phase.
This "bowl-like" curve represents gradual absorption of sell-side liquidity by institutions.
The lows became progressively higher, indicating demand stepping in while supply weakened.
Volume during this time was suppressed — another smart money tactic to accumulate without causing price spikes.
📌 Why This Matters: Arcs often precede explosive breakouts, particularly when aligned with time-based liquidity cycles (quarterly/yearly rebalancing). This zone gave birth to the breakout that followed.
🔷 2. The Central Zone – Consolidation Before Expansion
Once the arc base was complete, price broke out impulsively, then pulled back into what is labeled the Central Zone.
This zone acts as a mid-range liquidity pocket — where orders are stacked and reaccumulation occurs.
It also became the launchpad for the final markup wave that tapped the previous target around 1.1250.
🔍 This move was the realignment phase, where smart money took price above key highs to:
Hit their internal targets.
Trap breakout traders.
Induce euphoria before distribution.
🔷 3. Major BOS – Break of Macro Structure
The breakout through 1.1150–1.1200 confirmed a Major Break of Structure (BOS).
This BOS acted as a signal for:
Trend reversal confirmation for many retail traders.
A "green light" to buy — which was anticipated and exploited by institutions.
But here’s the twist:
Price rejected the SR Interchange Zone (support turned resistance), signaling that the breakout was engineered to trap liquidity.
🔷 4. Distribution & Manipulation – The Trap Layer
The chart clearly shows two critical supply areas:
Minor Resistance (around 1.1400s)
Major Resistance (around 1.1550–1.1600s)
Price briefly approached these zones but failed to hold, forming a complex distribution range.
This is where:
Smart money distributed their long positions.
Retail buyers got trapped.
Volume increased during sell-side preparation.
📌 The rejection from these zones sent price into a clean markdown, forming lower highs and confirming the bearish structure mapping.
🔷 5. Structural Mapping – Downtrend Control
Price action is now clearly in a bearish delivery phase, as shown by:
Lower highs & lower lows
Repeated rejections from minor resistance
Large red candles with little retracement (showing momentum)
This phase is often misunderstood by retail traders. But within MMC, it’s identified as the delivery to imbalance — a controlled descent into unmitigated demand.
🔷 6. Target + Reversal Zone – Where the Real Opportunity Begins
We are approaching the most important area on the chart:
🟡 Target + Reversal Zone (around 1.0950–1.1000)
This zone is not randomly drawn:
It's the origin of the arc breakout, a high-volume node.
It's a discounted price level where institutions may re-engage.
It’s untapped demand from the earlier accumulation — meaning no major reaction has occurred here yet.
If price slows down here, forms a liquidity sweep, or gives a bullish engulfing on the lower timeframe — this could be the reversal point.
But:
If price slices through with strong momentum, it may signal macro weakness, opening room to test the 1.0800 region.
🧭 Trade Plan & Execution Guide
Setup Type Actionable Guidance
📉 Bearish Pullback Entry Short entries near 1.1300–1.1350 with stop above minor resistance
🟡 Demand Reversal Watch Wait for reaction in 1.0950–1.1000, assess volume & candle response
📊 Structure Confirmation Use lower timeframe BOS for entry alignment
🛡️ Risk Management Keep risk below 1% per trade, avoid chasing mid-zone prices
💬 Key Takeaways
EURUSD has completed its accumulation → expansion → manipulation cycle.
We are now entering the rebalancing phase, where the market returns to fair value (demand).
Smart money flow is visible — from engineered highs to controlled selloffs.
The Target + Reversal Zone will likely dictate the next macro direction.

Pre-FOMC Week - Bullish run on the EUR/USD & GBP/USD....Like last week's video analysis, I'm currently holding long positions on the EUR/USD and GBP/USD. I'm expecting strong movements in the coming week due to FOMC and Interest Rate Policy.
The ETF SOXL, has been running well although Friday dumped pretty hard but long positions remain solid. I'll remain diligent in observing the price action this week and hopefully book a good 90% profit so far for the 1st Quarter of 2025.
EUR/USD:
•1.0265
•1.0416
•Target: 1.06000
GBP/USD:
•1.2209
•Target: 1.2600 or 1.2700
ETF SOXL:
•$29.01
•Target: $36 or $40
Good Luck. Trade Safe.

USDCAD Resistance Third Attempt Hi Traders!
There may be a break soon as USDCAD looks to test the 1.35440 resistance area for a third time.
Here are the details:
The price action looks bullish; the market swings are getting higher, and the 20 EMA support re-test has held.
Our idea here is to buy market dips leading up to 1.35440 for a possible break above if the bullish momentum continues. The long-term target is around the 1.36269 area, as we expect some resistance there.
Preferred Direction: Buy
Technical Indicators: 20 EMA
Please make sure to click on the like/boost button 🚀 as your support greatly helps.
Trade safely and responsibly.
BluetonaFX

BluetonaFX - USDJPY Tumbling After Failed Record High BreakHi Traders!
The 151.946 apex level proved to be too strong and there is a now potential double top pattern on the USDJPY 1W chart after the market failed to break and close above 151.946.
Price Action 📊
After the initial break and close above the previous strong resistance level at 145.073, the market traded with continuous bullish momentum to target the psychological 150 handle and then the apex level, but the market seems to have run out of steam and is rapidly pulling back towards 145.073.
Fundamental Analysis 📰
We have the FOMC minutes meeting today, and depending on what is revealed in the minutes meeting, we have further downsides this week for the US dollar.
Support 📉
146.711: 20 EMA
145.073: PREVIOUS RANGE ZONE RESISTANCE
Resistance 📈
149.991: WEEKLY HIGH
Risk ⚠️
No more than 2% of your capital.
Reward 💰
At least 4% of your capital.
Please make sure to click on the like/boost button 🚀 as your support greatly helps.
Trade safely and responsibly.
BluetonaFX

XAUUSDnow gold pattern is like a tripple top now. Next level will be drop to the low zone, I will wait to see a reversal soon.

USDCAd ThesisThis is how i'm currently looking at the usdcad pair. Market broke trendline after failing to brake resistance and make new high. I'm now waiting for a bearish set up as confirmation to go short.

EURUSD Swing/Day Institutional ShortWe are finally in the trade that I plotted out on 9th of October. It has been executed on my account. Entry at 62% OTE. The trade is risk free since I have break evened it. Will close my position at daily low and will start taking partials in mid.
Happy trading

EURGBP ThesisThis is how i'm currently viewing this pair; will wait for break and retest of structure. What's your plan for this pair?

USSCAD Analysis Though we had some trades missed we are still following the footprints and focusing on zones to hop in carefully


BTC SHOWING SOME BULL RETRACEMENT BTC is holding the price at the major support not closing below the major monthly support, he tested it and moved below and returned back to the support price which shown that BTC may actually be trying some retracement of some bullish if the bearish impulse fails in the next coming days. My advise for those that are willing to invest on BTC should start investing some spare i mean small of their capital, and if it drop they should also invest more before the next bull move is goint to start

EURCHF, EURAUD and EURCAD Top-down analysisHello traders, this is the full breakdown of this pair. We will take this trade if all the conditions are satisfied as discussed in the analysis. Smash the like button if you find value in this analysis and drop a comment if you have any questions or let me know which pair to cover in my next analysis.

GOLD - QUICK TRADES VIEWGOLD - Momentum is in favour of buyers, following the parallel channel. It is expected to go up from.
Trade levels
Buy here at current price 1826
Stop loss 1821
Target 1829 - 1832
Follow my channel for more quick trades.

EURCAD top-down analysisHello traders, this is the full breakdown of this pair. We will take this trade if all the conditions are satisfied as discussed in the analysis. Smash the like button if you find value in this analysis and drop a comment if you have any questions or let me know which pair to cover in my next analysis.

EURJPY top-down analysisHello traders, this is the full breakdown of this pair. We will take this trade if all the conditions are satisfied as discussed in the analysis. Smash the like button if you find value in this analysis and drop a comment if you have any questions or let me know which pair to cover in my next analysis.


EURJPY top-down analysisHello traders, this is the full breakdown of this pair. We will take this trade if all the conditions are satisfied as discussed in the analysis. Smash the like button if you find value in this analysis and drop a comment if you have any questions or let me know which pair to cover in my next analysis.

Usdcad prediction It’s been awhile I traded usdcad but I felt the current structure I’m seeing might be useful. Let’s see how things will go on it.

USDCNH top-down analysisHello traders, this is the full breakdown of this pair. We will take this trade if all the conditions are satisfied as discussed in the analysis. Smash the like button if you find value in this analysis and drop a comment if you have any questions or let me know which pair to cover in my next analysis.
