EURUSD📉 Support level?❗The EUR / USD forecast assumes the development of a correction and a test of the resistance area near the level of 1.1595. Where can we expect a rebound and an attempt to fall in the pair to an area below the level of 1.1355. A test of the trend line on the relative strength index (RSI) will be in favor of reducing the currency pair. Cancellation of the EUR / USD pair fall option will be a strong growth in quotations and a breakdown at the level of 1.1665. This will indicate a breakdown of the resistance area and a continuation of the rise of the currency pair on Forex to the area above the level of 1.1975.
Have a nice trade!
Fxsignal

XAUUSD🤑 Retest support line?📈The GOLD price forecast assumes an attempt to test the support level near the 1725 area. Then, the GOLD prices will continue to rise with a target above the level of 2065. A test of the trend line on the relative strength index (RSI) will be in favor of raising the quotes. Cancellation of the growth option for GOLD will be a fall and a breakdown of the level of 1655. This will indicate a continued decline in quotations to the area below the level of 1565.
Have a nice trade!

USDCHF❗Short 📉USD / CHF forecast suggests an attempt to test the support level near the 0.9175 area. Then, the continued growth of USD / CHF to the area above the level of 0.9765. A test of the trend line on the relative strength index (RSI) will be in favor of the rise. Cancellation of the USD / CHF growth option will be a breakdown of the support area and closing of quotations below 0.8915. This will indicate a continued fall of the pair with a potential target below the level of 0.8535.
Have a nice trade!

EURUSD📈Long❗EUR / USD forecast suggests an attempt to correct and test the resistance area near the level of 1.1795. Where can we expect the pair to continue falling to the area below the level of 1.0755. An additional signal in favor of a decline will be a test of the resistance line on the relative strength index (RSI). Cancellation of the option to drop the Euro / Dollar will be a strong growth and a breakdown of the level of 1.2275. In this case, we should expect the pair to continue to rise with a potential target at the level of 1.2735.
Have a nice trade!

Usd in recovery on YenThe algorithmic advisor Marketmiracle generated a LONG input signal for the currency cross USD JPY
The entrance price is 109.41 and the target price 110.5577 for a possible profit of 1.05
Market sentiment is positive so it should facilitate movement
Analyzing on the diagram I expect a movement of the prices like that indicated
This idea is based on the signal generated by the Marketmiracle advisor whose link you can find by scrolling at the bottom of this page.

#EURUSD #EURUSD
👉New forecast
The price returned to the lower part of the channel, failed to break through the strong resistance line.
Therefore, at the moment I expect them to go down - to the lower level of the channel.
In general, in such an unstable situation with my strategy, I advise you to wait a little.

EURJPY 03 05 2021EURJPY 03 05 2021
1 - false breakout of the resistance at 131.45 (the price has already returned to the line).
2 - strong resistance in July 2019 (border of an uptrend) without any breakout.
3 - the end of the growth, which has been from the beginning of January from the lower support of the channel 125.64.
Target - 127.98

** USDJPY ** sell trade currently open, lets see what happens.Hi all, hope your having a great week, really happy with current performance for the strategy, forward testing is showing solid results across the board.
The entry price, stop loss (in pipettes) and take profit are shown on the chart itself.
Just something I'm working on in Pine script, I'll share as many trading ideas as and when I can, so I can document my progress.
My name is Al, I'm 40 and from the UK.
I've been trading for a few years, my key goal is to automate my strategies and remove as many decisions as I can.
Any questions, feel free to drop me a direct message if I can help.
These ideas, aren't specific advice from me - so if you enter, of course do your own due diligence - always manage your risk like a pro too.
This is all for information and education.
Have a great day,
Al.
🙂
PS. Check my other 'Related Ideas' too.

** EURCHF ** SL hit for the short on H1 timeframeHi all, hope you all had a great weekend and ready for a fresh week on the charts.
The entry price, stop loss (in pipettes) and take profit are shown on the chart itself.
Just something I'm working on in Pine script, I'll share as many trading ideas as and when I can, so I can document my progress.
My name is Al, I'm 40 and from the UK.
I've been trading for a few years, my key goal is to automate my strategies and remove as many decisions as I can.
Any questions, feel free to drop me a direct message if I can help.
These ideas, aren't specific advice from me - so if you enter, of course do your own due diligence - always manage your risk like a pro too.
This is all for information and education.
Have a great day,
Al.
🙂
PS. Check my other 'Related Ideas' too.

** EURJPY ** currently in drawdown lets see how this one goes.Hi all, hope you all had a great weekend and ready for a fresh week on the charts.
The entry price, stop loss (in pipettes) and take profit are shown on the chart itself.
Just something I'm working on in Pine script, I'll share as many trading ideas as and when I can, so I can document my progress.
My name is Al, I'm 40 and from the UK.
I've been trading for a few years, my key goal is to automate my strategies and remove as many decisions as I can.
Any questions, feel free to drop me a direct message if I can help.
These ideas, aren't specific advice from me - so if you enter, of course do your own due diligence - always manage your risk like a pro too.
This is all for information and education.
Have a great day,
Al.
🙂
PS. Check my other 'Related Ideas' too.

#EURUSD 16 04 2021#EURUSD 16 04 2021
I would like to remind you that yesterday we expected the price to fall from the 1.199 resistance zone and as you can see today the price really reversed from this resistance and showed a slight fall. After the price showed a strong increase from the 1.170 support zone, where the level, the lines of 2019 and 2007, and the turn line of January 2021 intersect, the price broke through the channel line 1.189. Then it fixed on it and rose to the resistance line 1.199. This line has been on the chart since February 2019. Now I expect the price to reverse and fall back to the 1.176 support line. This will be our goal.

** EURCAD - BUY - M15The entry price, stop loss (in pipettes) and take profit are shown on the chart itself.
Just something I'm working on in Pine script, I'll share as many trading ideas as and when I can, so I can document my progress.
My name is Al, I'm 40 and from the UK.
I've been trading for a few years, my key goal is to automate my strategies and remove as many decisions as I can.
Any questions, feel free to drop me a direct message if I can help.
These ideas, aren't specific advice from me - so if you enter, of course do your own due diligence - always manage your risk like a pro too.
This is all for information and education.
Have a great day,
Al.
🙂
PS. Check my other 'Related Ideas' too.
Strategy Report

#XAUUSD 29 03 2021#XAUUSD 29 03 2021
(the upper border of the growing channel) 1695.91.
I expect the price to be:
1 - will rise to the resistance level of 1785.48.
2 - breaks the support 1710.45 (and fixes).
3 - will break through support 1618.17 and continue to fall.
Target - 1540.11.

#AUDUSD 26 03 2021#AUDUSD 26 03 2021 The first line is the border of a small descending channel, which was formed in December 2020. The second one appeared in May 2020. And the last one is the oldest, the first touch of which happened in September 2019! Despite the fact that after the false breakdown of the 0.777 resistance line that took place last week, the price dropped dramatically, I am sure that it will stop in this zone. I expect that from the 0.757 support zone the price will start a new rise and eventually come to the 0.775 resistance line.

GBPCAD - DAY TRADE VIEWGBPCAD - On hourly candles & chart it's approaching a stiff resistance zone , it should drag down
Go sell only below 1.73330
Maintain stop loss around 1.73900
Potential downside target 1.72650 - 1.72100
Trade as per your risk appetite, I will be glad to see your likes & comment.
Why you should follow this tradingview account ?
Managed by top most renowned trader - Pulak Priyesh
10 + years of trading experience
Professional Day trader
Excellence award winning mentor
Professional chart, clear chart without junks.
Major S/R levels with inner insights
Frequent Day & Swing trade levels
All major and minor FX/INDICES covered. Thanks

#EURCAD Buy#EURCAD Buy
The price came to a strong support zone (channel line + 2012 line). From here, I expect growth to resistance.
The target is 1.549.

EURUSD Sell Signal EntriesLet's keep this simple. :) Rule 1: Look left.
Sell entries at backside of broken up trend line and at resistance (past support). Sell down to support leel @ 1.2050 or 1.1900.
Good luck and let me know if I can help in any ways!
Charles V
CVFX Management
Trading made Simple
Jan 2021: 14%

EURCHF: Long EntryRight now for the EURCHF pair, I think that the resistance trendline have been broken and it is starting to garnish some support levels. I think it is due for an even higher wedge compared to the recent positive retracement. It still has a bit to go, but right now I feel the entry is decent. That being said, everything I say is on an opinion based basis. Please proceed with caution and do your own due diligence. Invest at your own risk.

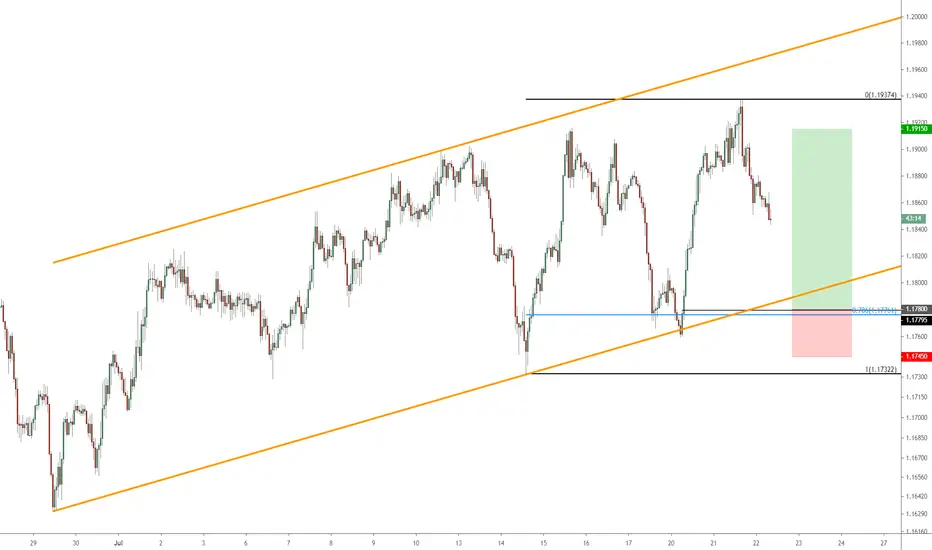
GBPCHF - Buying dips towards the lower end of the channel GBPCHF is Bullish - We look to Buy at 1.1780
▪️ Negative overnight flows lead to an expectation of a weaker open this morning.
▪️ Trading within a Bullish Channel formation.
▪️ We have a 78.6% Fibonacci pullback level of 1.1776 from 1.1732 to 1.1937.
▪️ Bespoke support is located at 1.1780.
▪️ Further upside is expected although we prefer to set longs at our bespoke support levels at 1.1780, resulting in improved risk/reward.
Stop: 1.1745
Target1: 1.1915
Target2: 1.1935
EURNZD - Inverse head and shoulders forming? EURNZD is Bullish - We look to Buy at 1.7420
▪️ Positive overnight flows lead to an expectation of a firm open this morning.
▪️ Bespoke support is located at 1.7420.
▪️ A bullish reverse Head and Shoulders is forming.
▪️ We have a 61.8% Fibonacci pullback level of 1.7361 from 1.7653 to 1.7190.
▪️ Further upside is expected although we prefer to set longs at our bespoke support levels at 1.7420, resulting in improved risk/reward.
Stop: 1.7375
Target1: 1.7650
Target2: 1.7750

EURAUD - Selling rallies to the 61.8% Retracement EURAUD is Bearish - We look to Sell at 1.6500
▪️ Short term bias is mildly bearish.
▪️ Bespoke resistance is located at 1.6500.
▪️ We have a 61.8% Fibonacci pullback level of 1.6489 from 1.6771 to 1.6032.
▪️ Further downside is expected although we prefer to set shorts at our bespoke resistance levels at 1.6500, resulting in improved risk/reward.
▪️ Expect trading to remain mixed and volatile.
Stop: 1.6560
Target1: 1.6115
Target2: 1.6000

USDCHF | Another successful trade?After the EURCHF analysis, it was the turn of the USDCHF.
In the last 3 months the price was in consolidation. As we had lower peaks and higher bottoms - a triangle formation.
We now have a breakthrough and we expect the price to continue in the direction of this breakthrough.
Yesterday we also saw a correction of the last decline, so we can expect the movement to continue.
Support levels:
0.9554
0.9497
0.9405
If you find this useful - give us a like!
If you have the same or different vision for the future movement - comment!

EURAUD - Potential double top forming EURAUD is Bearish - We look to Sell at 1.6673
▪️ Short term bias is mildly bearish.
▪️ Bespoke resistance is located at 1.6673.
▪️ We have a 78.6% Fibonacci pullback level of 1.6700 from 1.6763 to 1.6469.
▪️ Further downside is expected although we prefer to set shorts at our bespoke resistance levels at 1.6673, resulting in improved risk/reward.
▪️ Expect trading to remain mixed and volatile.
Stop: 1.6724
Target1: 1.6455
Target2: 1.6400
