EUR/USD Eyes 1.1200: Technical Momentum Fueled by Dovish Fed ExpEUR/USD Eyes 1.1200: Technical Momentum Fueled by Dovish Fed Expectations
In a striking ascent, the EUR/USD pair is surging towards the major resistance at the 1.1150 level, signaling a bullish momentum that aims to breach the psychological threshold of 1.1200. The Euro (EUR) maintains its winning streak, gaining ground against the subdued US Dollar (USD). This favorable trend is largely attributed to the anticipated dovish stance of the US Federal Reserve (Fed) concerning the future trajectory of interest rates.
Dovish Fed Expectations:
Building on our previous analysis, the EUR's upward trajectory appears to be continuing, supported by a combination of factors. The market sentiment is influenced by the expectation that the Federal Reserve (Fed) may adopt a dovish stance on interest rates in the coming year. With US yields trending lower and market participants anticipating rate cuts, the US Dollar faces headwinds. Concurrently, equity prices remain near recent highs, contributing to the sustained pressure on the US Dollar, particularly in the context of holiday-thinned trading.
Upcoming Data and Holiday Impact:
Amid the holiday season, Wednesday saw no significant reports, setting the stage for Thursday's focus on the US weekly Jobless Claims. Additionally, attention will be directed towards Spain's preliminary inflation figures for December, set to be released on Friday.
Looking Ahead:
As the year 2023 draws to a close, the calm waters in the market continue to weigh on the US Dollar, offering further support to the EUR/USD pair's upward momentum. However, as markets transition back to normal functioning in the upcoming week, the focus will shift to crucial US employment data. The outcome of these economic indicators could potentially shape the currency landscape as the new year unfolds.
The EUR/USD pair's bullish trajectory towards 1.1200 is a testament to the prevailing market sentiment, driven by expectations of a dovish Federal Reserve. As the year concludes, the subdued US Dollar faces challenges, with the EUR maintaining its winning streak. Traders and investors will closely monitor upcoming economic data and the return to normal market conditions in the new year, as they seek to navigate the evolving dynamics of the currency markets.
Our preference
Long positions above 1.09500 with targets at 1.1150 & 1.1200 in extension.
Fxsignals

AUDJPY Sell/ShortAUDJPY has faked out on the daily and took a downward trend instead. I have observed AJ for the last few days and can firmly say I confirm a downtrend for the next few weeks following into the new years. Below I have the signals inputs so please use proper risk management when entering. Thank you.
AUDJPY Short/Sell
ENTRY: 96.431
TAKE PROFITS:
TP 1: 93.832
TP 2: 90.401
SL: 97.584
Please use proper risk management upon entering this trade.

EURUSD Double Top OpportunityHi Traders!
EURUSD is forming a potential double-top pattern, and there is great risk-reward potential for shorting opportunities near the resistance.
Here are the details:
The market tested the previous month's high of 1.10173, but the bears are holding very strongly around this level, which has currently formed a double-top pattern on the chart.
Preferred Direction: Sell
Entry Level: 1.09960
Stop Level: 0.65089
Target Level: 1.10771
Technical Indicators: 20 EMA
Please make sure to click on the like/boost button 🚀 as your support greatly helps.
Trade safely and responsibly.
BluetonaFX

EURCAD: Top-Down Analysis & Bullish Outlook 🇪🇺🇨🇦
EURCAD reached an important confluence zone on Friday.
The underlined blue area based on 618/50 retracements of the last
2 bullish impulses and a horizontal key support.
As a bullish confirmation, the price broke a resistance line of a falling wedge pattern
on an hourly time frame.
We can expect a pullback now.
Goals: 1.466 / 1.469
❤️Please, support my work with like, thank you!❤️

GBPUSD: Intraday Bearish Outlook 🇬🇧🇺🇸
After a test of an intraday horizontal resistance,
GBPUSD formed a descending triangle formation on an hourly time frame.
I expect a bearish movement to the closest horizontal support.
Goal - 1.2554
❤️Please, support my work with like, thank you!❤️

EURJPY Sell/ShortEURJPY is a risky trade you can take with small risk (strongly recommended) until it breaks below support (potential pump fake out) please enter in with PROPER risk management and wait until further confirmations.
EURJPY
Sell/Short
ENTRY: 163.882
TP: 160.494
SL: 164.668
2-5% risk capital.

NZDCHF: Bullish Trend Continues 🇳🇿🇨🇭
NZDCHF is taking off from a key horizontal demand zone.
As a confirmation, the price formed a tiny double bottom on that on an hourly time frame.
We may anticipate growth now.
Goals: 0.5428 / 0.546
❤️Please, support my work with like, thank you!❤️

GBPAUD Buy/LongGBPAUD has has been on support trend for the last few days making it seem this can turn bullish for the next up coming weeks. Based off this analysis there is clear indication that holding on long enough can reverse the trend all the way up. Below I have provided full TP, SL, and entry points. Thank you for your time.
GBPAUD
Buy/Long
Entry: 1.90882
TP: 1.96858
SL: 1.89466
Use proper risk management when applying these inputs. Thank you.
2-5% risk capital.

GBPCAD Sell/ShortWatching and analyzing GBPCAD for the last few days it is clear confirmation that we are facing a heavy downtrend potential reversal from here on out through the next week. Please use risk management and please view all of our signals for more potential profitable trades!
GBPCAD
Sell/Short
Entry: 1.71648
TP 1: 1.69757
TP 2: 1.67276
SL: 1.72642
RISK 2-5% of Capital.

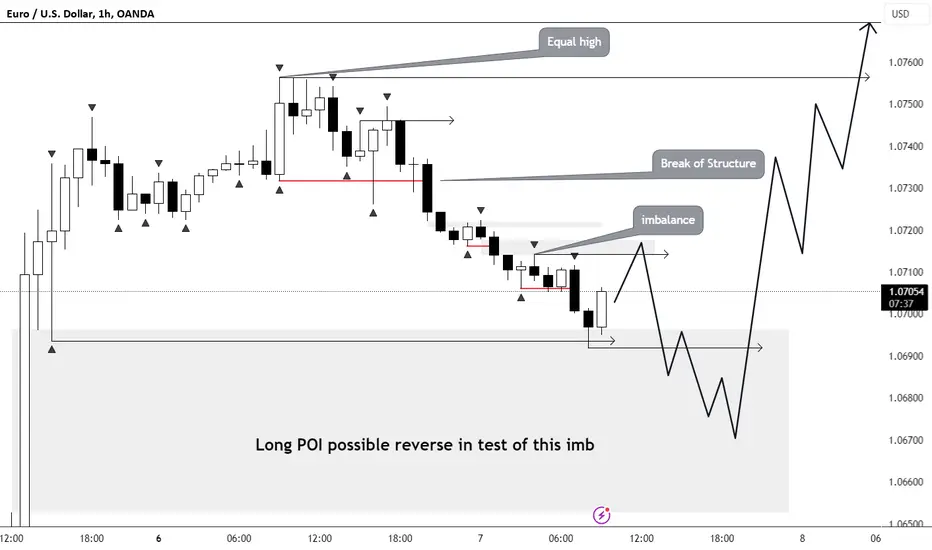
EURUSD#EURUSD
Hello, everyone! Quite an eventful day in terms of price movement. From the morning, I had a clear goal to continue trading in the direction of the established trend. The equal highs formed in Asia were a bit concerning. The lack of interaction with this liquidity seemed unusual to me, but such situations occur occasionally, and we trade what the market provides. In New York, there was a potential short setup, but I invalidated it for two reasons: 1) the absence of interaction with the Asian high and equal highs, and 2) a long context on all timeframes. The hourly timeframe shifted to a short context, and I would like to continue working in the short direction tomorrow, as there is still a significant amount of untouched liquidity. Local targets are marked on the chart. Short positions are a priority in the morning.
On the daily timeframe, we experienced a reversal movement after covering the imbalance.

GBPAUD Sell/ShortGBPAUD current trend remains strong, not have been broken once in the last few months so it is safe to say to go in with proper risk and trade for a buy/long. Below are the inputs for entry, TP, and SL.
GBPAUD
Buy/Long
ENTRY: 1.90648
TP: 2.01017
SL: 1.89402
2-5% risk capital.

EURAUD Buy/LongLooking to enter in EURAUD long from here since the channel trade has shown this is a bullish trend and as well highlighted in the RSI that we can be breaking through these moving averages. Below is the signal inputs. Please enter in with proper risk management. If any questions on the trade please comment below and be sure to follow us on X!
EURAUD
Buy/Long
Entry: 1.66308
Stop Loss: 1.64145
Targets:
TP: 1.74953
SWING TRADE
Risk: 2-5% of Capital

NZDCAD: Pullback From Support 🇳🇿🇨🇦
NZDCAD formed a double bottom formation on a strong horizontal support.
We may anticipate a pullback now.
Goals: 0.8220 / 0.8239
❤️Please, support my work with like, thank you!❤️

GBPCAD: One More Bullish Confirmation 🇬🇧🇨🇦
GBPCAD leaves one more bullish clue.
Retesting a solid demand zone, it formed a double bottom
and violated its horizontal neckline.
I expect growth now to 1.6925 / 1.6960
❤️Please, support my work with like, thank you!❤️

GBPCADGBPCAD has shown a clear weakness in bullish trend times making a slowed volume push and has shown clear bearish volume shorts put in by traders. I believe the trend will be now reversed and only clear a higher low for GBPCAD. Please use proper risk management when entering the trade.
GBPCAD
Sell/Short
Entry: 1.69312
Stop Loss: 1.70333
Target:
TP: 1.61530
DAY TRADE/SWING TRADE
Risk: 2-5% of Capital

EURUSD Day PlanGood morning, as you can see we have long context on 1h timeframe my target is PDL, higher we do have an IMB that can give reaction.

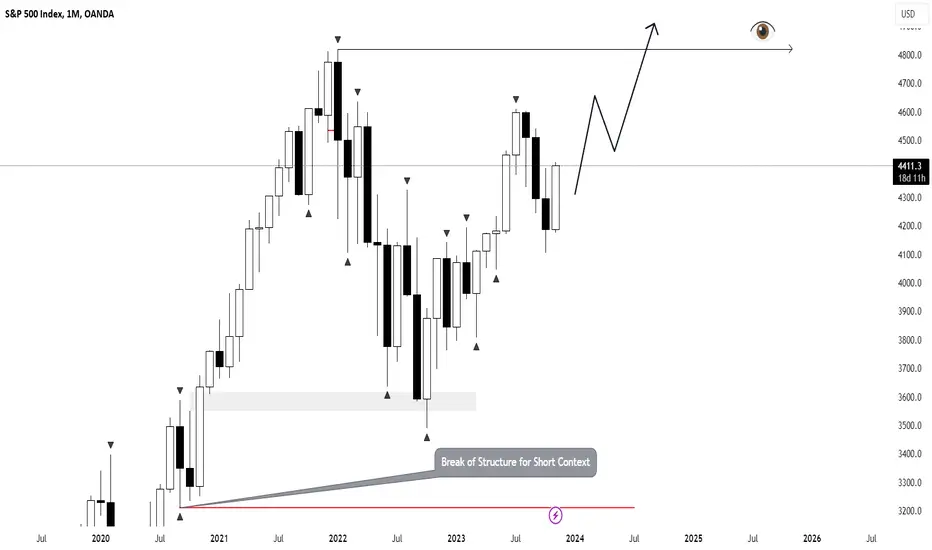
SPX 1MONTHMonthly timeframe: We received a reaction from the imbalance zone at a price of 3600. It's worth noting that throughout the entire last year and this year, we have been in a long (corrective) context. The logical target could be the maximum of the year 2021. Invalidating the long context would be possible if the price drops below 3200 with confirmation.
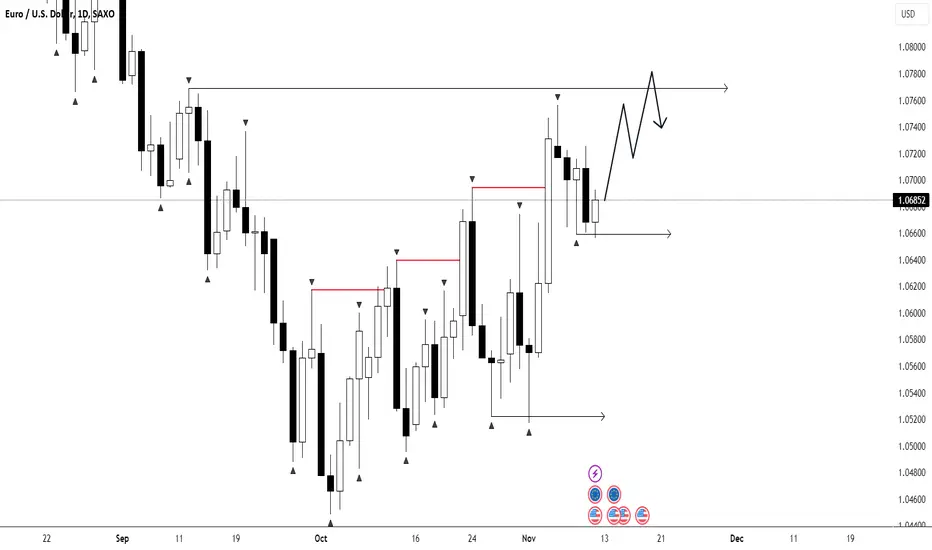
EURUSD 1D#EURUSD
This week, the euro lived up to all expectations from the higher timeframe. We confirmed the long structure by updating the key price maximum and securing ourselves above it. It's worth noting the movement on Friday when we cleared the liquidity formed on Wednesday (midweek low). For the next week, I anticipate the continuation of the long scenario with a maximum update and the removal of liquidity above, as indicated on the chart.
FXSUSDT.4HBased on the provided market data, the FXS/USDT pair is currently trading at $6.94. The Relative Strength Index (RSI) for the 4-hour, 1-day, and 7-day charts are 63.74, 70.18, and 53.79 respectively. This suggests that the pair is slightly overbought on the 4-hour and 1-day charts, indicating a potential price correction or consolidation in the near term.
The Moving Average Convergence Divergence (MACD) for the 4-hour and 1-day charts are positive, suggesting bullish momentum in these timeframes. However, the MACD for the 7-day chart is negative, indicating bearish momentum in the longer term.
The Bollinger Bands (BB) on the 4-hour and 1-day charts are slightly above the current price, suggesting that the pair is trading in a reasonable range in these timeframes. The BB on the 7-day chart is above the current price, which could indicate that the pair is undervalued in the longer term.
The provided support and resistance levels suggest that the pair has room to move in both directions. The closest support level on the 4-hour chart is $6.654, while the closest resistance level is $7.22. On the 1-day chart, the closest support level is $6.117 and the closest resistance level is $7.587. On the 7-day chart, the closest support level is $6.18 and the closest resistance level is $7.072.
In conclusion, the FXS/USDT pair appears to be slightly overbought in the short term but has bullish momentum. There may be potential for a price correction or consolidation in the near term. In the longer term, the pair appears to be undervalued and has bearish momentum. Traders should watch the support and resistance levels closely and consider the RSI and MACD indicators when making trading decisions.
This is just an analysis based on the provided data. It's always recommended to do your own research before making any investment decisions.

USD/CHF Sell Opportunity - Swing Trade - 0.90000 Key ResistanceI have just taken a sell position on USD/CHF expecting some strong selling pressure over the next coming weeks.
From a technical perspective we can see price has come into 0.90000 level which is a key area of daily / weekly resistance where in the past the market has reacted to favourably.
I am expecting again a strong reaction from this area.
I will not be going into the entry confirmation for this trade.
Stoploss is going to be at the high of the current daily candle.
Targets have been outlined within the screenshot provided.

EUR/NZD Sells Active - Swing Trade - Key Resistance 1.80500I have just taken a sell position on EUR/NZD expecting some good selling pressure over the next couple of weeks.
From a technical perspective we can see price has come into the 1.08500 level which is a key area of daily/weekly resistance where in the past the market has reacted from favourably.
I am expecting again a strong reaction from this area.
I will not be going into the entry confirmation for this trade idea.
Stoploss is going to be at the high of the current daily candle.
Targets have been outlined within the screenshot provided.

EURUSD#EURUSD
Good morning. Currently we do have short context on 1h timeframe. But on 4h,1d nothing changed yet. We do have have a lot of targets on HTF. Will try to work with short possitions with targets on Francfurt low.
EURUSD Buy/Long SignalEURUSD has been bouncing between channels for a while and shows strong signs for a nice bullish uptrend from support after a surge and moving average supporting theory. Below is the signals input. Please enter with proper risk and analyze prior to entry on your own discretion.
EURUSD
LONG/BUY
Entry: 1.07295
Stop Loss: 1.06431
Targets:
TP 1: 1.10063
TP 2: 1.16076
SWING TRADE
Risk: 2-5% of Capital
