SELL TRADE SETUP ON GBPUSDHey Traders,
Check this short opportunity on GBPUSD out..
The corrective wave completed and now anticipating for a breakdown of the flag might initiate the bearish continuation.
Watch out.
Fxsignals

EUR/USD Direction Unclear ECB Rate Hike Pace Divides InvestorsThe Euro currency is experiencing a lack of clear direction as investors hold conflicting opinions regarding the European Central Bank's (ECB) potential rate hike pace during its May monetary policy meeting. Some investors remain unconvinced that ECB President, Christine Lagarde, will reduce the pace of policy-tightening to 25 basis points (bps) during a time of critical Eurozone inflation.
From a technical standpoint, the currency has undergone a second retest of the 50% Fibonacci level after experiencing a pullback to the 61.8% level. This pattern commonly reflects an AB=CD formation, leading to the creation of a new swing high. Today's market developments will be crucial in determining the Euro's direction, and our forecast predicts a long setup.

GBP/USD Rises on UK CPI Data. Long Scenario.The GBP/USD pair is exhibiting bullish tendencies and has made strides towards the 1.2450 level in the early hours of Wednesday. The latest UK data indicates that the annual core CPI remained steady at 6.2% in March, surpassing the market's anticipated value of 6%, thus contributing to the appreciation of the Pound Sterling.
During the opening London session, the Pound experienced a slight retreat, falling to 1.24000. While lower timeframes suggest bearish momentum for the GBP/USD pair, the higher timeframes reflect a strong Pound. Today's market developments will be crucial in determining the Pound's position.

USD/JPY Pair Retracts from 5-Week High, Shows Bearish PatternThe USD/JPY pair has retreated from its almost five-week high, which was around the 134.60 region earlier on Tuesday. During the mid-European session, the pair continued its steady intraday descent. Spot prices have now fallen below the 134.15 mark in the last hour, which has caused a significant decline in the previous day's gains and put an end to a two-day winning streak.
Our analysis suggests that the USD/JPY pair is still within a Bearish Channel, with the price rebounding from both the upper and lower sides of the dynamic trendline. Furthermore, the trend in the Daily Timeframe remains bearish. Consequently, we anticipate a short impulse towards the lower side of the channel.

EUR/USD: Bigger Impulse Confirms Long Position on MaintrendIn accordance with our analysis from the preceding session, the EUR/USD currency pair has exhibited movement that aligns with our projections, demonstrating a significant impulse that corresponds with the established long-term trend and has resulted in the attainment of our initial take-profit target. Building upon this favorable outcome, we anticipate the potential for additional upward momentum, leading us to suggest a continuation of our long position in the direction of the main trend for the present day.

GBP/USD: Favorable Long Position on Upward MomentumIn accordance with our analysis from the previous session, the GBP/USD currency pair has exhibited movement consistent with our predictions, having achieved the initial level of take-profit. Moreover, the pair appears to be demonstrating rapid upward momentum, reinforcing our notion of a further sustained bullish trend. As such, our present recommendation is to consider initiating a new long position in GBP/USD in anticipation of continued price appreciation.

GBP/CHF Buy Setup - Potentially Heading To 1.14000I am in a buy position on GBP/CHF. I really like how the market is reacting to the 78.60% retracement area. I believe we will now be heading to 1.14000 great time to get involved in a buy at a nice discount.

EUR/USD Breaks Free from Pullbacks and Looks to Bullish Impulse EUR/USD has gained decently above the 1.0900 hurdle and broken free from two consecutive daily pullbacks, despite increased selling pressure on the dollar. Currently, the focus is on upcoming data releases. The possibility of further tightening by the ECB in May is still on the cards, with investors anticipating a 25 bps rate raise. However, some ECB policy makers have hinted at a larger rate increase in recent sessions.
Later in the day, the ZEW institute for Germany and the euro bloc will release their Economic Sentiment gauge, alongside trade balance figures for the euro area. In the NA session, the spotlight will be on housing data and a speech by FOMC’s M. Bowman.
As we explained yesterday, the price had a pullback to the 61.8% Fibonacci level, which coincided with a strong support area, and the dynamic trendline acted as additional support. Currently, the price is on an upward trend and we are expecting a fresh bullish impulse to emerge.

Don't miss out on the GBP/JPY Bull runYesterday, we discussed how the GBP/JPY had recently experienced a bullish rally, but had been in a consolidation phase for the past two days. During this period, the price appeared to be forming a reversal head and shoulders pattern, which caused some concern among traders. However, the pattern was invalidated when the price broke through the local resistance, leading to the formation of a bullish flag continuation pattern.
As of today, the price is pushing higher in the long direction setup that we had anticipated. We are currently on the lookout for a long setup, which we believe will present a profitable opportunity for our trading strategy. It is worth noting that the bullish flag continuation pattern suggests that the price may continue to rise, so we will be monitoring the situation closely and adjusting our strategy accordingly. Overall, we remain optimistic about the prospects for the GBP/JPY and are excited to see how the market will evolve in the coming days and weeks.

Bullish Trend Continues for GBP/USD PairThe GBP/USD pair is currently in an uptrend and has been continuing its rally despite experiencing a pullback at the previous 61.8% Fibonacci level. We have observed that the price has rebounded in this area, and our forecast remains bullish as we anticipate a new and fresh impulse to push the price towards the upside of the chart.
To elaborate further, it seems that the currency pair is gaining momentum, and traders can expect a positive trend to emerge. Based on the technical analysis, we can anticipate a steady rise in the GBP/USD price, which may be fueled by a range of economic factors, such as strong market sentiment and a robust global economy.
Therefore, we advise traders to stay vigilant and keep a close eye on the market as it evolves. The current trend suggests that the GBP/USD pair has a potential for further growth, and investors should capitalize on this opportunity.
In conclusion, the GBP/USD pair is showing signs of strength, and the market outlook remains positive. We recommend traders to exercise caution, but at the same time, take advantage of the prevailing bullish trend.

EUR/USD in Correction Mode: Potential Pullback Ahead.The EUR/USD currency pair has witnessed a decline in its value and subsequently bounced back from the 1.0975 region. Over the past week, the EUR/USD has been retreating from its recent highs in the proximity of 1.1100. This drop can be attributed to the correction in the upside movement of the dollar.
As of now, the price movement of the EUR/USD is expected to continue to follow the dynamics of the dollar closely. It is also expected to be influenced by the diverging intentions of the Fed and ECB banks regarding potential interest rate changes.
Despite the hawkish stance of the ECB, which supports further rate hikes, there seems to be a loss of momentum in economic fundamentals in the region, which contrasts this view.
Our analysis suggests that the EUR/USD might experience a pullback in the 50%-61.8% Fibonacci area before setting up for a new long position. However, if the price falls below the 78.6% Fibonacci level, it could indicate a short entry opportunity.

GBP/JPY Faces Bearish Chart Formation with Mild Gains: AnalysisAt the start of the London trading session on Monday, GBP/JPY shows a slight increase in value, hovering around 166.50. However, the cross-currency pair is facing a challenge in maintaining its upward momentum over the past four days, as it is currently caught in a bearish chart pattern, known as the Head and Shoulders pattern.
If the dynamic trendline of the pattern, referred to as the "Neckline," is broken, this could confirm a downside trend for the pair. However, if the price manages to rise above the level of the Right Shoulder, it may indicate a long setup.


Strong Buy on Gold Gold has respected the yellow trendline with multiple touches in the past and todays high impact news pushed gold sweep liquidity till the levels of 1995 which saw the rejection and FVG (Fair Value Gap) which was marked off along with bullish engulfing candlestick pattern formation as my three confirmations.
1.Trendline retest
2. FVG
3. Bullish engulfing
4. Liquidity to the upside

USD/JPY Bears Eye Downward Trend as US Dollar Faces PressureThe current market for USD/JPY is dominated by the bears, who are eagerly anticipating a continuation of the downward trend. At this crucial moment, the trendline support is highly vulnerable. As Tokyo traders enter the market on Friday, the price of USD/JPY remains stagnant, resting below a significant resistance area near 132.70 on the 4-hour charts. The US Dollar is facing pressure, mainly due to the week's data that has led to the belief that the Federal Reserve will pause in its tightening policy campaign, with just one last rate hike scheduled for May.
The primary focus of the market has been on the inflation data, with the Consumer Price Index (CPI) showing a year-on-year decrease from 6% in February to 5% in March. Furthermore, the Producer Price Index (PPI) for final demand, which was released on Thursday, also indicated a continued decrease in inflationary pressures, with a 0.5% drop last month. Over the twelve months leading to March, the PPI increased 2.7%, representing the smallest year-on-year rise since January 2021, following a 4.9% increase in February.
In the event that the price breaks out of the dynamic trendline, we can expect to see a further pushdown in the price, moving in a downward direction.

EURUSD: Strongly Bullish Bias MaintainedYesterday, our long Take Profit (TP) for the EURUSD was successfully achieved, and we have now expanded the TP zone to encompass the 1.1060 level, where the price could potentially rise in the coming days. Our trading bias remains decidedly bullish for the days ahead.

Bearish Bias Maintained as USD/JPY Prepares for Potential DropAfter successfully implementing yesterday's trading idea, the USD/JPY is currently profitable. However, a new bearish momentum may be on the horizon, and as a result, we have updated the Take Profit (TP) target to reflect a potential drop in price. Our trading bias remains bearish, given that the EUR/USD is currently showing growth.

EUR/USD Shows Potential for Growth...In the early Asian session today, the EUR/USD currency pair made a noteworthy move by touching the psychological resistance level of 1.1000. This marks the first time in over two months that the major currency pair has reached this level. While the pair is facing obstacles in extending its rally beyond this point, the upside momentum is still holding strong. This is partly due to the fact that the United States inflation has softened as predicted by market participants.
As of now, it remains to be seen whether the price will continue to rise throughout the day. Nevertheless, the current trend suggests that there is potential for further growth.

EURUSD Bullish Uptrend: New Long Position IdeaThe EURUSD currency pair is exhibiting a continued upward momentum today, favoring the existing bullish uptrend. As a result, our team has formulated an insightful analysis, proposing a new long position to align with the prevailing trend.

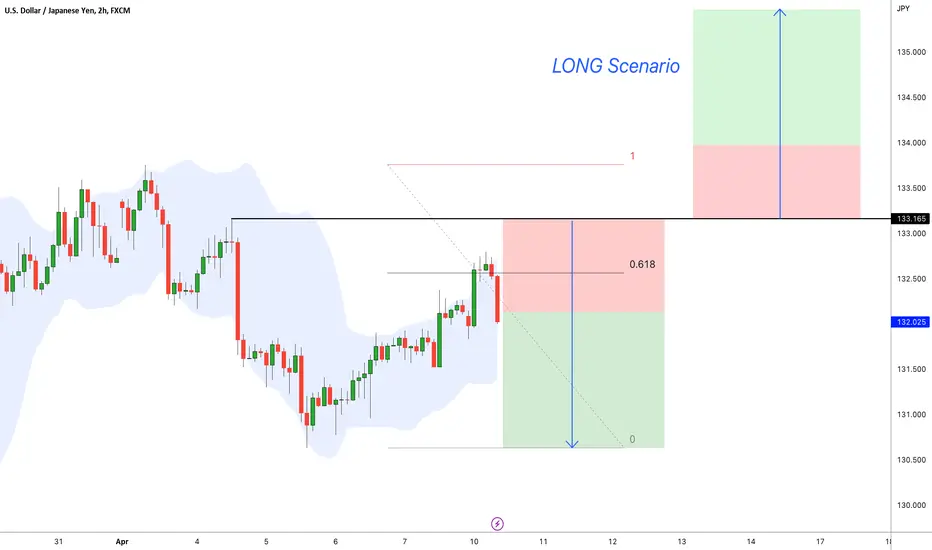
USD/JPY Divergence: Short Setup ScenarioHello traders,
Today, I have observed a divergence in the USD/JPY currency pair, and based on my analysis, I propose a new short setup for this pair. However, if the price manages to break the resistance level at 134.20, it will invalidate the short setup, creating room for a long scenario.
Thank you for considering my analysis, and happy trading!

GOLD Pullback at $1990: Opportunity for Long ViewHello Traders, Gold has recently experienced a pullback around the $1990 area, where it coincided with the 50% Fibonacci levels. This seems to be a good entry point for the continuation of the uptrend rally, following the main trend. We anticipate a fresh pullback in the long view.

EUR/USD Following Bullish Trend - Fresh Long Impulse Expected Hello Traders! In our last idea, we predicted a pullback in the EUR/USD around the 38.2% Fibonacci level, and it seems like our prediction is coming true. The price is currently following a bullish trend, and we may see a new long impulse very soon.

Short Continuation Bias for USD/JPYHello traders! As we discussed in our last idea, the USD/JPY is currently experiencing a bearish trend and has already reached the 61.8% Fibonacci level. We anticipate further downward movement in the market and maintain our bias for a short continuation.