USDCAD Sell/ShortPrevious USDCAD post was taken down for reasons. I did call a Sell/Short however is not visible to see no longer. My analysis was on point and we did short at the top. Please continue to follow the signal that is now posted for a great profitable session. Shows clear downtrend M formation and has a classic meltdown from here after a multi-pump day.
USDCAD
Sell/Short
Entry: 1.37887
Stop Loss: 1.38330
Targets:
TP: 1.36803
DAY TRADE/SWING TRADE
Risk: 2-5% of Capital
Fxtrading

eurusd#EURUSD
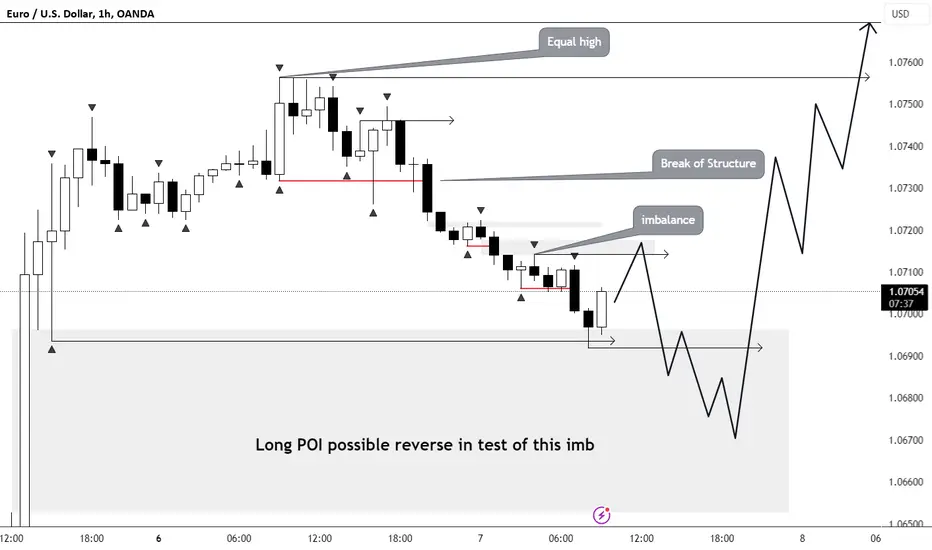
Preferably work with long positions for today, Everything what I saw yesterday is similar to building of liquidity, for further removal.

#GBPUSD#GBPUSD
The pound seems similar to the euro, but there are a few differences:
We have reached the logical target on the daily timeframe.
The context has changed on both the 1-hour and 4-hour timeframes.
The pound appears more suitable for short positions due to the achieved targets on the higher timeframe, as you mentioned.
EURUSD#EURUSD
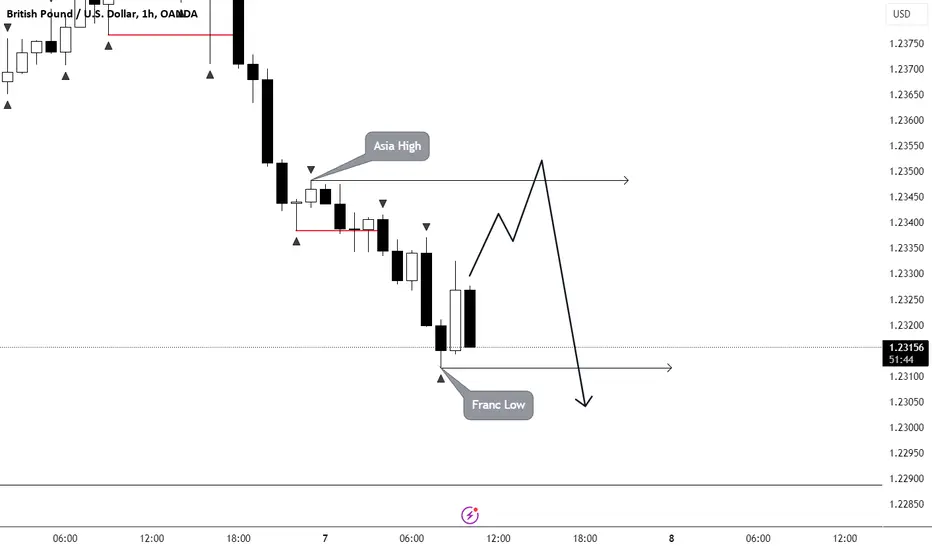
Good morning. Currently we do have short context on 1h timeframe. But on 4h,1d nothing changed yet. We do have have a lot of targets on HTF. Will try to work with short possitions with targets on Francfurt low.
BluetonaFX - USDJPY Approaching Trendline Support BreakHi Traders!
Due to the weak NFP jobs data last Friday, there is further pressure on the US dollar. USDJPY is back under 150 and trading with bearish momentum.
Price Action 📊
The market's price action on the 2H chart is currently bearish. The market broke below the 20 EMA, failed to break back above in the re-test, and is approaching the trendline support with potential for a break and close below the trendline to continue pushing down.
Fundamental Analysis 📰
There were weak US major figures recently posted, with weaker than expected PMI figures and Non-Farm jobs data. The Fed also failed to commit to further interest rate hikes, which has left traders nervous about the US dollar.
Support 📉
149.273: TRENDLINE SUPPORT
148.805: MONTHLY LOW
Resistance 📈
149.736: PREVIOUS DAY'S HIGH
149.817: 20 EMA
Risk ⚠️
No more than 2% of your capital.
Reward 💰
At least 4% of your capital.
Please make sure to click on the like/boost button 🚀 as your support greatly helps.
Trade safely and responsibly.
BluetonaFX

#GBPUSD#GBPUSD
there is a similar situation on the pound, but with the way we are moving, the PDH may initially be lifted, in any case, I refuse to work short at the moment for objective reasons.
Currency Pair: GBP/AUD SellTrading Plan/Signal
Currency Pair: GBP/AUD
Action: Sell
Entry Price: 1.88326
Stop Loss (SL): 1.94732
Take Profit 1 (TP1): 1.85227
Take Profit 2 (TP2): 1.72405
Reasoning:
The trading plan involves selling the GBP/AUD currency pair. Here's the rationale behind this decision:
Head and Shoulders Reversal: The analysis has identified a head and shoulders reversal pattern. This pattern typically indicates a potential trend reversal from an uptrend to a downtrend. The left shoulder and the head form higher peaks, while the right shoulder forms a lower peak, creating a bearish signal.
Downtrend Anticipation: The head and shoulders pattern suggests a bearish sentiment in the market, indicating a potential downtrend in the GBP/AUD pair.
Trading Strategy:
Entry: Enter the market with a sell order at 1.88326, as this is the point where the reversal is anticipated to start.
Stop Loss (SL): Place a stop loss at 1.94732. This level is set to limit potential losses in case the market moves against the trade.
Take Profit 1 (TP1): The first take profit level is at 1.85227. This is where the initial target for profit-taking is set, anticipating a portion of the potential downtrend.
Take Profit 2 (TP2): The second take profit level is at 1.72405. This level represents a more significant target for profit-taking, in line with the expected downtrend.
Risk Management:
Risk-reward ratios have been considered in setting the stop loss and take profit levels.
Always trade with a risk that you are comfortable with and that suits your overall trading strategy.
Regularly monitor the trade's progress and consider adjusting stop loss and take profit levels as the market develops.
Please note that forex trading carries inherent risks, and it's essential to use proper risk management and only trade with funds you can afford to lose. This trading plan is for informational purposes and should not be considered as financial advice

EURUSDHello, everyone. I suggest looking at the EUR/USD pair. Starting with the weekly timeframe, we've broken the short structure and established ourselves above the fractal BOS. Transitioning to the daily timeframe, on Friday, we once again confirmed the structure and continued the upward movement. For the upcoming week, I anticipate a correction to the highlighted imbalance zone with the potential for a new high next week.

EURUSD: Detailed Technical Outlook 🇪🇺🇺🇸
Multiple time frame analysis for EURUSD.
Daily/4h/1h outlook.
Price action & important key levels.
Bullish bias explained.
❤️Please, support this video with like and comment!❤️

EURUSD#EURUSD
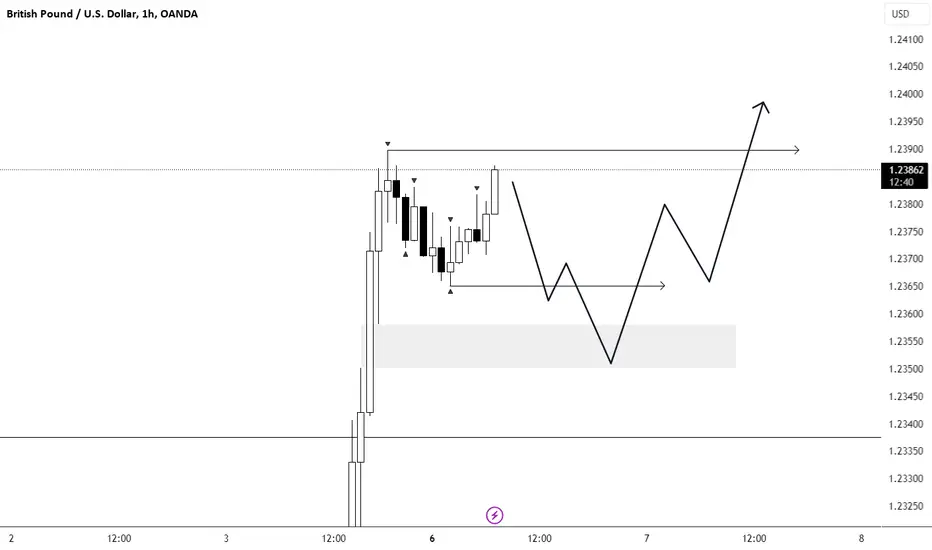
1d+1h context confirmation - long.
will try to work with long possitions from asia low

GBPUSDHello everyone!
Day plan is to work with fractals bellow as i show on chart. I guess we will see good reaction on NY session

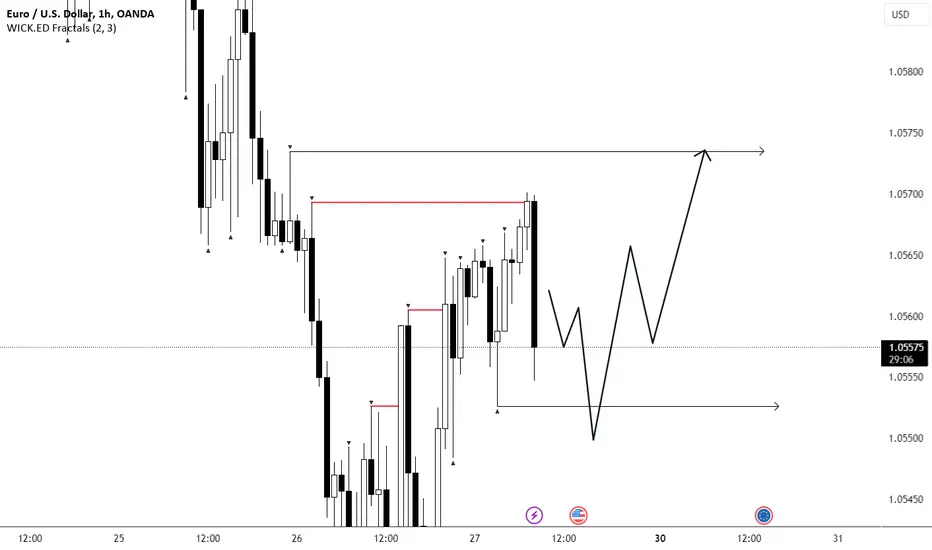
EURUSDhello everyone!
day plan for today is to work inside imbalance 4h with potential long possitions

EURUSDHello, everyone!
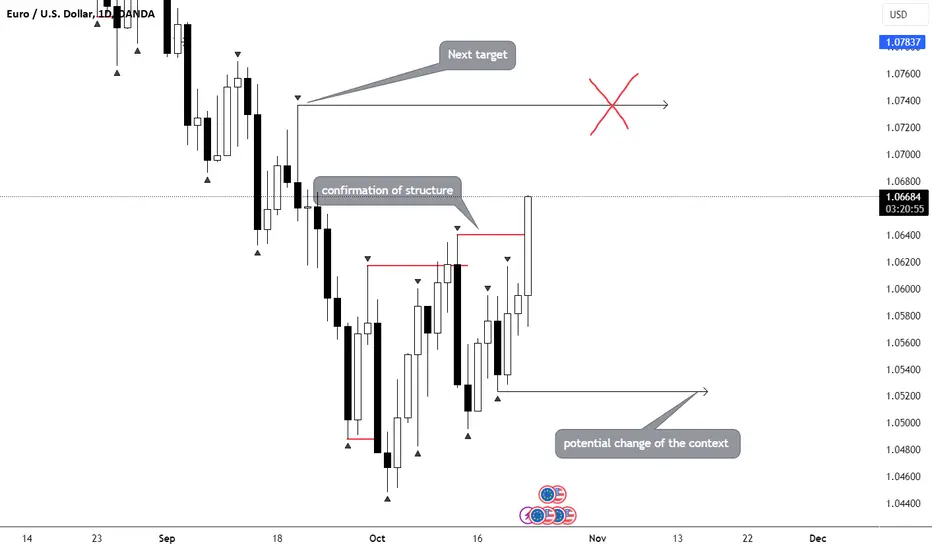
Today's price movement has confirmed the bullish context on the higher timeframe. I anticipate further continuation with potential targets marked on the chart.
I also do not exclude working with liquidity in the lower price ranges.
I wish everyone a profitable week!
SasanSeifi 💁♂️GBP/USD👉4H 1.22700 / 1.23Hey there! As you can see, the price is currently trading within the range of 1.22. In the 4-hour timeframe, here's a scenario to consider: The price may continue to exhibit positive fluctuations as it approaches the liquidity gap. Following this, after a minor correction and, upon confirmation, as well as renewed liquidity accumulation, we could potentially witness further price growth towards the resistance levels at 1.22700 and the price range of 1.23. Potential trends in the chart above have also been highlighted.
Moreover, if the price falls below the LOW1.21 range and consolidates, there's a possibility that the outlined scenarios may not materialize.
✨What's your opinion? Do you agree?
🔵Remember, always conduct your own analysis and consider other factors before
making any trading decisions. Good luck!"✌️
❎ (DYOR)...⚠️⚜️
Sure, if you have any more questions or need further clarification, feel free to ask. I'm here to help!
if you found my analysis helpful, I would appreciate it if you could show your support by liking and commenting. Thank you!🙌✌

EURUSD#EURUSD
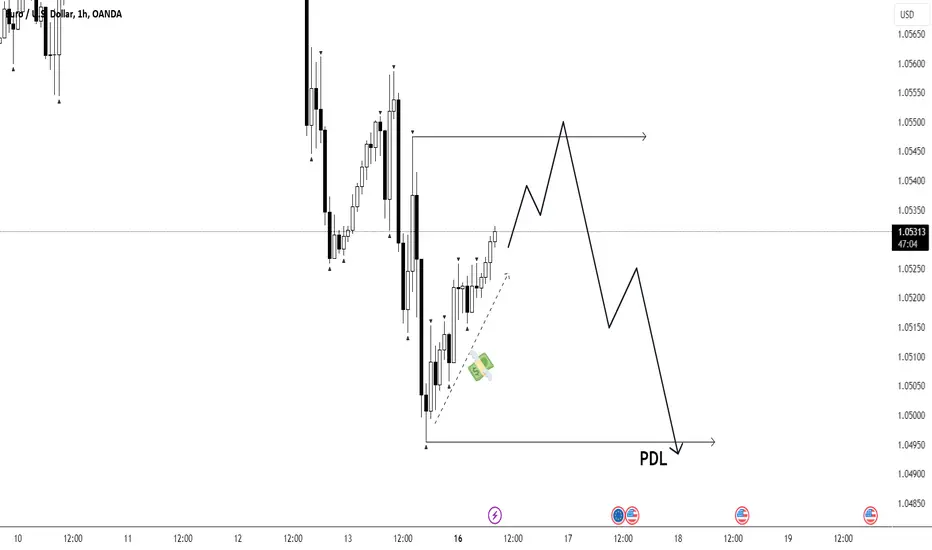
We definitely have a strong short context confirmation on all timeframes, as well as the absence of working with liquidity below
Target is PDL - the question of timing

EURUSD#EURUSD
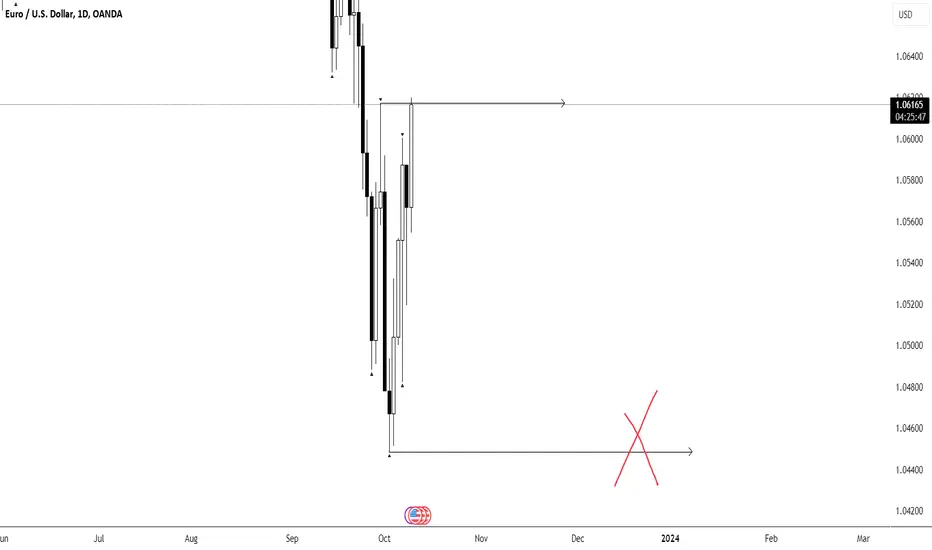
only two potential scenarios for the development of events (black and red).
Let's start with black, which I'm more likely to lean towards. Raid of a highly liquid fractal high with potential continuation of movement.
red - price fixation above the fractal maximum, after which the entire current order flow will act as strict liquidity, in which case all short positions will not make much sense.
Question is the same sweep or BOS?
CADCHF: Is That a Bullish Setup ?! 🇨🇦🇨🇭
Have a look at that high momentum bullish candle that was formed
on a 4H time frame after a test of a rising trend line on CADCHF.
It is the important sign of strength of the buyers.
The pair may start growing now.
Goals: 0.670 / 0.673
❤️Please, support my work with like, thank you!❤️

SasanSeifi 💁♂️ 🟡 XAUUSD /weekly◼In the weekly timeframe, as you can see, the price has been in a corrective phase since it fell below the $2060 range. After experiencing some positive fluctuations, it has once again entered the FAIR VALUE GAP zone. Currently, it's trading around $1851, and the overall trend in the weekly timeframe is bearish.
If the price continues to stay below the LOW of the $1885 range and the weekly candle closes strongly bearish, we can expect that the price will continue its correction in the medium term towards the support levels at $1830, $1800, and $1780. To get a better understanding of the price's future movement, we need to monitor how it reacts to these support levels. If the support levels hold and are confirmed on lower timeframes, there might be some partial positive fluctuations.❗❗
◼On the other hand, if the support ranges break down, the possibility of a more significant correction in the long-term timeframe could be considered.❗
⭕The important resistance range is $1890 to $1918.
✨What's your opinion? Do you agree?
🔵Remember, always conduct your own analysis and consider other factors before
making any trading decisions. Good luck!"✌️
❎ (DYOR)...⚠️⚜️
Sure, if you have any more questions or need further clarification, feel free to ask. I'm here to help!
if you found my analysis helpful, I would appreciate it if you could show your support by liking and commenting. Thank you!🙌✌

BluetonaFX - GBPAUD Descending Triangle SHORT IdeaHi Traders!
The bearish price action continues on the GBPAUD 1D chart, and there may be possible opportunities for short entries.
Price Action 📊
The market has had lower highs and lower lows since breaking below the 20 EMA, creating a descending triangle pattern on the chart.
We are looking for further bearish momentum to break and close the trendline support line and continue to the downside.
Fundamental Analysis 📰
The market's outlook on GBP is currently negative due to weak economic data recently released. The outlook on the GBP looks very negative at the moment, and the demand for the currency is very low.
Support 📉
1.88514: TRENDLINE SUPPORT
Resistance 📈
1.92527: TRENDLINE RESISTANCE
Risk ⚠️
No more than 2% of your capital.
Reward 💰
At least 4% of your capital.
Please make sure to click on the like/boost button 🚀 as your support greatly helps.
Trade safely and responsibly.
BluetonaFX

GBPJPY Sell/ShortGBPJPY
SELL/SHORT
Entry: 181.972
Stop Loss: 183.208 (75 PIPS)
Target:
TP: 176.511
SWING TRADE
Risk: 2-5% of Capital

Reversal Chart Pattern: WedgeWhat this chart pattern shows us is a loss of trend strength and a deceleration in price movement.
The most achievable projection for setting our take profit will be the maximum width of the pattern, which occurs at the beginning of it. Alternatively, you can take the level that marks the start of the correction as a profit-taking point.
As for the stop-loss level, it will depend on the type of entry made in the trade, whether it's a high-risk entry or a reduced-risk entry.
(Like any other pattern or indicator, this one provides a signal of a possible market move. Therefore, the greater the number of confluences, the higher the probability that the observed scenario will occur). 💼💹 (🇬🇧)
