AUDCHF primed for shorts soonPrice is in Resistance zone and hitting 3rd touch of the trendline. Also 50 EMA + 50 fib in confluence
Fxtrading

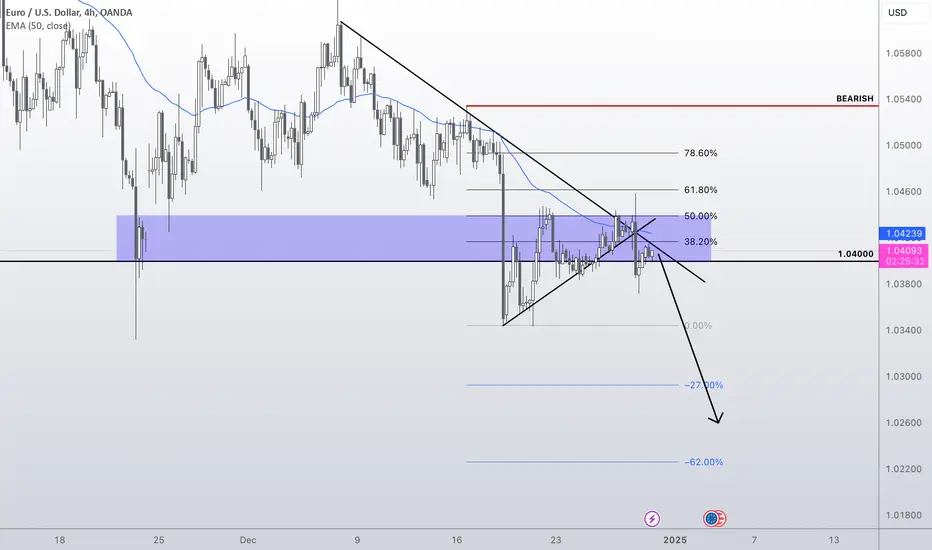
Shorting Euro DollarPrice has consolidated in SNR zone for the past few days. Creating a double top and a break of a counter trend line. Shorts incoming
GOLD (Final Projection for the year 2024)We simply anticipate Gold pushing upwards towards the zone in ash. Afterwhich we expect to see a good confirmation and then some massive price drop.
Do ensure you compare every analysis with your own technical approach.

BTC - Short SetupMy main trading principle is that the price always moves from swept liquidity levels to untouched liquidity levels.
In particular case we clearly can see the following context: price swept 1D key liquidity level and left untouched equal lows lower.
But to take more statistically more probable trades we should wait for some type of lower timeframe confirmation, and it this case we can notice sign of weakness, so potentially there is a higher probability to see price lower.
Your success is determined solely by your ability to consistently follow the same principles.

Continuation towards the upside?Risky EOM & EOY trade. Looking for a continuation towards the upside. Price looks like it's rejecting off the H4 SNR zone with a trendline and psych level as confluence

EURUSD ShortsPrice in resistance area, forming a H&S of a H4 bearish trend. Given the fact that it's nearing EOY, this is deemed as a more riskier trade

USDJPY Possible LongsConfluences:
Daily Level
38.2
156 Psych
4hr retest on trendline
This is a calculated trade as it's nearing the EOY.

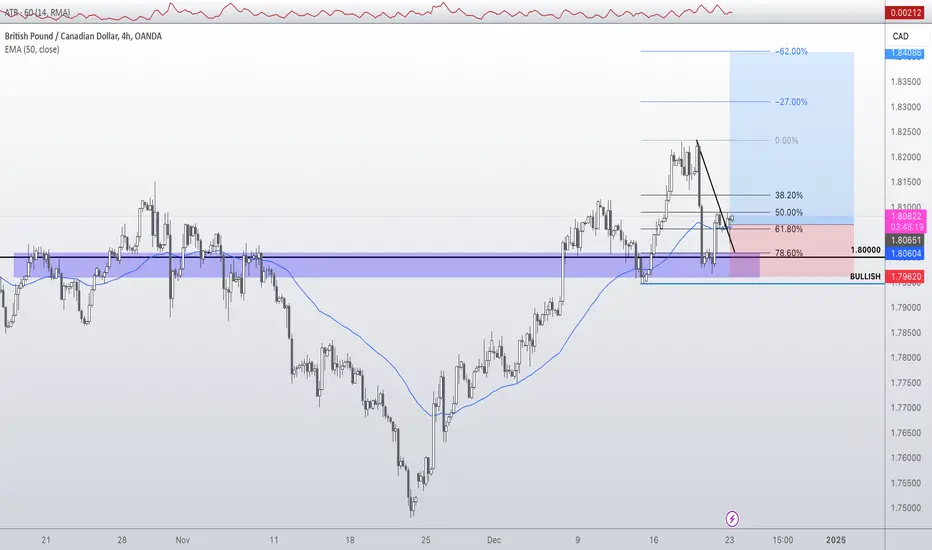
GBPCAD LongsTook longs on GBPCAD. Price came into a demand zone. Double bottomed with a H4 engulfing. Looking to aim for the - 62 for a 1:3 R:R. Will look to manage trade once price hits the 0 and -27 fibs
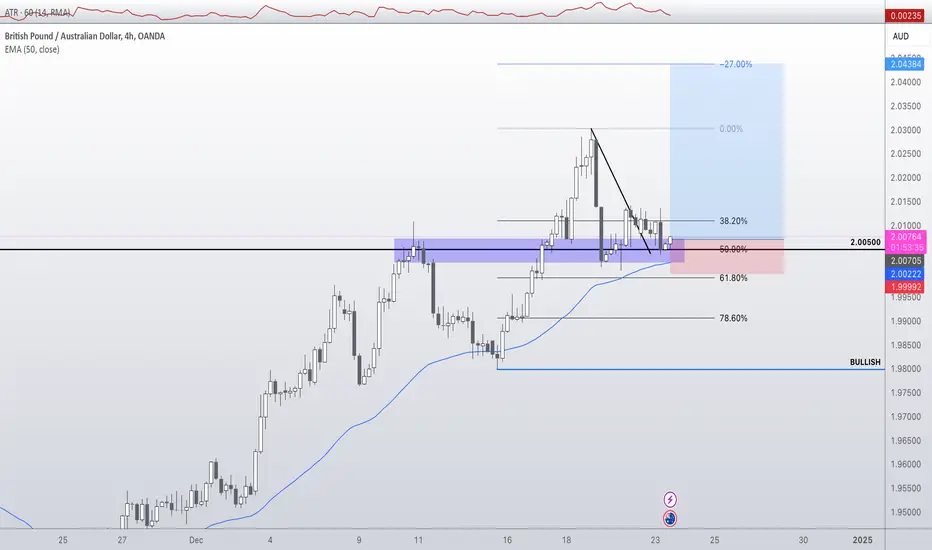
Risky LongsBecause we are closer to EOY, trading is generally more risky. But looking at longs on GBPAUD now.
Confluences:
- 2.00500
- 50 fib
- H4 SNR
- H1 Double bottom & retest on neckline
NZD/USD Bears Remain in ControlSince early October, sellers have largely taken control of the NZD/USD (New Zealand versus the US dollar) and sent price to lows not seen since late 2022, with limited pullbacks seen. Overall, the currency pair is down nearly 10% from October highs.
Ichimoku Resistance Supporting Sell-On-Rally Setups
What is technically important to recognise is that the current downtrend remains supported by the area formed between the Ichimoku’s Conversion Line (blue at US$0.5830) and Base Line (red at US$0.5892). Consequently, as long as the pair continues to explore lower levels, any pullback will likely prompt traders to closely monitor price action for signs of bearish intent from within the aforementioned area.
Adding to the bearish outlook for the NZD/USD, in addition to the 200-day simple moving average (US$0.6050) rotating lower, and price crossing south of the line in early October, it is clear that the Ichimoku’s Leading Span A (light green at US$0.5861) crossed below the Leading Span B (light orange at US$0.6012). This provides a bearish signal and helps establish another resistance area that investors will watch closely should a deeper pullback come to fruition: the Ichimoku Cloud.
Price Direction?
With the downtrend clear, should a pullback to resistance at US$0.5816 materialise – which, at that point, will likely line up with the resistance area between the Ichimoku’s Conversion/Base Lines – this could be an area that sellers are drawn to.

Australian Dollar Looks Like a Good Investment Well, now that Australian unemployment surprisingly dropped it gave the central bank’s hold-steady stance on rates some creedence. With Aussie sitting in the lower portion of ranges (E.G. here with AUDCHF)I like buying and holding the asset for longer time horizons. Small sizes, and take profits at levels, like the 200 MA, and jumping back in on pullbacks.

XAGEUR - Short SetupMy main trading principle is that the price always moves from swept liquidity levels to untouched liquidity levels.
In particular case we clearly can see the following context: price swept 1D key liquidity level and left untouched level lower.
But to take more statistically more probable trades we should wait for some type of lower timeframe confirmation. For me the best way to confirm higher timeframe context is structure.
We can notice the break of market structure (sign of weakness) on key liquidity level, so there is a higher probability to see price lower at least on opposite level (marked lower).
Your success is determined solely by your ability to consistently follow the same principles.

Crude Oil - High Tide Pt.2Pt 1 found here .
This is an extremely critical market at this time. What must be understood, is NYMEX light crude oil is not its' own independent market, but rather a BENCHMARK for a larger market for crude oil globally, and its' derivatives. Consider a Kenyan bank, that owns a loan on a Kenyan gas station. What is the best instrument to hedge their investment? Well, obviously the answer is NYMEX:RB1! , NYMEX gasoline futures. The sovereign bond of gasoline prices so to speak.
Examining the market technically, we see that it appears bullish. The market experienced a severe panic in price during 2020, as demand and logistics collapsed in face of a global epidemic. However the price has recovered considerably, due to OPEC controls and the global necessity for this commodity. In fact, the market has even retested attempts made at reaching its 2008 high.
Many local market do not have access to global markets as might be expected, such as the NYSE and CME to conduct their day-to-day affairs. This highlights the importance of NYMEX:CL1! globally, not only for the physical delivery of light crude in the United States. But the global marketplace for light crude oil and its' derivatives, such as plastic containers, heating oil and cosmetic products. The reference price for such items by suppliers, is naturally the most liquid benchmark available to them. Which is to say, they will sell their product based on the most available market for their ingredients. A notion common in all business, to be examined at a global level to understand the relevance of this market into the future. This market exists in the United States, which is what underpins the importance of the US Dollar as this principle applies to all commodity and equity benchmarks. Furthermore, the principle of liquidity remains relevant all through history, where commodities as long as trade exists have been priced according to the most liquid benchmark.
The relevance of the US Dollar can most clearly be observed in global bond markets. As capital becomes scarce as Quantitative Easing globally comes to an end, and begins to flow towards the USA, creating the rally in $TVC:DXY. Rates in sovereign debt markets in the US and abroad have risen, and prices have fallen. A lack of demand in sovereign debt outside the USA is being realized, as FRED:RRPONTTLD RRP usage has risen since the beginning of the war between Ukraine and Russia. Because the USA is also the global benchmark for interest rates, due to its deep liquidity. Banks all around the globe balance and hedge their local debt based on this proxy market. For all intents and purposes, this is the only game in town.
It may seem odd that the price of crude oil in US Dollars has risen, given that the value of the US Dollar has risen significantly worldwide. Inflation domestically might dictate that the price of NYMEX:CL1! should fall, but this has not been the case. There is something beneath the surface, that indicates a deep value in this trade yet to be realised. Despite governments and activist organisations fighting against the product, its relevance in commerce has not diminished. Coupled with the importance of this global benchmark, the whole of oil-based product globally appears as important as ever. The market indicated last week the potential for a turning point, as it has capitulated. Traders should consider the market will likely make another low, but appears to be setting up for a rally.

Trade idea - EURJPY Long4H time frame
Deceleration box received at entry zone.
Instant market execution Buy.
1.5% risk.
Aiming to take full profit at Daily TP level.

Trade idea - USDZAR Long4H
Deceleration box received at entry zone.
Instant market execution Buy.
1.5% risk.
Full profit at 4H TP.
Would be enough to complete prop firm challenge.

Trade idea - EURGBP Long 4H
Deceleration box received at entry zone.
= Instant market execution Buy.
1.5% risk.
Aiming to take full profit at Daily TP.

Trade idea - NZDCHF Long4H
Inverse Head & Shoulders potentially in play.
Clear support & resistance zone is there.
Interesting scenario from a 1H perspective as well with an Inverse Head & Shoulders pattern as well.
Corrective approach towards entry zone.
-68 Fibonacci completion aligning with entry zone.
= Confirmation to enter. Instant market execution Buy.
1.5% risk.

Trade idea - XAGUSD Long4H
Bullish M pattern can potentially play out.
Clear support & resistance zone is there.
Corrective approach towards entry zone.
Market moving in Bull Flag formation towards entry zone.
More clear from a 1H perspective:
= Confirmation to place Buy limit.
1.5% risk.

EUR/USD Analysis Update: Impact of Election OutcomesIn light of recent developments, particularly the election victory of Republican candidate Donald Trump, market sentiment has shifted significantly. As anticipated in my previous analysis, this outcome has fueled optimism, contributing to a further decline of the EUR/USD pair by over 130 pips.
The so-called "Trump trade" continues to support the strength of the USD, as the Republican sweep of both the House and Senate clears the way for the implementation of Trump's policy agenda. From a foreign exchange perspective, this is likely to result in increased fiscal spending, tariffs, and tighter immigration rules. These factors are expected to sustain the DXY (Dollar Index), along with upward inflation pressures that could keep interest rates higher than previously projected.
From a technical standpoint, the bearish trend remains firmly in place across all timeframes:
Daily (D1) Chart: The price action recently broke below the lower boundary of a two-year-old neutral rectangle at approximately 1.0670. This breakout signals further downside potential, with the next key support level at 1.0500, which I expect to be tested by the end of the year.
Weekly (W1) Chart: The price action failed to break below the important support level 1.0640. If this level is breached, the next support at 1.0450 comes into play, indicating the potential for further declines.
Monthly (1M) Chart: Notably, an interesting pattern emerges from historical performance in the last three months of election years. In years when a Democratic candidate won (2012, 2020), the EUR/USD recorded an approximate rise of 4.8%. Conversely, during Donald Trump’s first presidency in 2016, the EUR/USD fell by 4.6% during the same period. If this pattern holds for the October-December timeframe of 2024, we could see the EUR/USD reach levels as low as 1.0425 before a potential correction at the beginning of 2025.
As you've likely heard many times recently - the next few weeks will be critical - in determining whether these levels hold or if we see a more significant breakdown.

Trade idea - EURHUF Long4H
Corrective approach towards entry zone.
-68 Fibonacci completion aligning with entry zone.
= Confirmation to get involved. Instant market execution Buy.
Bullish Fake Out Flag pattern as extra evidence also there.
1.5% risk.
Aiming to take full profit at Daily TP.

Trade idea - GBPJPY Long4H
Corrective approach towards entry zone.
Market moving in Bull Flag formation.
= Confirmation to place Buy limit.
1.5% risk.
Aiming to take full profit at Daily TP.

Trade idea - AUDUSD Long1H
Corrective approach towards entry zone.
Market moving in Bull Flag formation.
-27 Fibonacci completion aligning with entry zone.
= Confirmation to place Buy limit.
1.5% risk.
Aiming to take full profit at Daily TP.

Trade idea - AUDCAD Long4H
Corrective approach towards entry zone.
Fibonacci completions aligning with entry zone.
= Confirmation
Instant market execution Buy.
1.5% risk.
Aiming to take full profit at Daily TP.
