NASDAQ100US100 has been up since todays market open. I would like to see a significant drop from current price, as it has reached resistance zone, remember to use proper risk management, Lets Download Success.
Fyp

GER30GER30 has been going up for a while now, I am interested seeing it drop, but before it drops, I will be happy to see a small retracement up, thats where we will be executing trades, sniper entry or nothing, Lets Download Succes s

NASDAQ100NASDAQ100 has been falling hard lately, we are going to trade a small bull move. Lets be patient and wait for retracement to our entry zone. Sniper entry or nothing. Use proper risk management. Lets Download Success.

XAUUSD/GOLDGold has been falling hard lately. I will be happy to see it fall more from here, the precious metal is at bearish trend as we speak. Let it fall. Use proper risk management, Lets Download Success

BTC Back to Extreme Fear! What's Next?GM crypto bro's, this morning, the fear and greed index is back at 20 (extreme fear) while the stoch RSI remains in the oversold area. Yesterday's candle only reached 57,751; I thought it would go up to 58K, but it didn't.
Currently, BTC has the potential to correct to around the 53K area first, then pump to our initial target of 58K. But as always, the market is unpredictable.
I mentioned the potential correction to 53K before 58K, but it could pump strongly to 58K and then drop to 53K-52K. That's the excitement of the market, so always stay alert, crypto bro's.
Like always, keep in mind the market is dynamic. Don't be FOMO, stay safe, keep calm, and always remember that nothing is impossible in the crypto market. Anything can happen.
Always manage your risks, and as always, that's all for today's crypto update.
I'm Akki, signing off. Have a nice day.

USDJPYUSDJPY has been crashing too hard lately, I am will to take risking and try to trade against the trend, this will be a short term trade. I am waiting for a small pull back to my entry zone then i am inn. Use proper risk management, Lets Download Success

USDJPYIt seem like the pair ha finally found support. Let us buy at current market price. All ways lock your profits at TP1. August is never a good month to trade. Its gonna be choppy most of the times. Use proper risk management. Lets Download Success.

GBP USD TRADE SET UP GBP USD is falling from a supply level, a short sell has been executed now we wait for market probabilities

[EDU] Why Risking 5-10% a trade is sucidal?Hello fellow traders , my regular and new friends!
Welcome and thanks for dropping by my post.
Here are 5 reasons why it is too RISKY and you should'nt do it!
> Challenges to recover
- Large losses require proportionally larger gains to recover. A 50% drawdown requires you to have a gain of 100% to BREAKEVEN!
> Emotional Stresses
- Trading with such high risk can amplify your stress and anxiety. Fear and panic may set in during losing streaks, impairing sound decision-making and leading to impulsive actions.
> Account Blow-Up Risk
- You just need to have a string of 5-6 losses and that will be devasting to both your mental and capital, which could lead to margin calls.
> Reduced Learning Opportunities
- Excessive risk can limit the number of learning opportunities for a trader. If a significant portion of the trading capital is lost quickly, the trader may not have the resources to apply lessons learned from mistakes. Why not risk 1-3% a trade, if at 1% you have under your belt , 100 times to lose !
> Market Volatility Impact
- In volatile market conditions, high-risk strategies can be particularly vulnerable. Sudden price movements can result in larger-than-expected losses.What if you got caught in a black swan event? Ouch...That sucks!
Do Like and Boost if you have learnt something and enjoyed the content, thank you!
-- Get the right tools and an experienced Guide, you WILL navigate your way out of this "Dangerous Jungle"! --

NZDUSD; SWING LONG NZDUSD; Continuation of the swing long bias after a short retraction put to stop on the 0.38 fib level giving us the continuation confirmation of our bull run...
take profit to be taken at the bullish imbalance price line for a short holder

NZDUSD SWING LONG REVERSALNZDUSD; after having a bounce off the demand zone, now we expect the market to continue the reversal trend to the upside to the next barrier zone, expecting a possible continuation of the uptrend bias for a proper swing long...
TAKE PROFIT TO BE TAKEN AT THE NEXT SUPPLY ZONE

EURUSD ; NECKLINE BREAK AND RETEST FOR THE BEARSEURUSD; On the 4h tf we have a change of trend from the initial uptrend now we have a break and retest of neckline giving us a possible bearish bias mood for the swing traders
we can trade within the indicated supply and demand zones or wait for a closed candle below or above the current support zone... in other way we can decide to wait for sweep of liquidity at the $ zone before we joined the bear traders...

GOLD/XAUUSD - Wave 5 Incoming??Elliot Wave + FBMCBR
Continuation of Elliot wave cycle - Wave 5
Can take a look this trading idea and monitor the price can go up to my trading plan or not?

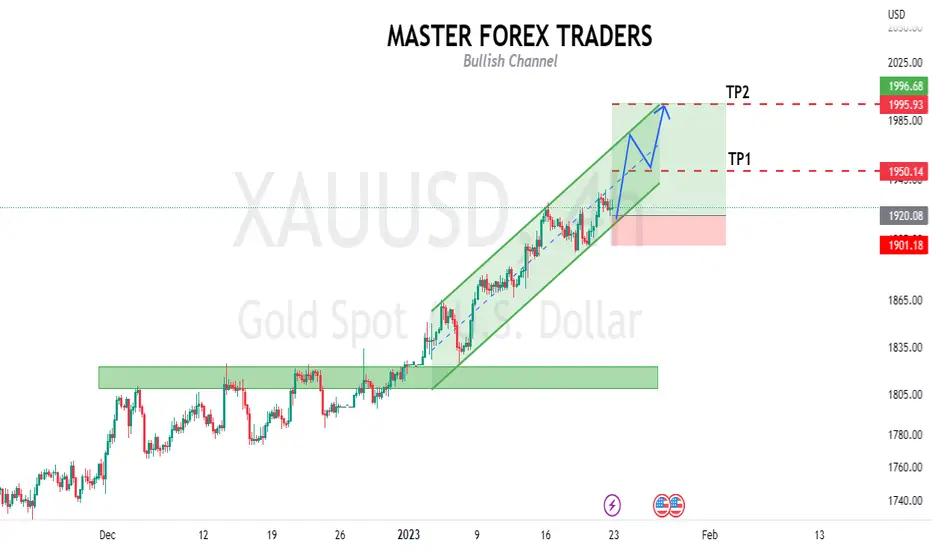
Bullish ChannelThe precious metal seems to fly high again since the beginning of the 2023 right after it broke the resistance and turned it into a support. A channel was formed, and it holds the price very well. We are hoping to see the price touch $2K again. Wish you all the best trading session. Let's Download Success
TrendlinesSXP500 has been trading in a bearish trendline for approximately full year now. We are currently witnessing the price touch at the trendline once more again, this may result into another bear movement in the coming days. If any movement gets against us, losses will be accepted when any candle breaks and close above the trendline. Wish you all the best. Let's Download Success.

Trendlines/Support&ResistanceNas100 has been trading in a strong trendline for a full year now, the price has also been trading in a support and resistance zones since from October 2022. The price has reached trendline and the resistance once more again. We may see a strong bear movement for the next coming days. If any movement get against us, losses will be accepted when any candle closes above the trendline. Wish you all the best. Remember to use the proper risk management. Lets Download Success.

H&SGBPAUD formed one of the most famous chart pattern Head and Shoulders. All short entries will be placed right after a candle breaks the neck and closes below. Wish you all the best. Lets Download Success

Bearish ChannelUSDJPY has been on a bearish channel since last year November, it seems like the channel is holding the price strong. I am currently looking for a short opportunity and patiently waiting for a touch or retest at the upper trendline of a channel. Wish you guys all the best remember to use proper risk management. Lets Download Success

TrendlineAUDNZD has been following a bearish trendline for almost 3 months now. We saw this strong trendline breaks few days ago, now we are aiming for at least 90% price recovery for the coming days. I wish you all a successful trading session. Dont forget to use proper risk management. Let's Download Success.

Trendline/Breakout/LastkissGBPCAD have broken a bearish trendline, we are currently seeing it right now trying to touch or retest the trendline once more again, this is what we call the last kiss strategy where you wait for a price retest of a broken trendline or zone so you can place your trades. In this case we are waiting for retest and place our trades if the price does not bounce back, we are not opening any positions. Wish you all the best. Let's Download Success

Bearish CrabNZDCAD has been on bullish trend for some time now, few days back we saw a rejection at the strong resistance with reversal candles. The prices have printed a bearish crab and already we have missed some pips down. However, it is not too late too jump in. This setup was supposed to published when the price was still at the resistance zone to avaoid risk management confusion. Wish you all the best. Let's Download Success.

Wedge/BreakoutNZDCAD has been trading strongly in a descending wedge, we currently witnessing a price break out at the top. This may indicate a bull run for upcoming week to the year end. Wish you all the best. Let's Download Success

Bullish ButterflyNZDUSD has on a bear trend since Feb 2021. Today we see price touch a support zone once again, we are likely willing to see the price prints a catalyst before we jump or confirm a Bullrun. Here is our bullish butterfly pattern to trade towards Feb 2023. Let's Download Success.
