Wooow DOGEUSDT breakout happening Major resistance which is 0.22$ and is also channel resistance is breaking and BINANCE:DOGEUSDT would be nonstop bullish after that at least for a while to the targets like 0.40$ and 0.60$.
As we can see on the chart here is last valid and strong resistance zone after that i am expecting nonstop rise for This token which is still sleep and soon will follow the market and also lead with daily +15% candles.
DISCLAIMER: ((trade based on your own decision))
<<press like👍 if you enjoy💚
GAIN

There's nothing better than everyone getting fresh cashWhole team wins on another steady uptrend 🙌 RGTI
There's nothing better than everyone getting in on the action and profit
Keep those Santa gifts coming all month long 🎅🎁

TON COIN WILL PUMP SOON !!! WITH 16$ TARGET we are really close to the TONUSDT pump
as we seen in weekly chart we are really bullish
in daily we can see obviously this important resistance but if we watch deeply we can see if we go over this exact price break, we are going to 16$ as fib said
don't miss it please!!!!

BRN scarcer than ever 🔥🐺Hello my friends ! 🐺
This is a massive opportunity for you my friend to at least 10X your trading portfolio and the reason behind this is :
at 18th April BRN is burning 90% of its supply and making it scarcer then ever so I think this is a best time to hold your tokens and maximizing your portfolio ;
Also if you looking the chart you can see an obvious AB=CD pattern which goes us to the ALL TIME HIGH price around 6$ mark .

Riding the Waves: Triumph on GBPUSDCelebrating success amidst the unpredictability of GBPUSD. Learn from victorious trades as we delve into the importance of patience and resilience in the face of market fluctuations. Each win is a testament to the power of strategy and mindset. Let's reflect on the journey and empower each other in the pursuit of trading excellence.

OMG CUP AND HANDLE(1d)(Bullish)chart says it all!
This is a Classic Huge cup and handle on the daily timeframe. Volume aligns as it should and the pullback looks great.
OMG was a huge contender in the past so i'm very excited

$GAIN Analysis, Key levels, and Targets $GAIN Analysis, Key levels, and Targets
GAIN is one of those stocks that will never come off my list… good growth and a monthly divy…. Yeah, as a trader I don’t get impressed with div stocks too much but this one is always in my portfolio….
And the bonus divs are always juicy…

GME TRADE SETUP - POSSIBLE 24% GAINI'm seeing potential for another GME 24% run in the near future.
The trade is going to be an entry sometime in the next few days @ or under 25.71
The sell price we are looking for is around $31.97
Orange lines are the previous 24% trade and need to be noted as possible resistance or support.

BTC Pressured Below $24,000; Is $26,000 conceivable?The present Bitcoin value examination is showing financial backers' combination mode. As the cost expands the earlier day's sideways development in a scope of $23,400 and $24,000. The greatest digital money by market cap has been exchanging with an unbiased to a somewhat bullish predisposition.
BTC cost exchanges higher with unassuming additions on Saturday.
The development of two-sequential candles recommends hesitation among brokers.
A solid obstruction playing around $24,200 and $24,400 zone.
As of composing, BTC/USD is perusing at $23,899.05, up 0.47% for the afternoon. The cost has been uniting beneath the $24,000 mark however the drawback is very much covered close $23,700. Assuming that the value figures out how to hold over the meeting's high of $23,978 more potential gain should be visible in the coin.
On the day to day diagram, the BTC cost examination shows that the cost has been exchanging a rising wedge development. A rising wedge is a negative continuation specialized design. Nonetheless, the cost is agreeable and sits over the basic 20-day and 50-day EMA's showing a bullish fundamental opinion.
An everyday close over the referenced level would make ready for the mental $26,000 level, This likewise concurs with the upper trendline of the wedge development.
The MACD oscillator shows that the bullish energy is supporting over the midline. The RSI (14) is right now exchanging close to the 59 level, which shows that the market is in bullish mode and is a long way from overheating. Any increase in the markers would reinforce a bullish breakout out of the ongoing union.
The 24-hour exchanging volume of BTC dropped over 18% to $32,530,459,847.
Then again, a break underneath the meeting's low would tempt bears to go into exchange. All things considered, the cost could meet the 50-day EMA at $23,191 followed by the low of July 24 at $22,263.

Update to my previous ADA IDEA (+10%)Here are the next key levels for breakouts.
Link to the previous chart
(.0432) entry

GMT brief gain 💡🚀Based on the chart, the price has been stuck in the channel and range market for a while ✔️
and now
it is close to support area, so we can see brief gain from our support 🚀
and
for long term trades, better to know that we will see more gain after the breakout of the channel resistance to the upside 🚀💡
Please, feel free to ask your question, write it in the comments below, and I will answer.🐋

EURUSD waiting for pump 🚀Based on the chart, the price is close to support area ✔️
and
after long time, we can see more gain from here 🚀
or
after brief correction to the downside, we can see more gain 🚀
our important resistance areas are located on the chart ✔️
Please, feel free to ask your question, write it in the comments below, and I will answer.🐋

BITCOIN after the break out of the resistance levels 🚀 Based on the chart, the price has broken the black trend line and the resistance area ($42500 t0 $44500) to the upside and became close to the major resistance ($44500 t0 $45500)
and now
we expect that the price soon will break the major resistance to the upside 🚀
and
our first target is $46000 to $47000 🚀
if
the price breaks the major resistance to the upside and stays above this zone (45000 to 47000) we will see more gain at least to $50000 area 🚀🚀
Before more gain, we can see brief correction ❌🧨
fundamental point
other sign for more gain could be the more buy position by the whales 🐳 and wallet that contains more than 100 bitcoin exactly like 2018 ✔️🐳
Please, feel free to ask your question, write it in the comments below, and I will answer.🐋

BABYDOGE bullish market 🚀Based on the chart, the price is close to important support area ✔️
we
can see more gain for the price form here 🚀
or
after brief correction tot the downside, we can see more gain 🚀🚀
this coin has wonderful potential and fundamental sign for gain 📖
and
soon we will have ATH for the price 🚀🚀🚀🚀
Please, feel free to ask your question, write it in the comments below, and I will answer.🐋

BITCOIN after the break out 🚀As I mentioned in my previous analysis based on technical and fundamental sign
the price has started to gain and hit the first target (the red trend line) 🐋💣🐳
and now
we wait for the breakout of the red trend line to the upside and more gain 🚀
if
the price stays above the red trend line ($42500 to $43500area) ✔️
and
breaks the resistance area($43500 to $46500) to the upside we will see more gain at least to $52000 area 🚀
before more gain, we can see brief correction ❌🧨
fundamental point
other sign for more gain could be the more buy position by the wallet that contains more than 10 bitcoin exactly like 2018 ✔️🐳

GBPUSD support area 🚀As I mention in my previous analysis
the price has started to gain from the channel support and become close to our first target 🐳💣🐋
and now
more gain expected, at least to our first resistance area middle of the channel 🚀

DOGE support zone 🚀Based on the chart, the price is close to weekly trend line and the resistance area
if
the price breaks the resistance area and the weekly trend line to the upside, we will see more gain 🚀
after
breakout, we can expect the retest of the trend line ✔️
and
other important resistance area are located on the chart ✔️
Please, feel free to ask your question, write it in the comments below, and I will answer.🐋

POWERPOOL more gain 🚀Based on the chart after long time, we can see appropriate amount of volume for the price and sharp candlesticks ✔️
if
this volume continues, and the price stays above the descending channel ✔️
after
a long time of correction to the downside, we can see more gain for CVPUSDT 🚀
Please, feel free to ask your question, write it in the comments below, and I will answer.🐋

LUNA (TERRA) LONG POSITION🚀🚀👍As I mentioned in my previous analysis ✔️
the price has started to gain based on our support area 💣🐳💣
and now based on the chart, the price is close to vital resistance area and the round number of 100 ✔️
we expect that soon the price will break the resistance to the upside, and we can see more gain 🚀🚀🚀
Please, feel free to ask your question, write it in the comments below, and I will answer.🐋

FANTOM close to channel support 🚀As I mentioned in my previous analysis ✔️
price hit the target 💣🐳💣
and now
the price is close to channel support, besides here we have weekly support area ✔️
we
can see more gain for the price 🚀
and
our next targets located on the chart close to weekly trend line and the channel resistance ✔️
Please, feel free to ask your question, write it in the comments below, and I will answer.🐋

GALA close to support 🚀Based on the chart, the price is close to support area and trend line ✔️
we can see more gain from the support zone 🚀
if
the price breaks the trend line to the upside, we can see more gain 🚀🚀
Please, feel free to ask your question, write it in the comments below, and I will answer.🐋

SLP long position 🚀Based on the chart, the price is close to important support area and the trend line ✔️
if
the price breaks the red trend line to the upside, we will see more gain 🚀
and if
the price breaks the support area to the downside, we can see more gain from the green trend line 🚀🚀
our important support and resistance located on the chart ✔️
Please, feel free to ask your question, write it in the comments below, and I will answer.🐋

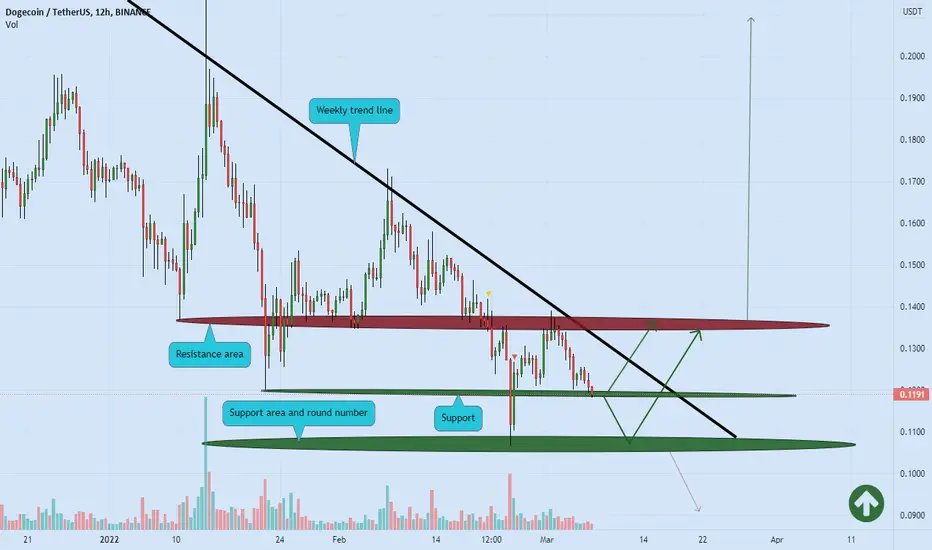
DOGE support zone 🚀Based on the chart, the price is close to round number (0.10) and two support area and one weekly trend line ✔️
we can see more gain from here or after brief correction from the round number 🚀
if the price breaks the weekly trend line to the upside, we can see more gain 🚀🚀
if the price breaks the round number, we will see more correction to the downside ❌🧨
Please, feel free to ask your question, write it in the comments below, and I will answer.🐋