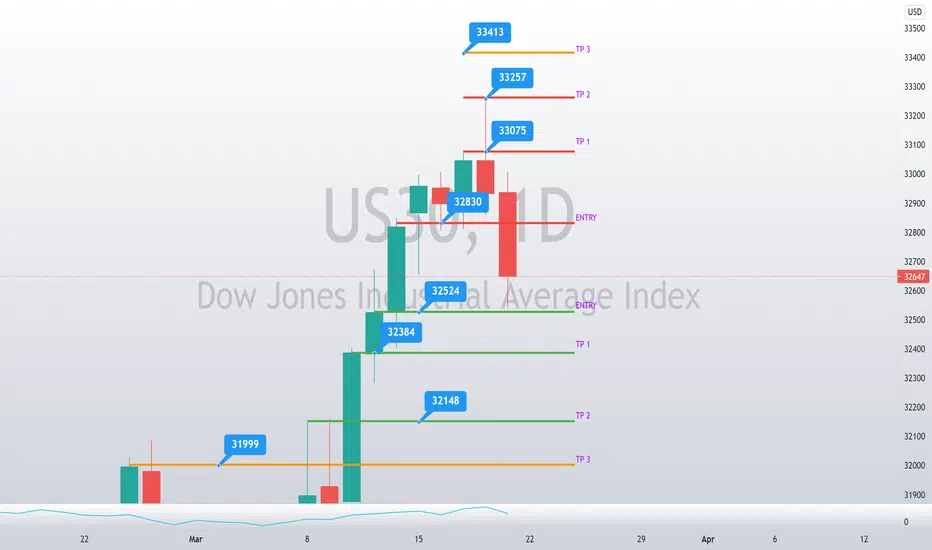
US30 UPDATED ENTIRESSimple Price Action strategy that covers both buys and sells so you can never miss an opportunity. Remember small losses for those big gains. US30 hit for more than 200 pips from last week's chart.
Look on my 'about me' or my bio for more information if you want to know how this works.
Message me if you want to know how to utilize my strategy. This can be used on any timeframe that you prefer.
When resistance breaks (red) enter for a buy
When support breaks (green) enter for a sell.
Bonus: Sell right before resistance breaks with a clear mfi indication (15-20 pip loss if it goes south)
Buy right before support breaks with a clear mfi indication (15-20 pip loss if it goes south)
Gains
XDN Breakout happening NOW!XDN ate up the sell walls at 4, 5 and 6; buys are FLOODING in. Nothing but up from here, new sell walls are TINY compared to the MASSIVE buys at 5 and now starting at 6.
People filling up their bags and prepping for take off. This is an alt-coin you do NOT want to miss. Once the 7 sat wall breaks down the FOMO will kick in and people will be hoping on the bandwagon. This is your last chance, don't miss it! 10-100X potential!
TDI and RSI both posting up and looking for a prime uptrend. Moon time is coming lessgooo!

Medium Term Play. XMX/ETH Houbi. Medium Term Play. XMX/ETH Houbi a potential cracker. this chinese coins have a tendency to pump hard. could have insane chain

EOS Has a LOT Of Potential In Terms Of % GainsIn terms of percentage gains EOS has a lot to go. We probably wont see prices below $6, maybe even higher, but that is just my opinion from what i see on a chart. Where are at a beginning of a alt season so it is hard to miss a coin that would not have some kind of % gains in it, but to find the right one, you have to look from a bigger perspective so you can see what it has done in the past. History tends to repeat itself so as human psychology imo.
From the chart perspective, 4.236 fib. extension takes us as high as $93, but in my opinion prices between 50 and 70 are more likely to be reached. It could just surprise us all and go even a bit higher than $100, but quite unlikely imo. We first have to break above $8.6 resistence line, from where we were rejected and couldn't reach for almost 2 years now. Breaking above this (blue) line would confirm the explosion in price, but will see.
The predicted price is just a representation from a 2017/18 alt season and does not mean it will go exactly like that.
I am not a financial advisor so don't buy anything that a say. Wish you all successful investment.
BITFINEX:EOSUSD

$stmx easy money with a little dash of riskheres a RISKY but PROFITABLE buy signal for you guys. If STMX stays about 0.0465 by 8 PM, buy it! It shold guarantee insta gains in the short term. Target will be 0.058 - 0.059
Bought it while watching the hourly and its been bullish on the 1h, 4h, 1d, 1w

HPB in accumulationHPB is currently being accumulated and as soon as it breaks out of the triangle it will go upwards, facing red resistance zones. As soon as we break from them we will go to a higher one.
I would not advice though to sit too long in it. Short-term almost 40% potential profits and midterm 90%
datalize.org

MANA aka ROCKET FUEL 🚀 This little coin has had a crazy week with a 35% gain and a 19% gain with steady growth in between. WTF I doubted it at first but with BTC headed into a hot summer, MANA might just be getting started!
Truth is NFT and Decentraland are hot topics right now and I think we will see at least a few more rallies before any sort of cool off. The fundamental are there and the demand is obviously through the roof. DO NOT underestimate this one Folks.
This one is a bargain in the $1 range and I think we might see a slight drop this week before the next bull rush, look to buy it then!
Outlook : +30% within a week with a slight pull back the next day or so.
Make that money! Don’t FOMO but Don’t miss out either 😉

BNGO MOONbngo stock has a system, a genome mapping device that has proven itself more effective 10,000x its competitors in some cases and more accurate. Belgium just verified this again today. They’re setting up testing facilities and labs currently and hiring people to operate them. Some of its competitors are worth 400$+ while bngo system is way cheaper but will take over in the next few years. If this isn’t the biggest no brained idk what is. 100 by 2023 atleast thats over 10x gains let’s go

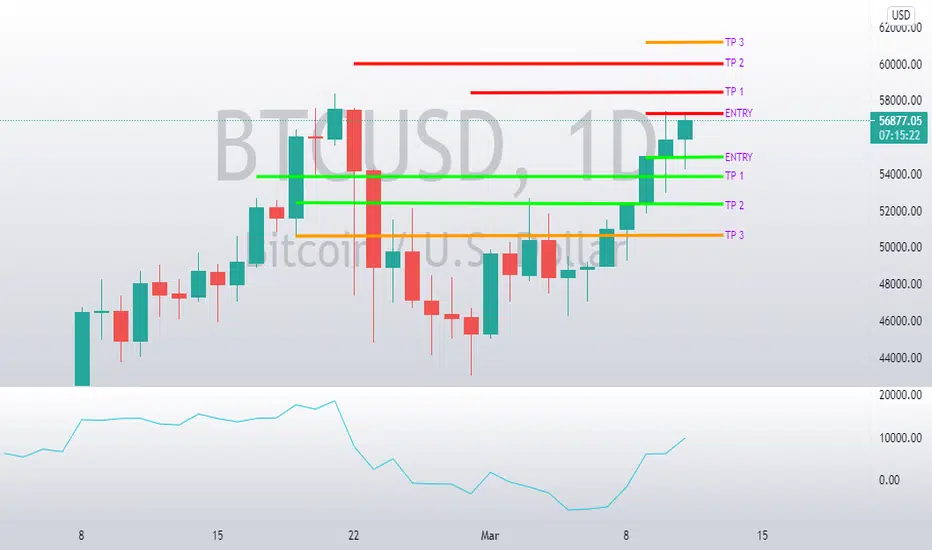
BTC HIT FOR 2,000+ PIPS From my previous BTC chart. TOO EASY!Basing from my previous chart on BTC, it has hit TP 1 for a grand total of 2,000 pips twice. Making it a total of 4,000 possible pips. When price crossed resistance I placed a buy and since then it hit tp 1 for a total of 2,000 pips. Later on price went all the way down to new support line and price was then rejected. Afterwards, price went bullish once again hitting tp 1 (new resistance) again for another 2,000 pips. Leaving you with a total gain of 4,000 pips. Just follow my charts and you will get the pips you desire with so little risk.
My strategy will work with you to maximize your pip gains if it goes either direction. Simple price action strategy
Message me if you want to know how to utilize my strategy
When resistance breaks (red) enter for a buy
When support breaks (green) enter for a sell.
Bonus: Sell right before resistance breaks with a clear mfi indication (15-20 pip loss if it goes south)
Buy right before support breaks with a clear mfi indication (15-20 pip loss if it goes south)
COMMENT OR MESSAGE ME IF YOU WANT ME TO EXPLAIN HOW MY SCALPING STRATEGY WORKS FOR THE 15M-1HR TIMEFRAME
EURUSD ENTRIES. Simple and the best strategymy strategy will work with you to maximize your pip gains if it goes either direction. Simple price action strategy
Message me if you want to know how to utilize my strategy
When resistance breaks (red) enter for a buy
When support breaks (green) enter for a sell.
Bonus: Sell right before resistance breaks with a clear mfi indication (15-20 pip loss if it goes south)
Buy right before support breaks with a clear mfi indication (15-20 pip loss if it goes south)
COMMENT OR MESSAGE ME IF YOU WANT ME TO EXPLAIN HOW MY SCALPING STRATEGY WORKS FOR THE 15M-1HR TIMEFRAME

Zomedica's next uptrend? Hello everybody, this is my second analysis of $ZOM.
By using Heikin-Ashi I determined the uptrends more easier then general candle sticks.
I copied the first and second uptrend swing (using bars pattern) and pasted it in the potential next uptrend.
I think that through the almost launched product Truforma, we can see a new all time high, probably $5+-.
What do you think will happen until 30 March? (launch date Truforma)
I will gladly hear feedback!

Genpact Set To Rise Soon?Genpact is the latest stock to flash the Precise Signal. This time it is a buy indicator. Genpact Limited signaled a BUY on March 2 and proceeded to drop lower as expected. It dropped lower than normal, but it is back up near its signal price. The consensus targets are plotted on this chart. Most have the targets above $45. The interesting part is it tends to take longer for the top to be reached for this stock. Right now, it looks like $45 might not be hit until April. Based on the how the market is teetering and I personally opine it will drop much lower soon, the best entry point for this stock may be over a week away. April call options right now are fairly cheap. My guess is they get cheaper over the next week setting up a nice position if everything moves as expected.
The Precise Signal is occurred on the daily chart 5 times for this stock. All 5 so far have resulted in the stock moving up at least 5% from the closing signal price. In this instance, the stock closed at 41.74 on March 2. 5% above this price is $43.82. The stock dropped to $39.32 days after the signal. A move from this low to $43.82 is an 11% gain. A move to $45 from that low would be a gain of 14%.
Like I mentioned, the market is rocky and should continue for a bit. The close on Friday was at 41.41 and I expect it to drop again before charging above $45. Sit back and get ready to pounce on this potential opportunity.
For full analysis check out the article for free at the website in my signature block.


Crsr Falling Wedge Pattern!! Let’s get this boys, easy gains to be made, target of 44$ soon
In 4 a few hundred shares
Not trading advice 😉

SXC on the watchLook at this pattern here, will keep an I on it and see if it pulls down for a nice entry around 5.60

Trustswap, bullish indicatorsGood day everyone,
As you may see, a few bullish indicators for Trustswap:
1. Conversion line (blue) continues to be above the red base line;
2. Price above the green cloud;
3. 50 ema tested recently;
4. macd & rsi have room to go up.
We could see the price eventually get around 13 in the upcoming period.
However, prices of altcoins can get high impact from the corrective March period. If that happens, and bitcoin continues to decline, price could test median line of around 2.5

NAKD - breakout incommingNAKD is about to put on some clothes and go for a run. Its done resting. Accumulation load up/buy zone. Wait for the signal.
Good luck trade safe

double bottom timelooking for the double bottom that happens everytime hex goes on a run. like Richard said, hex is a swing traders wet dream :) hex is so easy to predict sometimes i love it!

OPTT CALLS AUG CALLS this company has tested fib and tested ema. got bought up.
it harnesses the waves for energy. in my opinion thats just a cool company

NGA TAKES A DIP!!!With market wide EV sell off NGA got caught in the cross hairs not to worry as they are a solid company moving forward with good partners, if your holding it would be in my opinion best to hold and weather the storm. Nothing said my me in any video should be taken as financial advice this is educational only, that being said support if you enjoy!!!

IMPORTANT day for CTRM Castor Maritime has to close above 1$Important day!! 10/10 days that we have to close above 1$ to keep it at NasDaq. But...! Only buy at the end of the day to let it run to our target. The closure above 1.00$ is the most important. What happens throughout the day is unimportant in my opinion!
I have taken a close look at this company. In my view, the rise will continue uninterrupted unless the entire market has a dip day that pulls CTRM down with it, but that is a healthy correction. The company continues to purchase ships, which will be very good for their revenue stream in the long run. However, the earnings that are released on 3/3 may disappoint somewhat, because of the purchases the cash may be lower or the debt may be higher. Depending on how they bought it. There is enough cash, but long-term loans are also possible to finance these purchases. I am very positive about CTRM so i will keep them for the long run. From 1 dollar a lot is possible in a positive way. For example, look at the increase in Fuel Cell stock (FCEL), 1000% within 6 months. I see something like this possible with CTRM.

FCEL testing 50 EMA and seeing green day?? so..... this is my idea my peeps! take a listen or not but my opinion only do your work.
FCEL broke down out of its channel (the blue parallel lines) (1 day time frame)
it looks like it has tested the 50EMA (the red line) and also the fib retracement of 0.382 (i circled it for ya baby)
from this point i would like to see some more volume and green days.
MACD wants to curl up over the signal line (the lines at the top Yellow and blue) for anyone that does not know what that it is.
It is basically a buying signal and good indicator for the market.
the 1 day candle stick could maybe come out to be an abandoned baby.. or inverted hammer ?? let me know what you think
going forward the next coming days i would like to add to my April.16th 2021 $20.00 strike depending on how these patterns end up panning out:))))

AIONUSDT - JUST LONG IT 250% GAINS 🚀AIONUSDT Daily : BEST level to BUY 250% gains (SL/TP)(NEW)
IMPORTANT NOTE: speculative setup. do your own
due dill. use STOP LOSS. don't overleverage.
🔸 Summary and potential trade setup
::: AIONUSDT Daily chart review / outlook
::: Reversal is happening soon
::: likely setting up for a bigger move up - Get ready BULLS
::: however short-term I recommend to focus
::: on HOLDING your Position or buying SUPPORT
::: key support level: 0.14 USD
::: recommended strategy: LONG IT 0.14 - 0.15 USD
::: SL 0.115
::: good luck traders
