123hrs are oversold 4hr and day a over boughstill RSIDGB is coming down from a moon shot.
DGB will probably be on coinbase next year or sooner. YOU WILL HEAR PEOPLE TALK ABOUT THIS BUT DONT LISTEN. Events like this are not going to be a for sure shot up. Always look at the rsi and the charts and make your own opinion. Coinbase could mean more buyers and the price increasing but could also mean more sellers and a downfall. Although, I think a coinbase listing over time will be a boost up
RIght now on the 1 2 and 3 hr charts, the rsi is coming up but on the 4 and daily chart, they are dropping. to me, this means you will see a spike up almost to our over sold RSI. Just below it and then a sharp drop. I dont think the RSi will hit about 70 on it's way up before the drop.
DGB is coming out of what I believe is a double top on the 4 hr. So, we could see a retest of the top before a drop downwards. This may support my previous statement of a spike up before a drop.
Gains

Easy Money #2 : Our trade results on Zn today (TARGET REACHED !)Target reached ! (see related idea if you doubt ;)
Zn1 particulary generous today ;)
Hope you rode the wave with us :)
Pharao says it's time to rest and enjoy the sun for today, see you guys tomorrow !
stay tuned

Intraday : Update on quick operation on Zn Trade (goals)Ready, set, go !
Will we reach our targets ?
Stay tuned

Intraday : Update on CL1 downward trend confirmed !!- Current view on CL1
- Downward trend confirmed (hope you rode the wave ;)
Stay tuned

Easy Money : Our Trade results today on GOLD ! (Nice day !!)Here is one of our recommandations of today (see related ideas in case of doubt ;) )
Stay tuned for more intraday gains :)


CASY gonna grab it before earningslooks like this one could make a little in gains earnings comming out on the 8th the past 11 days have green bars on volume and we are sitting several clicks above the 50MA.the tecnical indicators are showing strong buy through the next week.
the past four earnings reports are all beats lets keep our fingers crossed for another! hopefully we see a new support level as well!
have a happy day and good trading!

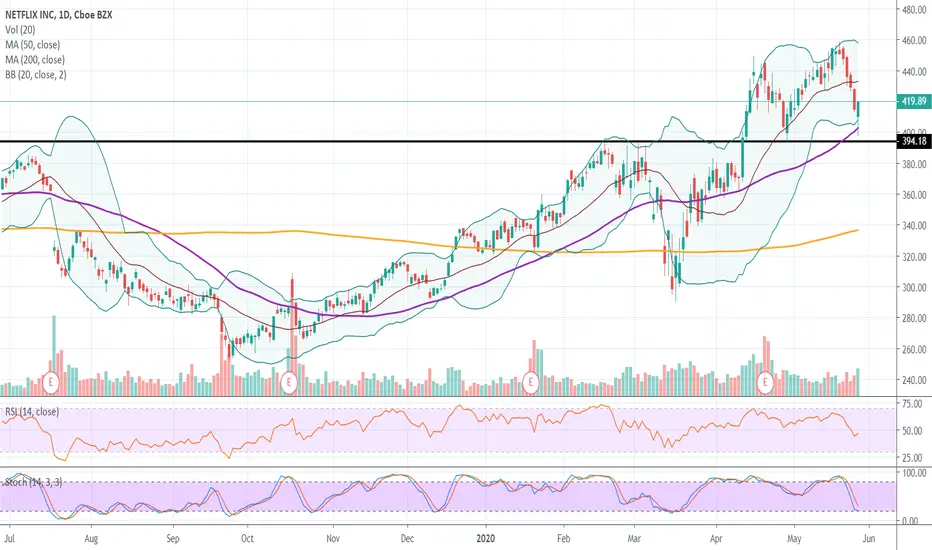
Full Stock Report - Netflix Inc. - A strong growth story!Due to Netflix’s huge expansion globally and the great quality of new products and features it provides subscribers with, leading to its great financial performance in the past few quarters, the share price of the company has been very bullish since the 3rd quarter of 2019. The stock was trading at only $253 in the end of September 2019 when the company beat analysts’ expectations for the 3rd quarter of last year and delivered better than expected earnings for the quarter, which immediately led to a huge buying interest among investors who started pushing the stock higher. The price started heading higher and formed a very strong bullish trend that lasted until the beginning of March 2020 where the stock reached its peak for the year at $392. Yet, due to the coronavirus pandemic and the huge sell-off across the stock market all around the world, Netflix’s stock depreciated as well, reaching the lows at $291 two weeks later.
Yet, as we have mentioned earlier, the social distancing and the fact that people have been staying at home have given investors a signal that the correction back then was a great buying opportunity, giving them a chance to boost their profitability to the upside, considering the great financial performance of the stock and the even stronger expectations for the 1st quarter earnings report. Thus, investors started buying aggressively and that led to a massive bullish rally in the past 1.5 months, sending the price from $291 to $450. In fact, this was a new all-time high, since the previous record was reached back in 2018 when the stock reached its peak at $420.
Since the company reached its new record high on the stock on the 20th of April we have seen a bit of profit-taking interest, which has ultimately sent the price down towards the key support at $394-$400 where investors started buying again earlier today, thus pushing it back up towards the current $419 level.
After analyzing all the above-mentioned factors and the huge financial success of the company, we believe in the longer-term success of the company and would like to add Netflix to our portfolio. Therefore, we need to decide at what price we would like to buy the stock in order to maximize our followers’ profitability to the upside. Moreover, we are taking into consideration that the situation with the coronavirus has started improving and countries are slowly getting out of the recent lockdown, which would also motivate investors to seek great buying opportunities on leading stocks, such as Netflix.
Going back to our previous point, the daily chart shows the key psychological support at $394-$400, which used to be a strong resistance level that was broken in the middle of April during the huge buying activity on the stock, where investors pushed it towards the new record of $450.
As soon as investors started cashing in some profits and the price reached the lows at $394-$400 there was a lack of further selling activity and that could easily be seen on the chart, which shows that as soon as the price reached the $400 support investors started buying again, taking advantage of the short-term profit-taking correction and sending the price towards the $419 already.
In fact, the middle Bollinger band line matches with the key support at $400, while the RSI is still heading higher at the current levels at 55. The Stochastics indicator has already crossed down in the overbought territory during the recent correction that has taken place and is now close to reaching the oversold area where it will be giving further bullish indications as well. Furthermore, the Fibonacci retracement at 38.20% matches perfectly with the support at $400, giving a further buying indication at that key psychological support level.
As you know, our correlation-confirmation model gives us a chance to identify great market movements and therefore be able to maximize our profitability on different stocks. Yet, before we buy the stock we need to get a confirmation from some of the biggest ETFs and make sure they confirm our bullish stance on the stock.
You can find our full correlation confirmation analysis if you follow us everywhere!
Therefore, the current price movement on both XLY and SPY confirm our bullish stance on the Netflix stock and give us a further indication that buying the stock at the strong psychological level at $395-$400 would give us a chance to make high profits to the upside. Therefore, considering that Netflix is currently standing at $419 we would prefer to wait for a short-term profit taking correction towards the support at $400 where we will start buying the stock aggressively. In case the price makes a further drop we will be interested in adding more to our buy positions at the next strong support mark currently standing at $380, which will give us a chance to improve our average cost basis and maximize our profitability to the upside.
We will be looking to cash in some of our profits when the price reaches our first target at $420, followed by the longer term target at $450-$460 where we will be fully cashing in our profits and waiting for another correction that would give us a chance to buy again and boost our followers’ profits again.
FET/USDT 20% Gain Minimum!!No more resistance until around .02800 that 20%. If this plays out well 146% incoming!! Green lines represent resistance zones!
Hit the thumbs up button if you like my analysis, thank you.
This is not Financial advice.
Safe Trading Calculate Your Risk/Reward & Collect!
Simplicity Wins

SPY, etc. ~vs~ TVIX / VXX / VIX Must Watch these closely!! Friendly Reminder to All!!
...Well, if you were lucky enough to buy the TVIX before the historic March Market Plunge, and sold it near those highs it produced while most stock markets made their lows, you nailed 1900% gains!!! Also on the 'bargain' priced VXX & VIX = 450% gains!!
Enough said. Watch these Volatility Indexes closely, maybe start accumulating now and hold, -as we see more stock market drops, these can repeatedly 'Moon' again!! (& an added bonus, they can be easily shorted on the way back down!)

Bullish TRENDING UPWARD!!This chart shows an upward trendline which should continue along projected path.

Breakout Bullish Oil ETF GUSH has potential +1000% GainsAMEX:GUSH
GUSH, provides 3x daily exposure to an equal-weighted index of the largest oil and gas exploration and production companies in the US. These leverage funds are designed to move three times the daily change in the underlying index. The EFT has taken a significant beating and poses significant investment risk. The coronavirus and Saudi “price war” have been a perfect storm to drive oil related stocks down. Even as crude oil prices recover it may not be enough for this fund to recover to previous levels.
The So What?:
The projected global demand for oil after COVID-19 assumptions is approximately -9.4%. With some key areas impacted being road fuel down -9.4% and Jet fuel down -31%. The total oil demand in North America for 2020 is forecasted to fall by 2.3 million bpd to 22.6 million bpd, a 9.2% decline from 2019’s 24.9 million bpd. April will see a decline of 30%, with demand falling from 24.6 million bpd to 17.2 million bpd. May will see a decline of 21.5%, with demand falling from 24.6 million bpd to 19.3 million bpd. However, as social distancing guidelines are loosened oil demand volumes are expected to increase gradually in June, July, and August. Ultimately, oil demand levels return to the previous year’s levels by December.
GUSH has lost -94% of its value in the past three months as the COVID pandemic and oil price war has taken its toll. But the dependency the world has on fossil fuels has not changed. As the world returns to some form of normalcy, the demand for oil and gas will increase in stride. I anticipate this ETF will gain approximately 1000% in value by 2020 years end.
The Why?:
Trading volumes for GUSH are occurring at very high levels, showing signs of a stabilized floor established and the current price is positioned in a bullish zone. The potential to seize significant investment gains of +1000%, significantly outweighing any potential risk for me to make on this investment.
I am not a financial advisor. The advice here given is not financial advice even though my excitement might make it look like such. Trade at your own risk and remember nobody can guarantee you results. I conduct analysis and make informed decisions on what I believe is right and at the end of the day, I am just a person, not an expert. Again, this is my belief, a belief of an ordinary man, who just works hard and enjoys the pleasures of swing trading personally.
Darell

TWI - ULTRA BULLISHOh man... talk about a setup. SHARP falling wedge. Distribution double bottom ... MACD ... trend line and horizontal support...

NAT and natty gainsEarnings are coming in soon, might not be as high for the 1st quarter so it may pull back a bit more. 4.23 next level but there does seem to be a big upside looming this month with more tankers coming with a lot of indicators pulling for this to pass 10, risk reward and earnings to watch out. Oil is loyal

Where is BTC Going After that Surge?Hey all - That was quite a dramatic last few days, luckily we had Long positions both on our Daily Tipster and Intra-Day Scalper! Plenty of green for us with Bitcoin, Ethereum, Litecoin and ETC! (We missed DASH - but it hasn't gained as much anyway!)
So let's look at the King of Crypto, Bitcoin, where's it heading now? Carry on up to $9800, $10,400? Or back down to $8000 as if nothing has happened! Is this the start of the Bull Run we've been waiting for? Or simply reverting to mean after the big drop experienced at the start of March? The gains could also be an Organized FOMO Rally by big players, tempting smaller traders in using the Halving as a catalyst/panacea to their trading needs; only to wipe them out with a big drop due to over-extension and not enough genuine support.
Who knows? We can all speculate about where the price is heading next, we still believe we're on for $11-12,000 by the halving in early-mid May, and given what's happened in the last 48 hours - we're getting closer!
From here, we can see the price of BTC tickling $9,000 for a good few hours, maybe even a day or so. From there we'll be looking at a quick rise to $9800 - or a sharp fall to $8200. We're just not sure... what do you think?
Good Luck & Happy Trading
-theCrypster

Not too late to buy INO(maybe MOON)Possible pull back reasons:
BTC halving: Millenials are into crypto and a lot of people made money June last year before the LTC halving. People are hyped because this is the last major halving for 4 years. And might be selling their stocks or fresh INO gains to get into BTC. PLUS miners usually plan ahead for the bitcoin halvings and buy extra equipment to not suffer any major losses. BUt CORORNAviruis might have put a stop to the equipment the miners need to keep BTC mining profitable. If that is true then we might see something close to 2017. But I expect miner had their equipment before this all happened. Or will get it in the month before the next halving.
People forget: America moves fast. if something major happens on Monday it's lucky to be stilled talked about the next Monday. So people are naturally not talking about the coronaviruis and people might care less and less about the vaccine by the time it is ready to be sold. We are aslo seeing states open stores and businesses more and more. That will distract from a vaccine as well.
Overall, INO is into more than just a COVID19 vaccine. And I think, after some interview I've seen recently, Mad money, the CEO and the company is run with good intention and have good products. So, it could pull back but I see recovery if that happens. a pullback happening would probably take some bad press or fake news.

Toyota Tsushi breaking out of descending triangle, Moving HigherMoving higher on strong earnings results and continued dominance out of Japan. Strong balance sheet. Actually more than it's market cap.
Trade at your own risk.

Update on XAU long positionCurrently there are no signs of a reversal in the rally. market is making higher high / high lows. we are now at a major resistance zone which will tell where the market is heading in the short term (next 2-4 weeks).
Those holding long since the previous swings should continue holding, if this resistance level breaks, it will be a relatively large rally. any break to the downside should alert you for a swap.
Anyone following from the apr 15 post should have the stop moved to BE, or in a profit zone, this trade is a non-loser. congrats if you made it this far


TSLA take bowThe run and huge gains where to a point earned, but the bear market doesn't care for earned gains right now. Breaking 180 EMA with and going down with the market. I thought 500 would hold but 430 and 407 would be the next point of entry and should show consolidation around this area. I see it very hard to go below 380 as of the new Battery Investor Day, at the end of the month, and Model Y now rolling out.

XRPUSD BUYS POTENTIAL 100-800 PIPSBeen trying to follow this XRP pump since it happened earlier this month.
Waiting for price to show signs of Bullish momentum.
Have actually gotten stopped out like twice this week on the trade.
Lets see what happens.

BTCUSD BUYS POTENTIAL 200-900 PIPS Price has returned back to our Jan Demand Zone.
Last time price was within these levels, we saw a huge rally to the upside for hundreds of pips.
Lets see what the bulls have in store for us!

