GALA analysis ...Hello guys...
As you have seen over the past few weeks, the cryptocurrency market has been very bearish and no signal has been observed to change the trend. I still encourage you to short position.
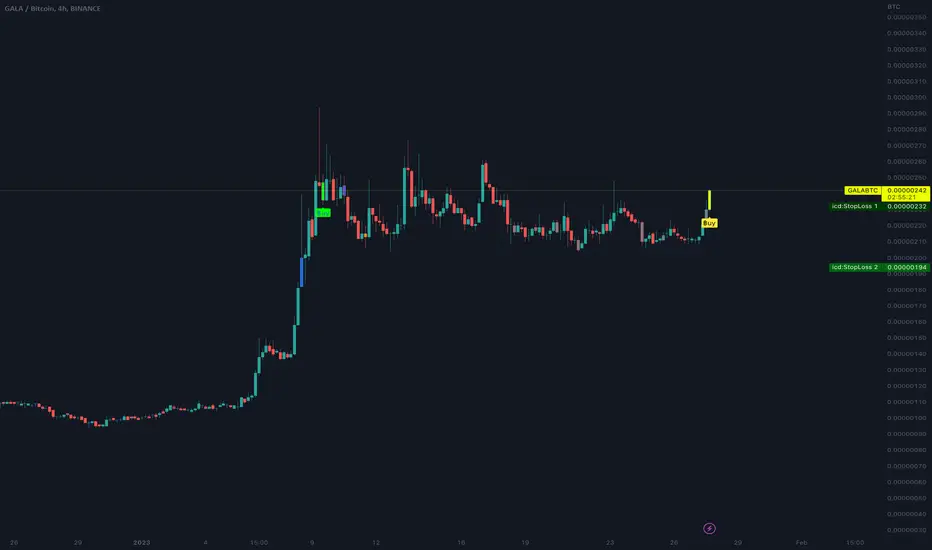
here we have #gala, this cryptocurrency formed in a bearish channel and in my opinion will break main lower low (main support level).
but be aware if this channel break up top line it will be bullish for a few weeks at least.
always do your own research.
If you have any questions, you can write it in comments below, and I will answer them.
And please don't forget to support this idea with your like and comment.
Gala


GALA moved 30% today.GALA moved about 30% up today and was mentioned on the top gainers' list.
The price is inside an ascending channel, and after touching the bottom of that channel, it gets a pump and reaches the top of it.
There are three support areas on the way down and one resistance on the way up; the price will continue to increase inside this ascending channel for now.
I'll update this chart when the price comes around the solid resistance.
Do you agree with this chart? Let me know if you do, and if not, challenge it.
Thank you for your time; I hope this was helpful.

GALA GAMES - GALA Coin Price PredictionIn this chart you can see GALA GAMES - GALA Coin is in a good trend on the 4 hour chart. It has broken the resistance level and now it is retesting the old resistance as a support. Nice Buying area in my opinion.


GALA more pumperino! At the bottom of this range here and still consolidating after the large impulse move. Looking for another move up here. LOW LEVERAGE ONLY! This is a very fast moving coin up or down.

GALA Echo bubble targetsGALA, when it pops, pops extremely violently. You blink and it's done a 9x.
Now that it is over the 200ma, some very interesting things can happen. Bearish bias is wiped out, and momentum will begin to markedly shift.
I've set some targets for a potential echo bubble around .15, .19, and .29, assuming we don't see the same strength as we saw during peak bull euphoria.
There's some news about a 500M quarterly burn that could help sustain in this resistance area.

GALA - As Above So BelowGALA - As Above So Below
Gala to $.011
This would be on the level!
GALA is The Rock
GALA has got Good Vibrations

Gala it's lead to reach $0.07 centsIn this quickly analysis, it's my update of GALA that I follow in my radar in my investment, I suggested to buy this crypto before to begin to up. I expect a next price to reach around $0.074 cents approx. And we're forming a bullish ascending triangle that it's in formation right now.
I expect that this analysis support you if you don't know this crypto. Take a check out of this crypto project. It's amazing to follow on this 2023 and apply the concept to change your crypto-portfolio to update and choose widely some cryptocoins with a lot potential, credibility, transparency and the most important that I consider it's their fundament and philosophy what kind of project it's been unique to appreciate their quality in the fundamental analysis.
I hope that this seed will help you to identify good project!!!
Good night!!!

$NAKA $CUBE $SUKU $GALA all HUGE movers, called them early JanPosted this elsewhere, DOCUMENTED
To #hodl any of these from late DEC/Early Jan = GOOD!!!!!!!!
Each has pumped nicely
$CUBE 2x
$NAKA 3x
$SUKU 2X
$GALA 3x
Some look to be losing steam, it's expected
Many #Altcoin are beginning to look a lil tired
Consolidation or something else?
#p2e #metaverse #nft #crypto


GALA Forecast and Idea✅ ✅ Risk warning, disclaimer: the above is a personal market judgment and analysis based on published information and historical chart data on The trading view,
And only some of these analyzes are my actual real trades.
I hope Traders consider I am Not responsible for your trades and investment decision.

🔥BTC ALWAYS MAKE IT AFTER THE RANGE: HISTORY AND MY FORECAST🔥Hi friends! We already forget how Bitcoin can grow and it makes the New Year gift for all of us. A week ago, I opened the spot and futures position at $16,900-17,100. Since there was no false breakout at $17,500, so this trade is still open.
But what is my current target for BTC? We need to take a look at the previous situations on BTC chart. It was always pumping after exiting the range.
📊 BITCOIN MOVES AFTER EXITING THE RANGE
I've taken the price history from 2019 and make some research. The price pumps in 100% cases, but with a wide range:
🚩 2019
1. +238%
2. +32%
🚩 2020
3. +53%
4. +29%
5. +470%
🚩 2021
6. +110%
🚩 2022
7. +28%
8. +12%
🚩 2023
9. +23%? - the pump is just starting
So BTC had +12-470% PUMPs after the range breakout. Now it's already +23% of profit, so the PUMP is likely to continue. As you see, BTC has 1-3 pumps per year, so we can expect 2 more HUGE pumps this year too.
✅ MY TARGETS FOR BITCOIN :
🔥 First scenario. BTC pullback to $18,000-18,500 and after that move to $35,000-42,000. This pullback allows the price to calm down a bit. Actually, this helps BTC to grow higher.
🔥 Second scenario. BTC will pump to 28,000-32,000 straight after some consolidation at $20,000-21,000. The targets are reduced because without a pullback the price will be too "overheated".
🚩 Traders, be careful these days. I will open/close the trades depending on crypto market situation. Stay tuned to get more timely and profitable updates.
💻Friends, press the "boost"🚀 button, write comments and share with your friends - it will be the best THANK YOU.
P.S. Personally, I open an entry if the price shows it according to my strategy.
Always do your analysis before making a trade.

GALA token formed bullish Gartley for upto 12.50% pumpHi dear friends, hope you are well and welcome to the new trade setup of GALA token.
Our last successful trade of GALA was as below:
Now on a daily time frame, GALA with BTC pair has formed a bullish Gartley pattern for another pump soon.
Note: Above idea is for educational purpose only. It is advised to diversify and strictly follow the stop loss, and don't get stuck with trade

GALAUSDT ASCENDING TRIANGLEHere you can the chart of "GALAUSDT" in 4 hour time frame and you can see that we can see the price is forming a ASCENDING TRIANGLE PATTERN and if it takes breakout you can see for a good short or lond trade according to the breakout.
ENJOY!!!!!!!!!!!!!!


GALAUSDT NEST MOVE!!!!!Here you can see GALAUSDT in 1 day time frame has a SUPPORT at the zone "0.04305". And the candle already has taken BREAKOUT from the yellow reandline and if the candle tries to take retest in the trendline we can see a good ullish movement in price. So you can go for a risky LONG TRADE at the support zone. and if the price takes breakout from the support then we can see a good downfall in the market.

GALA Forecast ✅ ✅ Risk warning, disclaimer: the above is a personal market judgment and analysis based on published information and historical chart data on The trading view,
And only some of these analyzes are my actual real trades.
I hope Traders consider I am Not responsible for your trades and investment decision.

GALA Coin : "Words are useless when the target is clear..."Hi everyone!
As we said "Words are useless when the target is clear..." and Gala coin could trigger an interesting technical rebound in the medium term. That said, even if the main trend is still bearish, we think that an accumulation strategy could be the right choice, so starting tomorrow.... "Buy the dip!". In conclusion, we see a potential first bullish target around 0.1123 area.
If this idea will be supported by your "Likes" we will continue to follow the crypto with updates below.
thanks for your attention and please... trade with care! 💖

BTC FAMILY REVIEW AT Bee'sWorking out the truth... We Have It... THE GOLDEN KEYS ARE WITH IN OUR ROOM!!!!! We're Looking to have a TA battle within the Krypto Community.

GALA (Y23.P1.Video1)- what we have so farHi Traders,
Difficult level to make any call however I do explain the key levels identified and possible scenarios.
For now, I"m looking for a swing failure trade (bearish).
Please give me a like and share,
All the best,
S.SAri

