Gala to the 🌑or the 🚽the gala update. looks more bullish overall but we do have a bearish target just incase.
DYOR.
Bullish divergence, looks like a potential bull flag 🥱enter at your own risk make sure to use your proper risk management and be ready for either outcome
Gala

buy GALA for 100% profityou tink we can take 100% Profit from Gala/USDT
we hold this token
all holder focus on gala


ROSEUSDT 1D TA : 01.07.22 : $ROSEAll supports and resistances are marked on the chart. As we can see, the price is in an important range and recommended to keep an eye on it ...
Follow our other analysis & Feel free to ask any questions you have, we are here to help.
⚠️ This Analysis will be updated ...
👤 Arman Shaban : @ArmanShabanTrading
📅 07.Jan.22
⚠️(DYOR)
❤️ If you apperciate my work , Please like and comment , It Keeps me motivated to do better ❤️

Bitcoin Short 1D TA : 01.07.22 : $BTCDid you see where we recommend it to get SHORT ??? that's how you do it :))))
As we expected, the price break the trading range from the bottom and also lost its important dynamic support. Currently, the first very important support and bearish target is the (Swing Low) price, which is in the range of $ 42,000. Up to $ 42300, if this critical level is broken the next downside targets will be $ 40 ,000, $ 38,600 and $ 37,700 and if all 3 of these support will be lost , the Potential Reversal Zone (PRZ) could be the of 35,500 $ range ... (This analysis will be updated)
Follow our other analysis & Feel free to ask any questions you have, we are here to help.
⚠️ This Analysis will be updated ...
👤 Arman Shaban : @ArmanShabanTrading
📅 07.Jan.22
⚠️(DYOR)
❤️ If you apperciate my work , Please like and comment , It Keeps me motivated to do better ❤️


will Gala be supported ?Hi
I think Gala has strong support right now
But if it loses its support, it will complete its downward trend
what do you think?

GALAGALA isn´t so far from buy signal... you have to types of buy signal:
a) in the green zone (0,4 usd)
b) wait for the break of trendline (4h - 12h)
SL is under the biggest wick around 0,3662.
TP start from 20-25% (around 0,5 usd) and higher.
RRR will be definitely more than 2. What we need now is volume.
LBL_CZ

GALA could be due for a correctionGALA had a huge massive runup from .10 to .70, a 7x gain in a short amount of time, so its looking like it may have topped out for now. Its Galaverse conference is over, and typically we see a "buy the rumor, sell the news" event in these cases. GALA is under its 8-day and 21-day moving average on daily timeframe, with 8-day below the 21-day. It tried to re-gain some upward momentum and has been in this uptrending channel but broke down out of it. As of right now I see this possibly retesting any of the 3 support/demand zones outlines below. A move higher back into the channel would change my mind and flip back bullish

GALAGALA is now back at the support of $0.41-$0.43 area. GALA need to hold this support otherwise we will see more downward movement. The first resistance for GALA is $0.47 area and $0.51 area. The major resistance is $0.58-$0.60 area. The next support is $0.36-$0.37 area. You can add some GALA near the support with tight stop loss.

GALA - There is a possibility of testing the 45 and 40 cents areOn a daily timeframe, we see an engulfing bearish candle that provided the conditions for correction. There is a possibility of testing the 45 and 40 cents area in the coming days. Be patient and enter by reaching the range of 40 cents.

GALA in falling wedge#GALA/USDT
$GALA is inside falling wedge pattern, and now is at support zone that if hold it and head up to break out the upper line of wedge it can increase to touch resistance zone around $0.57 and $0.6.
it is possible that price drop to touch the lower line of wedge, then start its rally to break out from wedge.
in long term #GALA can increase toward $1.
break below the lower line of wedge that is the same with long term support zone around $0.3692 will invalid this analysis.

GALAUSDTHello Crypto Lovers,
Mars Signals team wishes you high profits.
We are in the daily time frame. There is an S1 line which is now the support line and was previously acting as the resistance line. The price broke the S1 line and hit the R1 line, could not break it and made a pullback to the S1 line and currently is fluctuating above the S2 line. We expect it to rise back up to the R1 line but there is also the possibility for the price to go below the S1 line which would change the scenario into bearish which is less likely.
Warning: This is just a suggestion and we do not guarantee profits. We advise you to analyze the chart before opening any positions.
Wish you luck

Below 0.4 and GALA is deadAfter huge riseup GALA has stared to correct and found a support on 0.4 with so many touches.
Any break below 0.4 will send GALA to the deepest lows and it can drop by more than 70% from here.
Good luck

gala long volume ascentente en gala
stoch en sobreventa
accion del precio a punto de definirse
precio en niveles de soporte

🔥 GALA Massive Bull-Flag: Time To FlySince making the huge move in late November, GALA has been trading up and down without much volatility. During this period of consolidation a clear bull-flag pattern has emerged on the chart.
Since BTC seems to be reversing together with new all-time highs of the stock market, it might be a good time to take a closer look at GALA. If BTC continues its bullish behaviour, I'm expecting a bullish break out in the near future. Since we're currently trading near the support of the pattern, risk-loving traders might already consider an entry.
Targets are placed at the all-time high and a local top.
Happy trading!

GALA, LOOKING FOR SUPPORT!!!Gala is looking for a support from both rsi and static prz zone...!
Seems bullish in midterm (and also long term >_-)

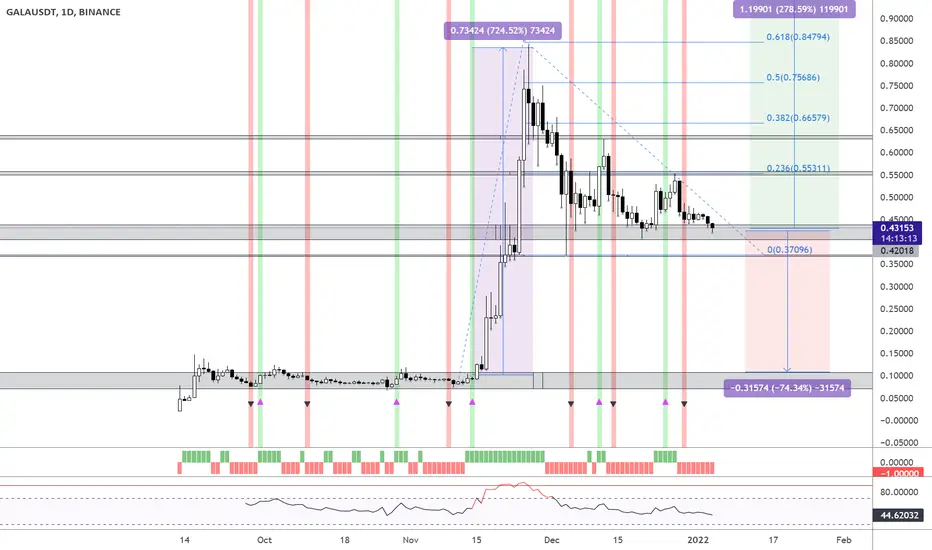
UPDATE: GALA UP 725% after bull signal - 280% more to come?Please Like or Follow if you enjoyed this content.
UPDATE: The price went sideways for a while before the big pump in Nov. Making a whopping 725+% after the bullish "Supertrend Ninja" signal in Nov 2021. That's a life changing trade for many people.
Currently the price seems to be in a range as well. Using Fibs there is potential gains of 280% around 1.62 USDT. Then again if we drop here, it could be as painful as 75%. Currently we are testing support, RSI is in an accumulation zone. Another small drop here before making a bull run, or continue moving sideways in the range wouldn't surprise me as well. GALA is a trade that definitely needs some proper risk management.
Personally I would wait for the 'Supertrend Ninja' signal to turn bullish first. It might take days or weeks. Generally this indicator gives around 2-8 bullish signals a year.
Supports and Resistances are highlighted as grey blocks. Profits can be taken at each grey block. Supports and resistances are automatically drawn using the indicator "Yo Show Me Some Support - and Resistances". Pun intended.
Thank you for reading.
Namasté 🙏
What Indicators Do I Use:
In the chart I am using my "Supertrend Ninja indicator", which is a trend-following indicator (Green and red vertical line with arrows).
When the background of the candlestick closes green (vertical line) with an upwards pointing pink arrow. It indicates a possible bullish (up)trend.
With each trade proper risk management is essential. Either by using my script "Trailing Stoploss Bottom Activation indicator", visible as grey dots below the candles. Which sends an alert, when current price goes below the previous candle low. Or using my "Heikin Ashi Trailing Stoploss Activation", the indicator below with green and red blocks. Or third option, exit when the Supertrend Ninja indicator displays a vertical red line with a downwards pointing black arrow. Remember, the first stop(loss) is always the cheapest stop.
Disclaimer: Ideas are for entertainment purposes only. Not financial advice. Your own due diligence is highly advised before entering trades. Past performance is no guarantee of future returns.

Gala Usdt triangleGala coin also has a triangle formation. If he does, his target will be 0.68. Let's get snow before it comes. It is not investment advice.

Have GALA in your portfo as whales haveHi my friends
As you see in the chart , you can buy one step at 0.46 abd one step when it breaks the first trend line and resistant
Now it has a very low risk as you see is below 0.35
Risk management on you
Have a good day

MBOXUSDT Daily TA : 01.01.22 : $MBOXAll supports and resistances are marked on the chart. As we can see, the price is in an important range and recommended to keep an eye on it ...
Follow our other analysis & Feel free to ask any questions you have, we are here to help.
⚠️ This Analysis will be updated ...
👤 Arman Shaban : @ArmanShabanTrading
📅 01 . 01 .2022
⚠️(DYOR)
❤️ If you apperciate my work , Please like and comment , It Keeps me motivated to do better ❤️

GALA, POSSIBLE PATTERN REPEATING ...!Gala may repeat the previous triangle pattern as the market will come back soon to the bullish phase. Keep it in your watchlist...
