Trading opportunity for GALAUSDTBased on technical factors there is a Buy position in :
📊 GALAUSDT
🔵 Buy Now
🪫Stop loss 0.04300
🔋Target 1 0.05830
🔋Target 2 0.06868
🔋Target 3 0.08888
💸RISK : 1%
We hope it is profitable for you ❤️
Please support our activity with your likes👍 and comments📝
GALAUSD

$GALA overviewEven though I may not be a fan of this project, but many people bought it during the accumulation zone. My expectations are quite grim compared to other projects. The target is on the chart, if it goes higher it will be good, but I have little faith in it.

#GALA/USDT Ready to go higher#GALA
The price is moving in a descending channel on the 1-hour frame and sticking to it well
We have a bounce from the lower limit of the descending channel, this support is at 0.0490
We have a downtrend on the RSI indicator that is about to be broken, which supports the rise
We have a trend to stabilize above the moving average 100
Entry price 0.04519
First target 0.05150
Second target 0.05615
Third target 0.06092

GALAUSD This pull-back is a great buy opportunity.Gala (GALAUSD) gave us an excellent buy signal on our previous call (August 23, see chart below) as after some consolidation, it rebounded aggressively to its 0.786 Fibonacci and hit our 0.0600 Target:
This week's pull-back may be aggressive but so far is only a technical correction towards the 1D MA50 (blue trend-line). Its recent Golden Cross with the 1D MA200 (orange trend-line) on November 30, is the first such formation in 1 whole year (last one on December 05 2023).
As you can see, the two fractals are not identical but share certain symmetric similarities (also on CCI terms), so it is possible for this pull-back to reach as low as the 0.5 Fibonacci retracement level and then rebound.
Even though the March 10 2024 High was priced on the 1.786 Fibonacci extension, our next Target should be within the 1-year Channel Up (until broken), so we will be aiming for 0.11500.
-------------------------------------------------------------------------------
** Please LIKE 👍, FOLLOW ✅, SHARE 🙌 and COMMENT ✍ if you enjoy this idea! Also share your ideas and charts in the comments section below! This is best way to keep it relevant, support us, keep the content here free and allow the idea to reach as many people as possible. **
-------------------------------------------------------------------------------
💸💸💸💸💸💸
👇 👇 👇 👇 👇 👇

#GALA/USDT Ready to go higher#GALA
The price is moving in a descending channel on a 15-minute frame and sticking to it well
We have a bounce from the lower limit of the descending channel, this support is at 0.05630
We have a downtrend on the RSI indicator that is about to be broken, which supports the rise
We have a trend to stabilize above the moving average 100
Entry price 0.06035
First target 0.06278
Second target 0.06516
Third target 0.06788

GALAUSDT - preparing for the biggest moveOne of the most importanr coins in gaming sector... with a strong promising project
weekly chart display
- rise of 170% after breakout the falling wedge
- succefull breakout , retest of the major trendline
targets:
1- 0.16 (200%)
2- (0.87) (1300%)
Best regards Ceciliones🎯

#GALA/USDT Ready to go higher#GALA
The price is moving in a descending channel on the 30-minute frame and sticking to it well
We have a bounce from the lower limit of the descending channel, this support is at 0.04650
We have a downtrend on the RSI indicator that is about to be broken, which supports the rise
We have a trend to stabilize above the moving average 100
Entry price 0.04814
First target 005097
Second target 0.05316
Third target 0.005573

#GALA (SPOT) entry range(,01780 -,02380) T.(,04450) SL(,01648)BINANCE:GALAUSDT
entry range (0.01780 - 0.02380)
Target1 (0.03200) - Target2 (0.04450)
2 Extra Targets(optional) in chart, if you like to continue in the trade with making stoploss very high.
SL .1D close below (0.01648)
*** collect the coin slowly in the entry range ***
*** No FOMO - No Rush , it is a long journey ***
**** #Manta ,#OMNI, #DYM, #AI, #IO, #XAI , #ACE #NFP #RAD #WLD #ORDI #BLUR #SUI #Voxel #AEVO #VITE #APE #RDNT #FLUX #NMR #VANRY #TRB #HBAR #DGB #XEC #ERN #ALT #IO #ACA #HIVE #ASTR #ARDR #PIXEL #LTO #AERGO #SCRT #ATA #HOOK #FLOW #KSM #HFT #MINA #DATA #SC #JOE #RDNT #IQ #CFX #BICO #CTSI #KMD #FXS #DEGO #FORTH # AST #PORTAL #CYBER #CLV #RIF
ENJ #ZIL #APT #GALA ****

#GALA/USDT Ready to go higher#GALA
The price is moving in a descending channel on the 30-rather frame and sticking to it well
We have a bounce from the lower limit of the descending channel, this support is at 0.04080
We have a downtrend on the RSI indicator that is about to be broken, which supports the rise
We have a trend to stabilize above the 100 moving average
Entry price 0.04240
First target 0.04395
Second target 0.04707
Third target 0.04974

#GALA/USDT Ready to go up#GALA
The price is moving in a descending channel on the 30-minute frame and sticking to it well
We have a bounce from the lower limit of the descending channel, this support is at 0.03300
We have a downtrend on the RSI indicator that is about to be broken, which supports the rise
We have a trend to stabilize above the moving average 100
Entry price 0.03400
First target 0.03566
Second target 0.03780
Third target 0.04040

GALA is bullish (1D)From where we placed the red arrow on the chart, it seems that the GALA pattern has started.
The pattern seems to be a diametric, now it looks like GALA is going to complete the E wave of this diametric.
It can go to the targets on the picture while maintaining the green range.
The targets are listed on the chart.
Closing a daily candle below the invalidation level will violate the analysis.
For risk management, please don't forget stop loss and capital management
When we reach the first target, save some profit and then change the stop to entry
Comment if you have any questions
Thank You

#GALA/USDT Ready to go up#GALA
The price is moving in a descending channel on the 30 frame and sticking to it well
We have a bounce from the lower limit of the descending channel, this support is at 0.03655
We have a downtrend, the RSI indicator is about to break, which supports the rise
We have a trend to stabilize above the moving average 100
Entry price 0.03811
First target 0.039030
Second target 0.04021
Third target 0.04145

#GALA/USDT Ready to go up#GALA
The price is moving in a descending channel on the 30-minute frame and sticking to it well
We have a bounce from the lower limit of the descending channel, this support is at a price of 0.02817
We have a downtrend, the RSI indicator is about to break, which supports the rise
We have a trend to stabilize above the moving average 100
Entry price 0.02820
First target 0.03000
Second target 0.03148
Third target 0.03295

#GALA/USDT Ready to go up#GALA
The price is moving in a descending channel on the 1-hour frame and sticking to it well
We have a bounce from the lower limit of the descending channel, this support is at 0.02811
We have a downtrend, the RSI indicator is about to break, which supports the rise
We have a trend to stabilize above the moving average 100
Entry price 0.02895
First target 0.03010
Second target 0.03148
Third target 0.03296

#GALA/USDT#GALA
The price is moving in a descending channel on the 1-hour frame upwards and is expected to continue
We have a trend to stabilize above the moving average 100 again
We have a downtrend on the RSI indicator that supports the rise by breaking it upwards
We have a support area at the lower limit of the channel at a price of
0.02500
Entry price 0.02550
First target 0.02715
Second target 0.02839
Third target 0.02994

GALA is bullish (12H)Looks like GALA is Bullish. We have iCH on the chart.
An important trigger line has been broken and is consolidating on the SWAP range.
Closing the daily candle below the invalidation level will violate this analysis.
Do not enter the position without capital management and stop setting
Comment if you have any questions
thank you

Gala 50-150 SMA cross impendingGala is currently experiencing a 50-150 simple moving average on the daily time frame. This is a bullish signal for the gamefi token that has already been rallying for the last recent week. RSI is about to leave nuetral territory at time of publishing. Targets are horizontal lines above taken from fib extensions of the previous high swing low.
Not financial advice. Do your own DD.
Thanks for viewing the idea.

#GALA\USDT#GALA
The price is moving in a descending channel on the 4-hour frame upwards and is expected to continue
We have a trend to stabilize above the moving average 100 again
We have a descending trend on the RSI indicator that supports the rise by breaking it upwards
We have a support area at the lower limit of the channel at a price of 0.01900
Entry price 0.01960
First target 0.02100
Second target 0.02210
Third target 0.02379

GALAUSDTGALA ~ 1W
INDEX:GALA This is the support block that has been holding the price from falling lower.
If you still have Conviction on this coin. do the buying in stages here. With a minimum target of 20%++. This is a very good buy with lower risk

#GALA/USDT#GALA
The price has broken the descending channel on the 1-hour frame. To the upside and is expected to continue
We have a trend to stabilize above the moving average 100 again
We have an upward trend on the RSI indicator that supports the rise by breaking it to the upside
We have a support area at the lower limit of the channel at a price of 0.01860
Entry price 0.01950
First target 0.02125
Second target 0.02323
Third target 0.02500

GALA intent to go UP is obvious now.GALA went up generously this past few hours -- conveying its intent to reverse to the upside based on the daily data.
This is huge. Daily data doesn't change mind often, so this is a good hint already.
Expect some more than average moves to the upside from the current levels.
Spotted at 0.030
TAYOR.
safeguard capital always.

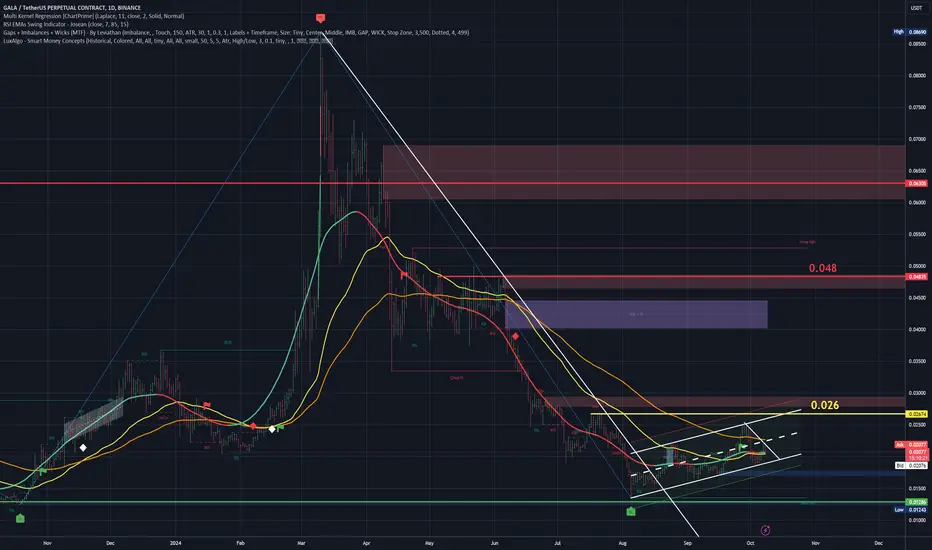
GALAUSDT 1D - Bullish ChannelGALAUSDT 1D - Bullish Channel
GALA, after making lows at 0.0135, is developing a bullish channel with rising highs and rising lows.
It is an interesting value to follow in a trend because it tends to be constant.
The strategy to follow will be to buy at the base of the channel and take profits in the 0.026 area where it has a clear resistance. Now, at the moment it is in a consolidation area so we have to be attentive and respect the SL to protect our investment.
It is likely to continue its trend looking for 0.026, but it is still below the EMA-100 so it can easily turn around.
To confirm that it has bullish strength, we should expect a cross of EMA-50 and EMA-100 and for the value to fluctuate on both EMAs.
LEVELS:
SL: 0.017
TP1: 0.026
TP2: 0.048
All these strategic alternatives can be configured with TradeX BoT, since it will allow you to position in both directions without having to block any amount per position. It will only be necessary for the conditions to be met, either downwards or upwards, for the orders to be executed in one direction or the other, taking the necessary deposits from your wallet.
TradeX BoT (in development): Tool to automate trading strategies designed in TradingView. It works with both indicators and graphic design tools: parallel channels, trend lines, supports, resistances... It allows you to easily establish SL (%), TP (%), SL Trailing... multiple strategies in different values, simultaneous BUY-SELL orders, conditional orders.
This tool is in the development process and the BETA will soon be ready for testing.
FOLLOW ME and I will keep you informed of the progress we make.
I share with you my technical analysis assessments on certain stocks that I follow as part of the strategies I design for my portfolio, but I do not recommend anyone to operate based on these indicators. Get informed, train yourself and build your own strategies when it comes to investing. I only hope that my comments help you on your own path :)