GALA ideasit could pump from here,
drop to POC
or drop to VAH.
its worth the risk. lost and lost of confluence .
ENTRY SHORT >> 0.0550
stoploss >> 0.05888
TP1 1 > 0.04210 (poc)
TP 2 > 0.0375 (val)
TP 3 > 0.03355 (618 fib
!!-- DONT FORGET YOUR STOPLOSS --!!
GALAUSDT

GALAUSDTWish bull isn't over greed will eat us alive.
break the fourth time
Forgive me, Hera, I cannot stay
He cut out my tongue
There is nothing to say
Love me, oh Lord

#GALA with in Triangle Pattern.#GALA in a Triangle Pattern.
waiting for that reaction, if it bounce up it could make a fake breakout and go back to the last Resistance to Test it before it keeps up.
2nd Scenario is that i will go straight up
1st Target is than 0.0644

GALA update Gala in up-wave and its clear that next target is 0.715
Today or maximum tomorrow we will reach it
Over all its a bearish pattern and ill sell it soon
Stop lose is mandatory.
GOOD LUCK

LONG GALA NOW!We have a bullish formation and an inverted shoulder head shoulder
Probably the easiest long in modern history.

GALA is about to melt faces...again!Many bullish factors here like the 200 daily MA and 50 MA fixing to cross, 200 EMA support and ascending channel as well. Let's go GALA games!! :D

GALAUADT 4h
Let's take a look at the GALA/USDT pair. This coin is putting on a show in graphical analysis. Notice that after that high in the first week of January, it formed a nice smooth bullish trough currently it has reached another support zone of that trough. We have two possible moves here.
First: The continuation of this channel, GALA could go up to 0.0527 and pull back up
Second: Rejection and retreat from Channel , for a downward movement towards .
The prognosis is favorable, as it is one of the main coins of the metaverse.
Here are the supports and resistances in the 4H:
Main support levels : 0.05393 / 0.04726 / 0.04205
Main Resistance Levels : 0.05962 / 0.06873
I'm not a financial consultant. The content I share on this site is for educational purposes and is my own personal opinion.

the great short on GAlusdtlooking at the structure it made a swing high of 2,65 after which it drops to 2.443,expecting a retest of that zone before the sell off.
Also gal tokens will unlock 18.5m $ worth of it on the 5th of february by 1pm GMT. based on price actions and traders waiting for tokens a sell off is possible ...i will place a strong bids at 2.63 till 2.85 for a spike in price to short squeeze traders.

GALA ShortGALA seems to be in the C wave
of a Expanded Flat corrective sturcture
subwaves 1&2 of wave C are over and
we see a continuation of subwave 3 towards the downside

We caught a wild Pacman's attacking...As we can see we have a huge Pac-man. Pac man loves to eat, and as he eats he gets bigger. So if this Pac-man is huge that means he is getting ready to eat again eventually until his tummy is full.

Gala/usdtImportant resistance has been broken, which has now become a valid support area. We will move towards the set goal by observing stop loss.
Footnote: personal opinion

#Gala | #UsdtI think #Gala is bearish (5M)
Targets : green lines
Don't risk more than 3% of capital.

GALA analysis ...Hello guys...
As you have seen over the past few weeks, the cryptocurrency market has been very bearish and no signal has been observed to change the trend. I still encourage you to short position.
here we have #gala, this cryptocurrency formed in a bearish channel and in my opinion will break main lower low (main support level).
but be aware if this channel break up top line it will be bullish for a few weeks at least.
always do your own research.
If you have any questions, you can write it in comments below, and I will answer them.
And please don't forget to support this idea with your like and comment.


GALA moved 30% today.GALA moved about 30% up today and was mentioned on the top gainers' list.
The price is inside an ascending channel, and after touching the bottom of that channel, it gets a pump and reaches the top of it.
There are three support areas on the way down and one resistance on the way up; the price will continue to increase inside this ascending channel for now.
I'll update this chart when the price comes around the solid resistance.
Do you agree with this chart? Let me know if you do, and if not, challenge it.
Thank you for your time; I hope this was helpful.

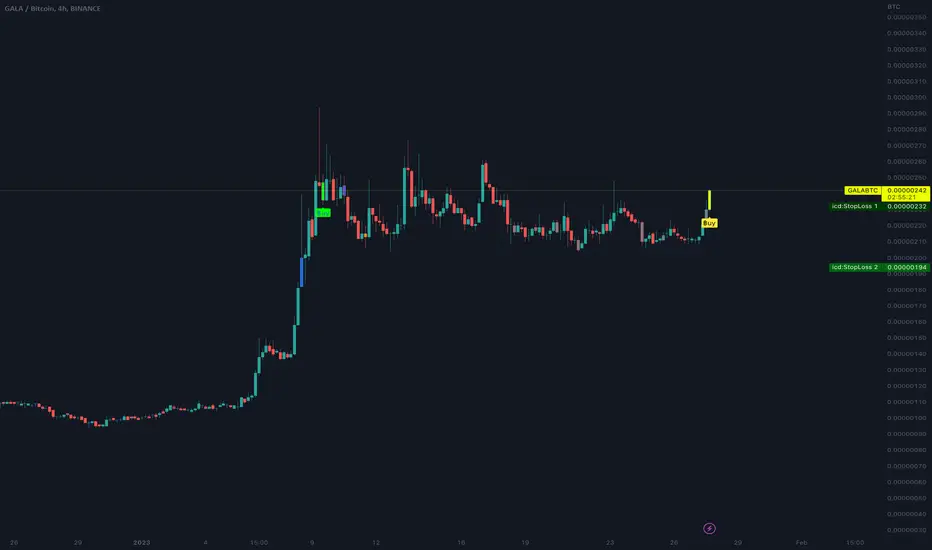
GALA GAMES - GALA Coin Price PredictionIn this chart you can see GALA GAMES - GALA Coin is in a good trend on the 4 hour chart. It has broken the resistance level and now it is retesting the old resistance as a support. Nice Buying area in my opinion.


GALA more pumperino! At the bottom of this range here and still consolidating after the large impulse move. Looking for another move up here. LOW LEVERAGE ONLY! This is a very fast moving coin up or down.

GALA short idea (again)the same ideea i had for the past few days but got sstopped out because 1: i was to early . and 2: still not waited on enought conformation but anyway... that MF stoppe A LOT of shorts out a few times.
so here im back witn another analyse, a bit diff as the past on nut this on, simple to understans.
this is how im trading it at the moment. when that thing stops me out 1 more time.... i will not look at gala for a long time haha.

GALA Echo bubble targetsGALA, when it pops, pops extremely violently. You blink and it's done a 9x.
Now that it is over the 200ma, some very interesting things can happen. Bearish bias is wiped out, and momentum will begin to markedly shift.
I've set some targets for a potential echo bubble around .15, .19, and .29, assuming we don't see the same strength as we saw during peak bull euphoria.
There's some news about a 500M quarterly burn that could help sustain in this resistance area.

GALA Games/Music/Film to 9 Cents? Measured move to 1.272 to 1.414 is 9 cents off the Bull flag, Fell straight Down not much Upper resistance, and GREAT Project, starting a burn mechanism, but still net possitive in mint quantity, once the game sbecome more active the demand will skyrocket, 0.015 low, Actually managed a buy very close to that myself. and up 3.3 X off that low. but lots of room to grow. Hold long term, ATH 0.84 Cents 16X from here!
