GALA chart from a different perspective / Plan HI think the technical chart is like a galaxy, and the easier it is to look at it from a distance.
GALAUSDT


GALA : SCALPINGRetesting the ascending channel if break out then going up to higher resistance
Trade safe n fun always SL.

galaI think gala is taking some time before going to the moon. this is most expected scenario for gala. Might go to 0.40 in next weeks then will go down to break 0.153 level to have a complete correction.
peace :)

GET READY! GALA could be ready to MOON! (Part 1) 🚀🚀🚀Hi everyone, This is The Unbounded. One of the newest and most active trading view authors and fastest-growing communities. Please consider following me for the latest market updates and mid and long-term Long / Short calls. Let's get to the chart!
GALA is gearing up for another bullish rally. GALA is under a symmetrical pattern and we can expect a higher rally soon.
While symmetrical triangles can be aimless as there equal amounts of buyers & sellers, Bitcoin and Ethereum are regaining strength and both Gala Games and Sandbox have been displaying signs of strength (while many other crypto game tokens have shown significant weakness).
The RSI for GALA has been trending up for the last 31 days and is only in the middle of its range; it has not reached anywhere near overbought. This further validates that there is more upside pressure in the price than downside.
My goal is not to highlight a specific trade at this time, but to get GALA and SAND on your radar to start tracking them as they could have massive rallies in the very near future.
⭐ If you liked this content, please consider subscribing and giving it a Thumbs Up 👍. If you have any feedback or suggestions, please leave a comment below as I answer each comment.
Namaste 🙏


Gala's Bearish Rectangle 🩸 🩸 Gala is now forming a bearish rectangle on the 15 minute chart, while bitcoin is expected to drop even further in the up coming hours. We're expecting a drop towards 0.2318$ on Gala, so stay tuned for more updates.

Gala USDT AnalysisGala USDT Analysis in Daily Time frame breaks the descending trend line
It's Gala's time.


Here is analysis for #GALAGALA Gaming in Daily Timeframe is still below descending trendline.
Bull need to cross EMA100 ($0.26) to take control and break the trendline,
If bull take control and break trendline and close above Resistance Level ($0.26 - $0.28) we will see another bull ran.
Send IT to $1.00

GALA / USDTAs you can see in the chart GALA in TIME FRAME 4 H is in this pattern if it can break it up we can see movement to the up if not we see DOWN movement
Follow my chart and keep eye on the line I draw to be broken
All my Analysis is for the short term and maybe a day it's not gonna work for a long term I'm a day trader
WRITE ME YOUR OPINION IN THE COMMENTS
*DO NOT FORGET TO USE STOP LOSS IN YOUR TRADES *
GOOD LUCK

GALAUSDTGala breakout possible ! wait for breakout then retest and enter for long .
im bullish but do your own research .

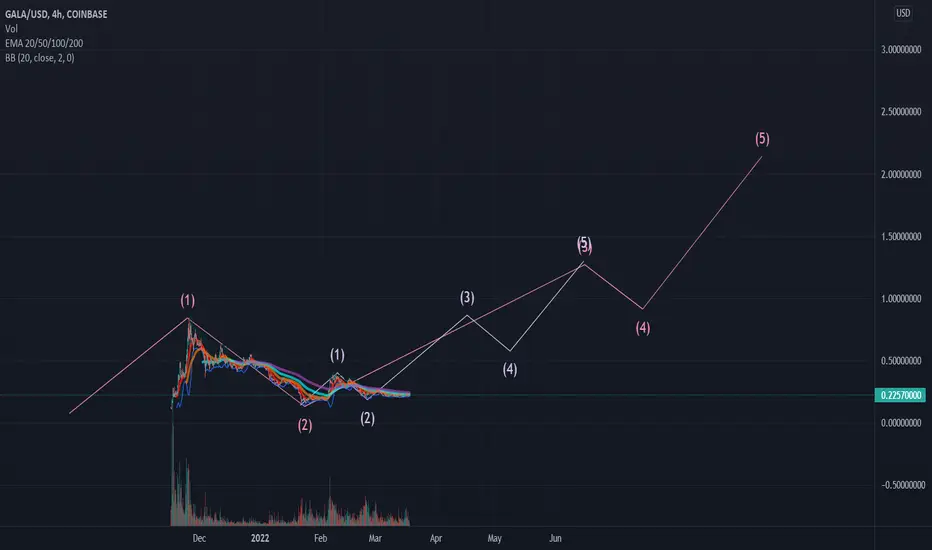
gala/usdTesting/tracking elliot wave theory. Please do not trade off idea without S/L. Not financial advice.
Link to previous chart:
My bottom call was hella off. Shit went way lower than my predictions. The chart is still on the 4h timeframe, it looks like we've bottomed out and its in the accumulation phase. I can see a giant cup and handle forming so it's a good time to accumulate now while its at the bottom of the cup. Not Financial advice.
GALA - MOONTIME !Hey traders,
The chart shows a Positive divergence in the RSI indicator.
You WILL see the Buy signal in the stock indicator,Maybe to night.
You can see the broken downtrend line.
Will it reach the moon?
Do not forget to use Stop loss.
Please like and share.
Thank you.

GALA - THE GOLDEN BOX🎁Please support this idea with a LIKE👍 if you find it useful🥳
Not a financial advice🙅🏼♂️
This is Gala’s accumulation phase. This consolidation started 4th March, 2022. Price has been ranging within $0.21 & $0.24.
Inside this golden box, we have smaller boxes too. One special feature of Gala is that after it consolidates, it breaks out and pump hard.
Here is how the first gala consolidation turned out
Therefore, after a successful breakout from this golden box, I expect a great pump to gala all time high at $0.84 and above it.
What do you think?
Share your opinion in the comment section✍️
You can also demand for analysis of your preferred coin
Follow me stay updated about this coin and more helpful projects like this🎁
Happy Trading💰🥳🤗

GALAUSDT - SETUPGALAUSDT price is moving with a rising trendline and looking positive. If the momentum carries itself we could see an upsurge. So buying on dips will be a good strategy.


GALA/USDTAbout to Break out up ........................................................................................................................................................................................................................................................................................................................................................................................................................................................................................................................................


Buying GALA/USDT BUY SetupGALA Retest support trend line after breakout symmetrical triangle
MACD Daily bullish crossover , Stochastic showing oversold zone
Positive confirmation from all indicator , we can setup for entry
Stoploss : $0.208
Risk : 5%


WHAT I SEE ON GALA CURRENTLY...
------------------------------
Given the sensitive market conditions, the above possible scenario can easily be defeated. You can enter with a reasonable loss limit and low risk profit margin.
-Good day-

GalaUsdt - Continuation rising wedge pattern 15min.We have here pretty good looking continuation rising wedge pattern. Price has pushed down to EMA 20 and its going to test both VWAP and EMA 20 at the bottom of the wedge pattern, If it breaks and retests we have a pretty good looking short here.
