GALAUSDT - Excellent reversal happening at support and can flyGALA has been on a downfall for a while and was in a parallel channel and now it is forming a downward wedge too. Above the resistance and with increase in volumes these should fly faster. RSI is also in the over sold territory and is also reversing well. Excepting some volume push and when it happens these are going to move faster. #Patience.
GALAUSDT

idea for gala longgala is have a long position happ for this if :
IF USDT.D HAVE AN DOWN GALA IS UP .
HAPPY

Gala token price prediction 24 Jan 2022
Gala chart is forming a inverted head and shoulders pattern in the 1hr time frame.
We may see the price rally up to $0.22 in the next 24hrs.
That's provided, no major bad news come out of the fed meeting tonight.

Gala Games is WAYYY OVERSOLD.... Peep why I bought Not only do the charts offer 13:2 risk-to-reward ratio, but Gala Games "Town Star" game is gaining in popularity.
Google trends and SEMrush both indicate that search volume for "town star" is increasing.
Not to mention that Gala has tremendous price support beneath its current levels.
If the market offers the opportunity for me to take profits over the short term, I will...But I DON'T mind holding Gala long term with an entry at this level.

Gala Games is WAYYYYY oversold. Went in on this todayDisproportionate risk-to-reward returns here. Unstaked some stables to have more ammo for the upside

Over all look of GALAUSDT, Short medium and long term. Hi everyone!
Daily/Monthly GALAUSDT
Gala is is not out of the woods yet, Just like the entire crypto market it has suffered the pressure form the fall of BTC, saying this the future is bright for Gala just as many other gaming tokens I can see it taking a big chunk of the crypto gaming market in the future due to their fundamentals and features also not to mention the solid team behind .
Currently trading $0.19 If failing to hold above $0.15 we can see it going back down to the strong support of $0.1. (Buy zone)
If we manage to accumulate at current support would be great so we could retest $0.33 in the near future.
Stochastic RSI currently in over sold area, I would Dollar-cost average (DCA) long positions in case it falls, all this due to the movement of BTC if it moves down to $29k.
ALWAYS look for extra confirmation before making any trade.
If you like mi idea, pls feel free to like-share-follow.
Happy trading people
(No financial advice)
DISCLAIMER
The trading ideas, analysis, and comments above should not be considered financial advice or recommendation to trade or invest in any financial product. Your personal situation has not been taken into consideration in the trade ideas. This page is for general educational purposes only. Do not buy or sell any product discusses on this page before doing your own research DYOR. Always do your own analysis and research and be aware of the risks involved in trading any financial product :)

GALA is a game changer platform Hello traders
After a while, GALA price is very interesting with touching AVWAP & OS RSI. At this time, price is 0.189
It's really good project of blockchain gaming + NFT market place + play to earn & many more.
I will add more and hold for next years. It can become next AXIE or MANA.
For more, please follow here and Twitter.
Thanks for reading.

GALANot financial advice.
The essence of investing & trading is the intelligent and patient preying on the greed, fear, impatience, addiction and ignorance of the majority. It's definitionally Darwinian.

GALANot financial advice.
The essence of investing & trading is the intelligent and patient preying on the greed, fear, impatience, addiction and ignorance of the majority. It's definitionally Darwinian.

Gala Chart Update 22th Jan 2022Some update on gala. Today gala has managed to cover up the big gap up run up since 17th Nov 2011.
A big pullback and the price retracement of 82%. We may see a bottom here.
Currently the rsi is oversold and the stochastic is resting at the bottom on the day time frame.

GALA GALAX 5 WAVES completed. ABC correction targetsSimple basic chart, very new, not much data, clear 5 waves, still in early phase if has LT potential
BUY in at extreme lows to accumulate.
ABC correction targets in blue box between 1-1.236% in 3-7 or 11 swings low.
I wouldnt consider a long here at the 100% fib extension as the 1.618 reaches too low for this chart. With current BTC scenario, must be prepared to DCA and hodl in case of extreme lows.
Nothing bullish on this chart except lower accumulation targets for spot buying based on ABC targets.
NFA . DYOR.
Just sharing ideas. Feel free to leave comments, hit like to show support and if you manage to hit targets from these ideas, please let us know.
Tips are always welcomed :)
Thank you for viewing, sharing and safe trading to you all!

GALA : WHEN TO EXPECT A DECISION? Gala has gone off track (the track i draw in previous analysis)
I extend it and discover it has the same timeline with BTC ichimoku cloud
(See below) ... So it may sideway longer
.
- Don't buy until break up descending triangle
.
Trade safe and fun <3
Feel free to feedback /comment
$SAND $MANA $GALA Why Why Why Correct to below Fibo 0.382 level?$SAND you held so much promise as the Leader
$MANA you too as Challenger
$GALA you as well as Dark Horse
Why Why Why, Now you are Below Fibo 0.382 level
Are you just a Fad or will you come back Stronger
Let's see. NFA DYOR

GalaGala long-term investment
I don't speak much about my trades or explain much.
But if you are looking for some good profits, you can trust us 🐋👊
Try to get gala 😇
Hold long-term, and just don't sell , dont sell , dont sell 😍
Good luck

EURUSD 4H & Daily TA : Bullish or what? If the price can close above 1.14 and maintains this X-Point support range, we can expect growth to the specified levels that i marked on the chart .
Targets: 1.1438, 1.1467 and 1.1483 ...!
Follow our other analysis & Feel free to ask any questions you have, we are here to help.
⚠️ This Analysis will be updated ...
👤 Arman Shaban : @ArmanShabanTrading
📅 18.Jan.22
⚠️(DYOR)
❤️ If you apperciate my work , Please like and comment , It Keeps me motivated to do better ❤️

GALAUSDT, First buy zone activateHello everybody
GALA is one the most amazing game and the co-founder of it that makes many games, one of the most game is zynga poker and GALA in months later wanna do ...
If you want to learn Fundamental & Technical analysis Send us messages in private ---> Our Social media id is in profile
According to the chart and previous analysis we published, we shown on chart that we are completed B wave of correction and we need to complete wave C.
As you can see the price reach to our PRZ level we expect the price should finish correction in these PRZ level and wave C can be completed in one of these zone.
The price after some consolidation and squeezing can jump and start move upwards to the target and maybe to new ATH.
If you have any questions send us messages
Good Luck
Abtin
Previous analysis :

$GALA The green zone highlighted should be the ideal Buy range - IMO.
The chart looks pretty typical.
It might get further down by 5 to 10% to reach the Major Bullish range., where the volume needs to pick up
above the Orange Line.
The Trend line looks to be the major resistance for the structure to break out.
The chart turns bullish either :
1. Volume picks up accumulating in Green Zone.
2. Breaks Resistance zones shown in Yellow.
The Chart turns further bearish either :
1. Breaks further down the Green Buy Zone
2. Further drops in Volume.
Not a financial advice
DYOR.
Happy trading

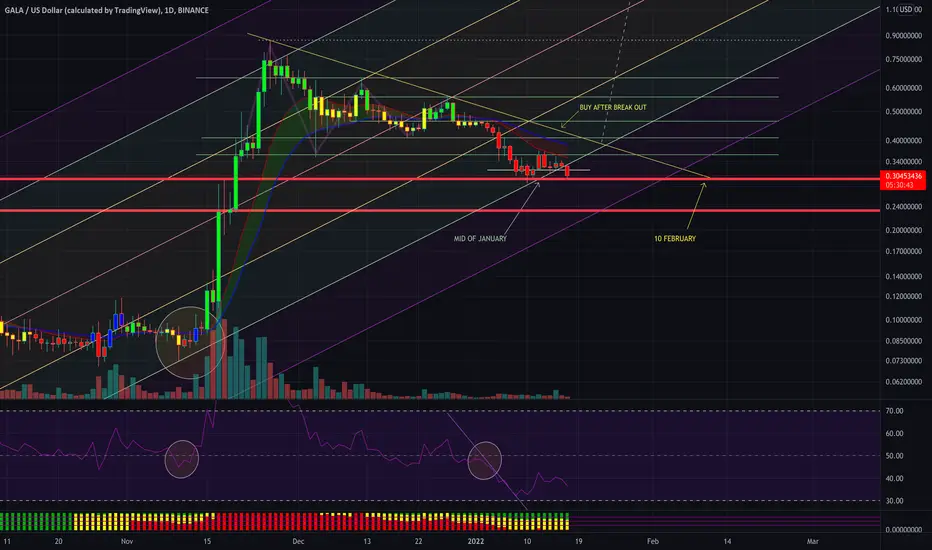
Galausdt: Pull back patternHello traders!
There is a pull-back pattern after a breakout S/R level. This pullback can take Galausdt to 0.356 price.
Stoploss is -2.1% @ 0.3105
Target is 12% @ 0.356
Suggestel leverage is 10x
Don't forget to hit the like button and follow to stay connected.

RNDR Contracting GPU Power Via Blockchain TechWish I would have bought some when Dave Lui dropped the alpha on it last year. RNDR is on the SOL blockchain. It appears as if SOL would be best suited for video games. Could we see popular NFT/ Metaverse coins transition from ERC-20 and go to the SOL blockchain? If so wouldn't a partnership with RNDR to offload some of the GPU workload be cool. Just a thought. Stick to TA. I'll be looking to start a position at outlined levels and take profit at 1.272.

Buyer power seems to be low!The price is close to the dynamic support range. be careful .
In my opinion, the price will decrease more.


Gala Elliott Wave chart, Double ZigZagHad This option back at the pivot. Looks like its playing out pretty good. Could be done and bounced out of the GZ, but would want to wait for at least the .36 to get flipped back to support, or if it breaks down below .28607 the POC and the low of the consolidation.

Gala token price prediction 15/01/ 2022Gala game token currently resting on the support trendline $0.324.
If Gala break below this support trendline, it may drop to $0.252 according to the next fibonacci retracement.
Market is waiting and anticipating for Fed interest rates rise announcement soon.
Depending on Bitcoin price performance . If BTC falls, gala will follow. Currently crypto is trading sideways.
