GALA GOING TOWARDS ACCUMULATION ZONEGALA is falling sharply towards accumulation zone near 0.04 area. WHEN BTC stops playing or it goes up then we might see another good pump in GALA. So expecting correction for few more days.
GALAUSDT

GALA, the next SOL? 172% upside potentialGALA / Daily
- My friend is deep underwater, so I want to give him some hopium
- SOL went massively up this year, trend was even better once we breached the ascending channel, and then re-tested it successfully
- GALA recently broke through its ascending channel, and a correction of -36% occurred.
- If BTC holds and we close the candle above the support line, we can target $0.146 to start with

GALA/USDT bullish horizon from support? 👀🚀GALA Today analysis
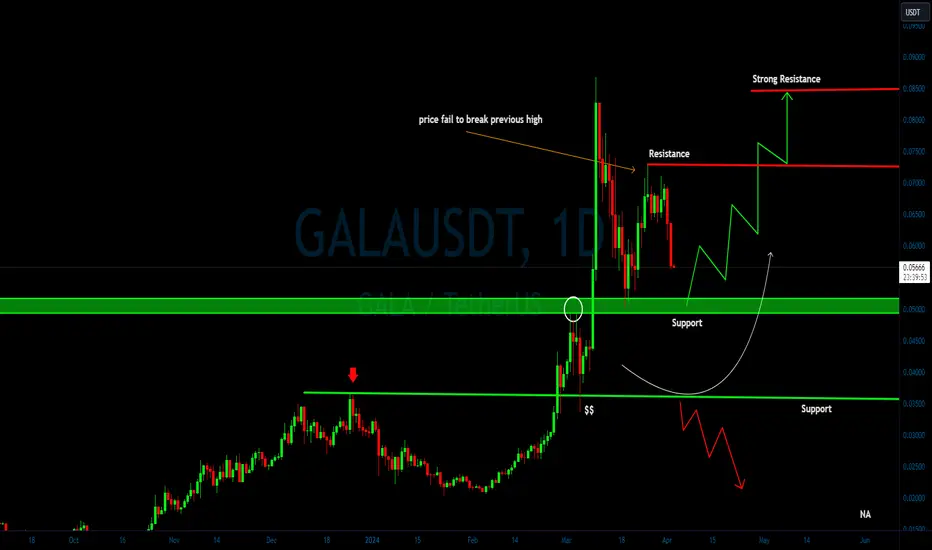
💎 Paradisers, let’s delve into the intriguing movement of #GALAUSDT. Currently, it is retracing and meticulously approaching a critical support level at $0.04965. This level holds immense significance, and its ability to transition from a mere retest to a robust support could be the harbinger of a potential bullish surge.
💎 Since the price of #GALA has failed to break the previous high, short-term bearish sentiments are prevailing. However, as of now, the price approaches the key support level at $0.04965. If it maintains its momentum at this crucial juncture, we may witness a delightful bullish reversal. Picture it: the price ascending, breaking free like a phoenix from the ashes.
💎 But ah, the markets are fickle, my friends. Should the price of INDEX:GALA dip below this pivotal zone, our strategy must adapt. Brace yourselves! We anticipate a bullish rebound from the secondary support level at $0.03627. Failure to reclaim ground here could spell further declines. So, stay vigilant, stay nimble, and let’s navigate these market fluctuations with grace and precision.
GALA: buy in wedge📊Analysis by AhmadArz:
🔍Entry: 0.06513
🛑Stop Loss: 0.06354
🎯Take Profit: 0.06674 - 0.06832 - 0.07012
🔗"Uncover new opportunities in the world of cryptocurrencies with AhmadArz.
💡Join us on TradingView and expand your investment knowledge with our five years of experience in financial markets."
🚀Please boost and💬 comment to share your thoughts with us!

GALA UPDATE 12HThis is an update to the analysis you see in the "Related Ideas" section
It responded to the range of the previous analysis, but we expect the area we specified in this update to be retested.
The targets are clear on the chart.
Closing a daily candle below the invalidation level will violate the analysis.
For risk management, please don't forget stop loss and capital management
When we reach the first target, save some profit and then change the stop to entry
Comment if you have any questions
Thank You

GALAUSDT: THIS WAY IN 4hr TimeFrameHello my friends.We see the chart of Galausdt and be assumed the ABC correction at above of weekly base so I expected the price in the downtrend to reache the 0.03702

#GALA/USDT#GALA
The price is moving in a bearish channel on a 4-hour frame and we have a support area in green at the 0.0500 level.
We have the highest stability with Movina discharge 100
Now we have a breakout that is about to occur well after bouncing from the green zone
Our RSI indicator has a trend that is about to break to the upside
Entry price is 0.05542
The first goal is 006252
The second target is 0.06802
Third goal 007298

🎮 GALA: Riding the Bullish Wave! 🚀🎲📈 Market Analysis:
GALA has experienced significant bullish momentum in recent days, indicating robust market demand and positive sentiment.
The current market pullback presents a potential opportunity for a spot-long trade, leveraging support levels for entry.
🔄 Trade Plan:
Entry: Consider entry in the support zone of $0.058 - $0.065, aligning with bullish momentum and market dynamics.
Upside Target: Target areas of resistance at $0.08 - $0.09 or $0.14 - $0.16, reflecting potential breakout opportunities.
Risk Management: Implement a tight stop-loss strategy just below $0.057 to manage downside risk effectively.
🎮 Strategy:
Monitor market dynamics, including gaming sector trends and broader market sentiment, for insights into GALA's performance.
Stay updated on GALA's developments, partnerships, and product launches to gauge future growth prospects.
Adjust trade plan based on real-time market data, technical analysis, and risk assessment to optimize trading outcomes.


GALA/USDT possible planBINANCE:GALAUSDT might move higher to 0.07 Cents, if BTC might try to move higher to 25K.
There are some indications that alts will be recovering from 90-98% price drop, but BTC has a gap on futures at CME between 19700 and 20500 which could be filled by dropping price down. There is another gap between 9600 and 10K. Price of BTC dropped since last ATH only 77% please have this in mind. Daily RSI indicating market overbought. So expect in short term correction of the price to 20K.
GALA price is ready go higher, at the same time be careful with BTC movement. GALA has crossed 200 MA line, and I expect it to retest it.
Not a financial advice.

GALA with higher lowGALA broke out of falling broadening wedge and making a higher low
touched the golden pocket and bounce upward
targets and stop loss on chart
Not Financial Advice

Gala/Usdt Looks Promising For Breakout Gala/USDT is currently showing signs of attempting a breakout on the 4-hour timeframe. If it successfully breaks above the trendline resistance, there is a potential for a 30-60% bullish move in the short term. Please note that this statement is not financial advice, and individuals should conduct their own research and analysis before making any investment decisions.

seems like gala getting ready for quick 35% bullish rally already in uptrend and getting ready for another breakout in hourly timeframe
testing trendline in hourly tf expecting successful breakout soon incase of successful breakout expecting 35% bullish wave

Keep an eye on this level!It's time to keep a close watch on GALA, which is gearing up for a big move! If you're looking to trade GALA at the moment, here's a quick setup that you might find helpful!
The idea is: Buy when the price breaks above 0.05955$ and take profits at the levels shown in the chart.
Targets:
1. 0.062$
2. 0.0655$
3. 0.068$
-------------------------------------------
About our trades:
Our success rate is notably high, with 10 out of 11 posted trade setups achieving at least their first target upon a breakout price breach (The most on TW!). Our TradingView page serves as a testament to this claim, and we invite you to verify it!

GALA/USDT upward journey from demand? 🚀GALA Analysis💎 Paradisers, dive into the fascinating shift of #GALAUSDT from supply to demand zones, hinting at a bullish wave on the horizon.
💎 Reflecting on #GALA journey, it has masterfully navigated through its Cup and handle pattern, traditionally sparking ascents. Now, as supply morphs into demand, the stage is set for a bullish leap from this pivotal level, aiming for higher supply zones with continued momentum.
💎 Conversely, should INDEX:GALA falter in its climb, pivoting to a bullish stance from the demand level at $0.03547 might be our next move. While the temptation to sell may grip newcomers at signs of struggle, the wisdom lies in holding off for a clear dip below this level before executing strategic trades.
Galusdt trading opportunityGALUSDT has been in a strong downtrend, and a significant rejection on an important trendline has further reinforced this bearish momentum. The market has struggled to regain strength, indicating a continuation of the downward move.
The recent breakdown of an important support zone has raised concerns. This development has increased the downside risk, potentially pushing the price towards testing the previous All-Time Low (ATL).
If the price fails to hold above the previous ATL, we might witness a massive drop, possibly leading us towards our projected target. It is crucial to keep a close eye on the ongoing market developments.

GALA USDT Bout to breakout?!Check out this setup. Highly likely that we will see a breakout to the upside.
Idea is:
- Buy the breakout
- Exit trade at one of the targets
Remember to set your stop losses and trade safely.

GalaUsdt Idea Gala/Usdt
It is anticipated that Galausdt will experience an upside breakout in the near future; however, it is premature to make a definite prediction. The prudent approach would be to observe and wait for a confirmed breakout before drawing any conclusions. If the breakout happens successfully, there is a possibility of a 30-50% increase in bullish sentiment. Please note that this information is not financial advice.

#GALAAt time d1, after exiting the density in the last part of the correction, a three-wave corrective step can be observed, which can be a pullback and in the golden zone of the end of the intermediate correction, and in the next step, it will move at least 100% of its own wave in the specified areas.

The GALA rocket has not yet run out of fuelIn the related analysis, you can see the previous analysis of GALA, we are from the bottom with GALA.
Our first supply was broken, now we have fixed on this supply.
It is expected to get support from the green box after one or two more tests.
The next target is marked on the chart.
Closing a daily candle below the invalidation level will violate the analysis
For risk management, please don't forget stop loss and capital management
Comment if you have any questions
Thank You

🎮 GALA Gaming Token Trade Setup 🎮
📉 Analysis:
Token Overview: GALA, a gaming token, has seen strong performance but recently corrected.
Market Context: Anticipate a relief bounce pending stability in BTC, which could affect GALA's movement.
Risk Consideration: This scalp trade is high-risk due to BTC's influence; tight stop-loss is crucial.
📊 Trade Setup:
Entry Point: Consider a long spot trade within the $0.058 - $0.065 support zone, pending BTC stability.
Target: Take profit at $0.07, with the next resistance at $0.08.
Stop Loss: Set a tight stop loss just below $0.056 to manage risk effectively.
📈 Note: Given the speculative nature of the trade and its dependency on BTC's movement, closely monitor market conditions and adjust the strategy accordingly.

#galal/ usat#gala
The price is moving in a downward channel on frame 1. hour.
We are about to break that channel upward.
We have higher moving average. 100.
We have a trend on the RSI indicator that is about to break
,the entry price 0.07132.
The first target is 0.07152.
I The second target is 0.08152.
Third target is 0.08827.

GALA Primed For More Upside In Crypto - How To Buy The DipsThis current dip on GALA will be the last best buying opportunity for it's current trend.
Crypto is famous for running flat corrections that make higher highs and higher lows. In fact, it's the most popular type of correction in all bull markets.
These types of corrections leave traders chasing after price as they are uninformed on how to take advantage of them.
In this video, I share how to buy the dips on GALA starting with this one. I share two trade setups with two different strategies and clear step by step conditions that need to get met in order to execute this trade.
Let me know in the comments if you agree or disagree with the upside I'm projecting. Do you think these trades will work out?
Follow if you want to make 2024 your most transformational year in the crypto markets. I'll take you by the hand in these Tradingview updates.
I've been trading in crypto full time for over 6 years since 2017 and I've thrived through every bull market, outperforming bitcoin's performance every time. This bull market will be the same.
But..
It's going to take strategic navigation of shifting between crypto's and some diversification.
I leverage expert research companies to feed me the next best projects coming out and then I overlay my technical system to the charts to time my entries, manage my risk, and maximize my profits.
Join me in making 2024 another life changing year!
