GALA price analysis🪙 Please tell us, is the #GALA project still "alive"?
It's old, has gone through many cycles on the crypto market, and hasn't died yet.
Maybe now (being related to the CRYPTOCAP:ETH Ecosystem) is the best time to “come back to life”?
For this to happen, the price of OKX:GALAUSDT must finally:
1️⃣ confidently hold above $0.01390-0.01460
2️⃣ continue to grow confidently to $0.044
3️⃣ And finally, rapidly grow to $0.10-0.11 by the end of the year.
Is this a realistic scenario? Write your thoughts in the comments.
Galausdtanalysis

GALA/USDT | Testing Critical Historical Support – Rebound?🧠 Full & Professional Analysis:
GALA/USDT is currently sitting at a critical inflection point on the weekly timeframe. The price has returned to a major historical demand zone between $0.01200 – $0.01400, which has served as a strong support base for over a year.
This level has repeatedly acted as a launchpad for rallies since early 2023, making it a high-interest area for long-term investors and swing traders.
🔍 Key Technical Structure & Zones:
🟨 Major Weekly Support Zone:
$0.01200 – $0.01400 → A historically proven demand zone that has held multiple times. A stronghold for buyers, and a potential accumulation base.
🟦 Layered Resistance Zones (If Rebound Occurs):
$0.02176 → First minor resistance; initial confirmation of a bullish reversal.
$0.03432 → Mid-range resistance within current consolidation.
$0.06044 → Key breakout level to shift trend structure.
$0.11093 – $0.18485 → Medium-term targets if bullish momentum builds.
$0.26464 to $0.72473 → Historical distribution zones if full recovery unfolds.
🟥 Bearish Risk Zone (Breakdown Scenario):
Break below $0.01200 opens downside risk toward the all-time low at $0.00571, or even lower if sentiment worsens.
✅ Bullish Scenario:
If the $0.01200–$0.01400 support holds:
1. A bullish engulfing candle on the weekly chart could be an early reversal signal.
2. Potential formation of a double bottom in this demand zone (yet to be confirmed).
3. Initial target at $0.02176, with possible extension toward $0.06044—a major pivot zone.
4. Sustained buying and volume confirmation could push GALA toward $0.110 – $0.184 in the mid-term.
❌ Bearish Scenario:
If the price fails to hold above $0.01200:
1. A breakdown may trigger a capitulation move to the $0.00700 – $0.00571 range (historical lows).
2. This would invalidate the current sideways base structure and extend the downtrend.
3. Lack of buying interest could open the door to deeper losses.
📐 Pattern & Technical Context:
Accumulation Base Formation: Still possible if support holds and buyers step in.
Tight Range Compression: Price is coiling at the bottom, indicating a potential breakout move soon.
No major reversal patterns confirmed yet, such as Inverse H&S or W-bottom, but structure suggests accumulation pressure.
🧭 Summary:
> GALA is dancing on the edge of a crucial support level. The price action in this zone will likely determine the next major direction. A bounce could ignite a multi-week rally, while a breakdown may send the asset to new lows. Volume and weekly close will be key confirmation points.
📊 Recommendations:
Swing Traders: Watch for bullish candle patterns and breakout above $0.02176.
Long-Term Investors: Consider conservative accumulation in the support zone with clear risk management.
Bearish Traders: Wait for confirmed weekly close below $0.012 before considering short setups.
#GALA #GALAUSDT #CryptoTA #AltcoinAnalysis #WeeklyChart #BullishSetup #BearishScenario #TechnicalAnalysis #AccumulationZone #BreakoutWatch

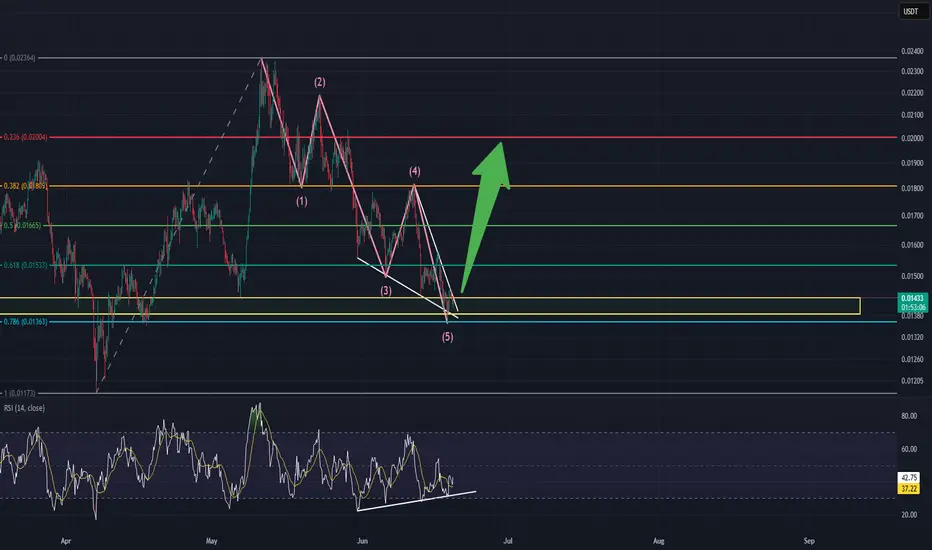
GALA/USDT - 4HR TIME FRAME - BULLISH!!This chart illustrates a bullish reversal setup using Elliott Wave Theory, Fibonacci retracement levels, and RSI divergence. Here's a detailed breakdown:
📉 Elliott Wave Count:
The chart shows a complete 5-wave impulse down labeled (1) to (5), suggesting a potential end of a bearish trend.
Wave (5) appears to have just completed, indicating a possible reversal point.
🔍 Falling Wedge Pattern:
A falling wedge is visible between waves (4) and (5), which is typically a bullish reversal pattern.
Price is near the wedge’s apex, hinting at an imminent breakout.
🟡 Strong Demand Zone:
Price is currently inside a yellow demand zone (roughly $0.0136 to $0.0144).
This zone coincides with the 0.786 Fibonacci retracement level at $0.01363, a common reversal level.
📊 RSI Indicator:
The RSI at the bottom shows a bullish divergence:
Price made a lower low, while RSI made a higher low.
This signals weakening bearish momentum and potential upside ahead.
🧠 Summary:
This is a technically sound bullish setup, suggesting a bottoming structure and an upcoming uptrend. The confluence of Elliott Wave completion, wedge breakout, RSI divergence, and Fibonacci support all point to a strong reversal probability.
GALAUSDT 1W AnalysisGALA ~ 1W Analysis
#GALA Buy at support block if you still have confidence in this coin with a short term target of at least 20%+ from here.

GALAUSDT 1D AnalysisGALA ~ 1D Analysis
#GALA Buy back on retest of this support block with short term target of at least 15%+ from here.

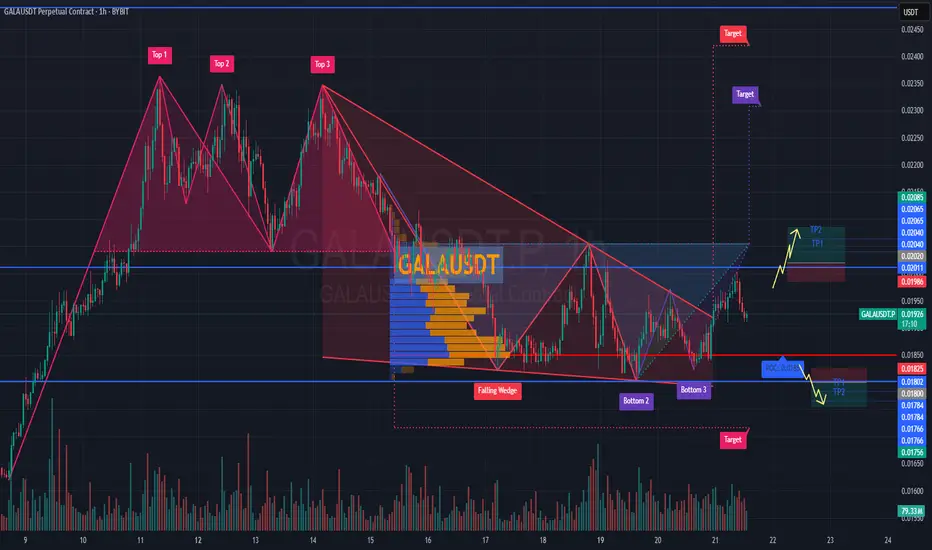
Forecast for #GALAUSDT📉 Forecast for BYBIT:GALAUSDT.P (1H TF)
🕒 Current Situation: The price is in a key decision zone near POC $0.01851, consolidating after a breakout from the Falling Wedge pattern.
➡️ The direction depends on the reaction to this area.
✅ Overview:
➡️ A Triple Bottom (Bottom 1-2-3) pattern is visible — a bullish signal.
➡️ Price broke out of the wedge and is now retesting.
➡️ Two scenarios remain: LONG if support holds or SHORT if it breaks.
📢 Bullish sign: candle wicks down + rising volume on bounce.
🧭 Watch price action and volume near $0.0185–0.0190.
************************
📈 LONG SCENARIO - Conditions: Holding above $0.0190
Entry: BYBIT:GALAUSDT.P from $0.02020
🛡 Stop loss: $0.01986
🎯 TP Targets:
💎 TP 1: $0.02040
💎 TP 2: $0.02065
💎 TP 3: $0.02085
📍 Confirming bullish strength after wedge breakout.
**************************
📉 SHORT SCENARIO - Conditions: Break and close below $0.0185
Entry: BYBIT:GALAUSDT.P from $0.01800
🛡 Stop loss: $0.01825
🎯 TP Targets:
💎 TP 1: $0.01784
💎 TP 2: $0.01766
💎 TP 3: $0.01756
📢 Confirmation: high volume + multiple closes below POC.
⚠️ Losing $0.0185 reactivates the bearish structure toward $0.01700.
🚀 Conclusion: We are in a decision zone.
📍 Hold above POC = bullish setup.
📍 Breakdown = bearish setup.
📢 Wait for confirmation with volume and price reaction BYBIT:GALAUSDT.P
#GALA/USDT
#GALA
The price is moving within a descending channel on the 1-hour frame, adhering well to it, and is heading for a strong breakout and retest.
We are seeing a bounce from the lower boundary of the descending channel, which is support at 0.01688.
We have a downtrend on the RSI indicator that is about to break and retest, supporting the upward trend.
We are looking for stability above the 100 moving average.
Entry price: 0.01703
First target: 0.01725
Second target: 0.01754
Third target: 0.01788

GALAUSDT 1D AnalysisGALA ~ 1D Analysis
#GALA Buy after successfully penetrating this resistant line with a short -term target of at least 10%+ from here.

#GALA/USDT#GALA
The price is moving within a descending channel on the 1-hour frame, adhering well to it, and is on its way to breaking it strongly upwards and retesting it.
We are seeing a bounce from the lower boundary of the descending channel, this support at 0.01415.
We have a downtrend on the RSI indicator that is about to break and retest, supporting the upward trend.
We are looking for stability above the 100 moving average.
Entry price: 0.01504
First target: 0.01540
Second target: 0.01577
Third target: 0.016532

quadruple bottom In Gala GALA Coin – Quadruple Bottom Formation & Long-Term Accumulation
GALA is showing strong signs of a quadruple bottom pattern on the charts, a rare but powerful bullish reversal signal. This formation reflects a solid support level that has been tested multiple times, indicating significant buying interest and strong defense against further downside.
The accumulation zone is observed between $0.012 and $0.07, where long-term investors and smart money are gradually building positions. The price has consistently held within this range, suggesting consolidation and preparing for a potential breakout.
Given the prolonged accumulation and resilient support, a bullish bounce is anticipated within the next 3 months. If the pattern plays out, this could trigger a strong upward move as market sentiment shifts and buying volume increases.

GALAUSDT 1WGALA ~ 1W Analysis
#GALA Buy gradually from here if you still have a Conviction on this coin with a short -term target of at least 20%+.

GALAUSDT 1WGALA ~ 1W Analysis
#GALA This is the lowest support for now. Buy from here if you still have a Conviction on this coin. with a short -term target of at least 20%+.

GALA/USDT BUYHello friends
Considering the price reaching the bottom and reaching good support, now is a good time to enter two buy steps. We have specified for you that you can buy steps.
We have also specified price targets for you.
*Trade safely with us*

#GALA/USDT#GALA
The price is moving in a descending channel on the 1-hour frame and is adhering to it well and is heading to break it strongly upwards and retest it
We have a bounce from the lower limit of the descending channel, this support is at a price of 0.01674
We have a downtrend on the RSI indicator that is about to break and retest, which supports the rise
We have a trend to stabilize above the Moving Average 100
Entry price 0.01870
First target 0.01870
Second target 0.01993
Third target 0.02129

#GALAUSDT is breaking resistance – expecting a moveBYBIT:GALAUSDT.P is trading near the key $0.02490 level, forming a consolidation zone before a potential breakout. Volume is increasing, and price is holding above POC $0.02255, confirming strong buyer activity. A breakout above $0.02495 could trigger an accelerated move toward $0.02520 – $0.02565.
📈 LONG BYBIT:GALAUSDT.P from $0.02495
🛡 Stop Loss: $0.02460
⏱ 1H Timeframe
✅ Overview:
➡️ BYBIT:GALAUSDT.P is approaching $0.02495, a key resistance level.
➡️ Price remains above POC $0.02255, confirming strong buyer interest.
➡️ Increasing volume supports the potential bullish move.
⚡ Plan:
🔵 Holding above $0.02495 increases the chance of an uptrend.
🔵 Main support at $0.02460 – losing this level invalidates the setup.
🔵 Target zones – $0.02520, $0.02540, and $0.02565, where profit-taking is expected.
🎯 Take Profit:
💎TP1: $0.02520 – first profit-taking zone.
💎 TP2: $0.02540 – strong resistance level.
💎 TP3: $0.02565 – final upside target.
📢 Recommendations:
✅ Bullish confirmation requires a strong close above $0.02495.
✅ If price slows down at $0.02520, partial profit-taking is recommended.
✅ A drop below $0.02460 invalidates the setup.
🚀 BYBIT:GALAUSDT.P is breaking resistance – expecting a move to $0.02565!
📢 Holding above $0.02495 opens the door for further gains. Watch volume closely – if it weakens, price may consolidate.
📢 Entry above $0.02495, targets at $0.02520 – $0.02565.
📢 Partial profit-taking recommended at $0.02540.
📢 If price drops below $0.02460, the setup is invalidated.
📌 Strategy: Resistance Breakout + Profit Targeting at Key Levels.

GALAUSDT 1WGALA ~ 1W Analysis
#GALA Buy gradually from here if you still have a Conviction on this Coin with a minimum target of 20%+.

GALAUSDT: Long-Term Bullish Potential Despite Bitcoin DipGreetings, fellow traders,
This analysis presents a brief overview of GALAUSDT's current market position and potential for a long-term trade.
While the recent two-day uptrend of GALAUSDT has been influenced by Bitcoin's price fluctuations, the overall outlook remains positive for a long-term, long position. Despite the current dip, Gala demonstrates significant potential for growth. As indicated on the 4-hour chart, the price currently resides at the bottom of the ascending channel, which is a very good point to take a Long position, presenting a strong opportunity for an upward move.
I've identified three potential price targets for this long trade:
Target 1: $0.03610
Target 2: $0.03950
Target 3: $0.04100
BINANCE:GALAUSDT
These targets are based on the current chart.
Investors are encouraged to conduct their own due diligence and manage their risk accordingly.
Profitable trades to all!

GALAUSDT: Short Opportunity as Downtrend ConfirmedGreetings, Traders,
GALAUSDT has officially entered a downtrend, presenting a solid opportunity for short positions.
I recommend entering a short trade below the $0.03150 price zone.
Target 1: $0.03020
Target 2: $0.02910
A stop-loss order placed above $0.03250 could be considered to manage potential risk
Following the breakdown below the key support level, as seen in the daily chart, a short position is favored.
This is not financial advice. Please do your research before making any trading decisions.
Exercise proper risk management and set a stop-loss order according to your risk tolerance.
Profitable trades to all!

GALAComprehensive Analysis of GALA
🔹 Project Introduction:
GALA is a blockchain-based ecosystem focused on developing decentralized gaming (GameFi) and NFTs. The project aims to give players full control over their in-game assets while introducing a new economic model for the gaming industry.
📊 Technical Analysis of GALA/USDT
🔍 Overall Market Condition:
GALA is currently trading within a mid-term ascending channel and is sitting at a key support zone that will determine the next major price direction.
🟢 Bullish Scenario:
Key Support Zone:
$0.02435 – $0.02684 (Blue Box)
If this support holds, the price could move toward the midline of the ascending channel.
The next major resistance lies within the red zone:
$0.05949 – $0.06914
This resistance acts as a crucial ceiling for the price.
🚀 Potential Targets After Breaking the Red Resistance:
✅ TP1: Channel Top
✅ TP2: Breakout Above the Channel → Higher Price Levels
🔴 Bearish Scenario:
If the blue support zone fails to hold:
The price could drop to the bottom of the ascending channel + weekly support
🏁 (Gray Box)
Losing this level may trigger a new bearish trend.
📈 Trend Confirmation Factors:
✔ Increasing volume on breakouts → Confirms bullish momentum
✔ Declining volume on pullbacks → Indicates weak selling pressure
✔ RSI near 50: A move towards 70 (Overbought Zone) signals bullish strength
📌 Summary & Suggested Strategy:
🔹 Holding the blue support → Targeting the red resistance
🔹 Breaking the red resistance → Potential move towards TP1
🔹 Breakout above the channel → Strong bullish rally
🔹 Heavy rejection → Key support at the bottom of the channel (Gray Box)
⚠️Risk Management:
Monitor trading volume & RSI behavior to confirm breakouts or reversals.

#GALA/USDT Ready to go up#GALA
The price is moving in a descending channel on the 1-hour frame and is adhering to it well and is heading to break it strongly upwards
We have a bounce from the lower limit of the descending channel, this support is at a price of 0.02690
We have a downtrend on the RSI indicator that is about to be broken, which supports the rise
We have a trend to stabilize above the moving average 100
Entry price 0.02900
First target 0.03073
Second target 0.03252
Third target 0.03440

GALA Bulls Must Watch This Level—A Major Move Is Coming!Yello, Paradisers! Have you been watching #GALA’s explosive move? The recent breakout from the ascending triangle pattern is sending a clear message—momentum is heating up fast, and the next pivotal level is right around the corner. But will GALA stop at just being bullish, or are we about to see it shift into hyper-bullish territory? Let’s dive in!
💎#GALAUSDT is now heading straight for a critical descending resistance zone around $0.04600. This is the level to watch! A breakout above $0.04600 would trigger a breakout after breakout setup—something that often signals major bullish strength ahead. If the bulls can smash through this level, it’s a game-changer.
💎GALA will likely be targeting $0.054 to $0.056 after clearing the resistance. But if the momentum stays intact, expect GALA to make a run higher for $0.06660, where we see the next big cluster of profit-taking. The $0.06660 to $0.07000 zone is where traders should be cautious, as this level historically brings out sellers.
💎Not only has GALA broken above its pattern, but it’s also reclaimed a major structural level between $0.0395 and $0.0410—a key zone that has acted as both support and resistance in the past. With price now holding above this level, bulls have established a solid base to build on. Below this, we see a layer of ascending and horizontal support, giving GALA strong protection on the downside.
Paradisers, this setup is looking very promising—but don’t forget, discipline and patience are key in this market.
MyCryptoParadise
iFeel the success🌴

Market Remains Ambiguous: Gala Looks Good To Go. But is it?Before diving into Gala's current movement, it’s crucial to establish this foundational point: Wave 3 is only confirmed when the price breaks the high of Wave 1, which is $0.06667. Until that milestone is reached, any analysis remains speculative.
Previous Analysis Recap
In an earlier idea, we tracked a WXY correction with the Y wave targeting $0.02761 (0.786 Fibonacci level). However, after the Y wave played out for a few days, it became clear that we were correcting within a descending triangle. This pattern suggested the possibility of price movement in either direction.
While I anticipated a downward movement for Bitcoin and Gala, I was also prepared for an upward bounce.
Why I Anticipated a Downward Move?
Bitcoin's Unfinished Correction: In my Bitcoin analysis, I noted that Bitcoin likely hasn’t completed its full correction. During the last bull run, Bitcoin Dominance collapsed during Wave 4 corrections, paving the way for altcoin season. That hasn’t occurred yet, as Bitcoin Dominance remains high. A further price drop would align with the completion of this correction.
Shorter Corrections Are Unlikely: Historically, Bitcoin’s Wave 4 corrections have been deeper and longer, lasting around three months in the previous cycle. At present, Bitcoin’s correction is only 3.5 weeks in, suggesting more time may be required.
Current Developments
Instead of a deeper correction, Gala’s price bounced upward, potentially extending the overall corrective phase. While this could lead to further upward movement, it doesn’t entirely rule out the possibility of additional downside later.
Momentum Indicators Turn Positive:
Gala has already undergone a significant correction, nearly reaching the 0.786 Fibonacci level. Daily RSI indicators suggest there is enough momentum for the price to climb higher - A potential X wave could target $0.04407.
Future Scenarios:
I am open to this being Wave 3, but I am also open to this correction extending to a WXYXZ correction (they can go on forever technically). I can't predict where the X wave will end, and how deep the Z correction will be until X is complete.
However, for Wave 3 confirmation, Gala must surpass $0.06667. It’s worth noting that the X wave could climb as high as $0.06600 and still remain part of a corrective structure.
Perspective and Patience
This analysis serves as a reminder to maintain perspective. While the allure of immediate resolution is tempting, markets often operate on longer timeframes. Bitcoin’s current correction phase is relatively young compared to historical patterns, and this may apply to Gala as well.
Final Thoughts
At this stage, the market remains ambiguous, and interpretations may evolve as new data emerges. The charts provide valuable insights, but certainty is only achieved in hindsight. For now, tracking key levels will be critical to understanding Gala’s next significant move.
Stay flexible and prepared for either scenario as the market unfolds.

Is GALAUSDT Setting Up for a Bullish Breakout?Yello, Paradisers! Are we on the brink of a major bullish move for GALAUSDT, or is more downside on the horizon? Let’s dive into the latest analysis to help you prepare for what’s coming.
💎GALAUSDT has been consolidating in a descending channel, signaling a healthy retracement. This structure increases the probability of a bullish reversal—if key conditions are met.
💎If the price triggers an inducement and begins forming bullish patterns—such as a bullish I-CHoCH, W pattern, or inverse head-and-shoulders—at the key support zone, the likelihood of a strong upward move will significantly increase.
💎In the case of deeper retracement, we’ll look for a bounce off the strong support zone. However, confirmation is key. Keep an eye on patterns like the bullish I-CHoCH, W formation, or inverse head-and-shoulders to validate the bullish case.
💎If GALAUSDT breaks down and closes a candle below the strong support zone, the bullish outlook will be invalidated. In this scenario, patience will be critical—it’s better to wait for more favorable price action to form before making a move.
💎Discipline and risk management are essential in navigating markets like this. Remember, Paradisers, trading isn’t about predicting—it’s about reacting smartly to what the market shows us.
🎖Play it smart, stay patient, and wait for the best opportunities. Success in crypto is a long game, not a quick sprint! Stay disciplined, and you’ll already be ahead of the majority.
MyCryptoParadise
iFeel the success🌴
