GALA/USDT exciting opportunity bullish horizon?👀🚀GALA Analysis💎 Paradisers, gear up for a promising trading opportunity with #GALAUSDT. There's a strong potential for a bullish reversal from the key support at $0.03557. If it maintains its momentum at this level, there's a significant chance it could initiate a bullish push, aiming to breach resistance and target our designated strong resistance area.
💎 Should INDEX:GALA fail to rebound from the $0.03557 support and instead break below it, this could indicate a continued downward trend, with the next critical demand zone at $0.03317. Notably, this level has already seen significant upward movements twice due to its robust liquidity.
💎 If #GALA reaches this demand zone again, it is crucial for the price to secure a rebound from this level to maintain support. A failure to rebound could escalate bearish momentum, exacerbate negative market sentiment, and possibly lead to further declines in price.
MyCryptoParadise
iFeel the success🌴
Galausdtlong

#GALA/USDT #GALA
We have a bearish channel pattern on a 1-hour frame, the price moves within it and adheres to its limits well, and it is about to break upwards.
We have a green support area at 0.0450
We have a tendency to stabilize above moving average 100
We have a downtrend on the RSI indicator that supports the price higher
Entry price is 0.4600
The first target is 0.04800
The second goal is 0.05070
The third goal is 0.05320

GALA coin analysisGala coin has breakout previous valid high and turned into bullish trend after CHoCH. But it is forming trendline liquidity as shown on the chart. Thats why I will long below that liquidity zone which is aslo a sell side liquidity. I am expecting price to come below that poi after toiucing its supply zone. This is my analysis on 1H time frame. What are your thoughts?

GALA: buy by risk
📊Analysis by AhmadArz:
🔍Entry: 0.04723
🛑Stop Loss: 0.04132
🎯Take Profit: 0.05159 -0.05665 -0.06041 -0.07028 -0.07653
🔗"Uncover new opportunities in the world of cryptocurrencies with AhmadArz.
💡Join us on TradingView and expand your investment knowledge with our five years of experience in financial markets."
🚀Please boost and💬 comment to share your thoughts with us!

#GALA/USDT LONG#GALA
The price has been moving in a bear flag since April 2022
It was a lot of events on this pair
It has achieved nearly 2x in the last two months
The downtrend is expected to break through to turn the trend to the upside with the breaking of the Moving Africa 100 upwards.
Current Price0.03195
First Goal 0.04940
Second Goal 0.06419

GALUSDT Traingle Breakout!GALAUSDT Technical analysis update
The GALA price has broken above the resistance level of its triangle pattern. This suggests a potential bullish continuation
Buy zone : Below $0.066
Stop loss : $0.0595
Regards
Hexa

#GALA/USDT#GALA
The price is moving in a downward channel on a 4-hour frame, about to break upward
The area in green is a very strong support area and the price rebounded from it at a price of 0.05
We have a downtrend on the RSI indicator about to occur. The fraction is up
We have a higher stability moving average of 100
Entry price is 0.055
The first target is 0.060
The second goal is 0.066
Third goal 0.073

$GALA 55% SHORT-TERM GAIN | TREND TO WATCHI am currently watching this short-term GALA downward trendline waiting for some sign of a break out before entering a long position. This will most likely be confirmed or cxled in a couple days to weeks depending on Bitcoin's price movement. Lowest entry could lead to a quick 55% spot gain. Set your alerts. This would be a continuation of the long-term trend breakout which I posted about previously.

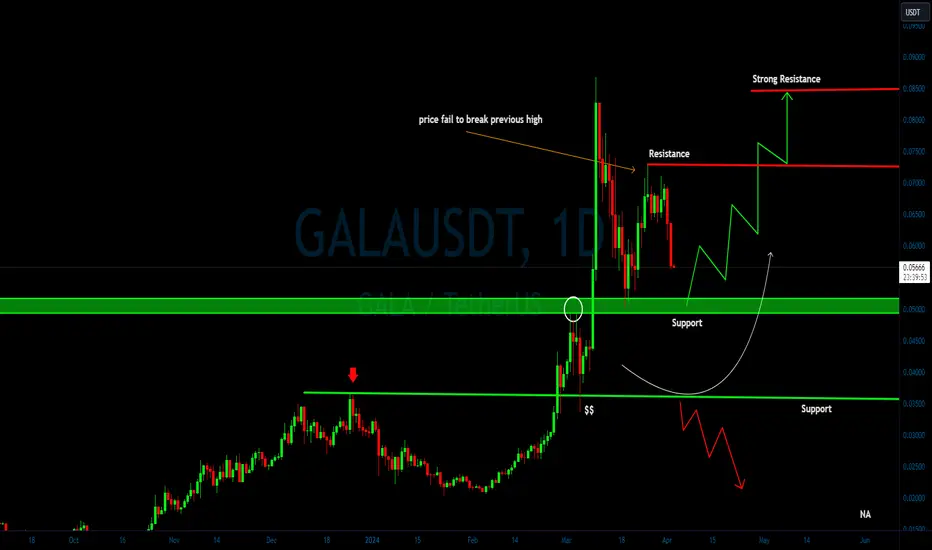
GALA/USDT bullish horizon from support? 👀🚀GALA Today analysis
💎 Paradisers, let’s delve into the intriguing movement of #GALAUSDT. Currently, it is retracing and meticulously approaching a critical support level at $0.04965. This level holds immense significance, and its ability to transition from a mere retest to a robust support could be the harbinger of a potential bullish surge.
💎 Since the price of #GALA has failed to break the previous high, short-term bearish sentiments are prevailing. However, as of now, the price approaches the key support level at $0.04965. If it maintains its momentum at this crucial juncture, we may witness a delightful bullish reversal. Picture it: the price ascending, breaking free like a phoenix from the ashes.
💎 But ah, the markets are fickle, my friends. Should the price of INDEX:GALA dip below this pivotal zone, our strategy must adapt. Brace yourselves! We anticipate a bullish rebound from the secondary support level at $0.03627. Failure to reclaim ground here could spell further declines. So, stay vigilant, stay nimble, and let’s navigate these market fluctuations with grace and precision.
GALA: buy in wedge📊Analysis by AhmadArz:
🔍Entry: 0.06513
🛑Stop Loss: 0.06354
🎯Take Profit: 0.06674 - 0.06832 - 0.07012
🔗"Uncover new opportunities in the world of cryptocurrencies with AhmadArz.
💡Join us on TradingView and expand your investment knowledge with our five years of experience in financial markets."
🚀Please boost and💬 comment to share your thoughts with us!

#GALA/USDT#GALA
The price is moving in a bearish channel on a 4-hour frame and we have a support area in green at the 0.0500 level.
We have the highest stability with Movina discharge 100
Now we have a breakout that is about to occur well after bouncing from the green zone
Our RSI indicator has a trend that is about to break to the upside
Entry price is 0.05542
The first goal is 006252
The second target is 0.06802
Third goal 007298

GALA with higher lowGALA broke out of falling broadening wedge and making a higher low
touched the golden pocket and bounce upward
targets and stop loss on chart
Not Financial Advice

Gala/Usdt Looks Promising For Breakout Gala/USDT is currently showing signs of attempting a breakout on the 4-hour timeframe. If it successfully breaks above the trendline resistance, there is a potential for a 30-60% bullish move in the short term. Please note that this statement is not financial advice, and individuals should conduct their own research and analysis before making any investment decisions.

Keep an eye on this level!It's time to keep a close watch on GALA, which is gearing up for a big move! If you're looking to trade GALA at the moment, here's a quick setup that you might find helpful!
The idea is: Buy when the price breaks above 0.05955$ and take profits at the levels shown in the chart.
Targets:
1. 0.062$
2. 0.0655$
3. 0.068$
-------------------------------------------
About our trades:
Our success rate is notably high, with 10 out of 11 posted trade setups achieving at least their first target upon a breakout price breach (The most on TW!). Our TradingView page serves as a testament to this claim, and we invite you to verify it!

GalaUsdt Idea Gala/Usdt
It is anticipated that Galausdt will experience an upside breakout in the near future; however, it is premature to make a definite prediction. The prudent approach would be to observe and wait for a confirmed breakout before drawing any conclusions. If the breakout happens successfully, there is a possibility of a 30-50% increase in bullish sentiment. Please note that this information is not financial advice.

#galal/ usat#gala
The price is moving in a downward channel on frame 1. hour.
We are about to break that channel upward.
We have higher moving average. 100.
We have a trend on the RSI indicator that is about to break
,the entry price 0.07132.
The first target is 0.07152.
I The second target is 0.08152.
Third target is 0.08827.

GALA - Big Upside Potential#GALAUSDT broke out of falling wedge on 3D.
I´m expecting a pullback and a continuation of the upward movement.
Big upside potential in mid term.

#GALAUSDT LONG#GALA
The price has been moving in a downward channel since June 2023
This descending channel was broken upward
It is expected that the price will continue to rise with the support of Moving Average 100
The current price is 0.02625
The first target is 0.02830
The second target is 0.4770
The third goal is 0.06279

#GALA/USDT#GALA
The price is moving in a descending channel on a 4-hour frame
Supported by the breakout of the Moving Average 100 and bullish momentum
It is expected that this descending channel will be broken upward
Current price 0.02771
First target 0.02910
Second goal 0.03151
Third target 0.03350
The fourth target is 0.03549

GALA: sel in orderblock📊Analysis by AhmadArz:
🔍Entry: 0.0459
🛑Stop Loss: 0.0479
🎯Take Profit: 0.0437-0.0419-0.0402-0.0384
🔗"Uncover new opportunities in the world of cryptocurrencies with AhmadArz.
💡Join us on TradingView and expand your investment knowledge with our five years of experience in financial markets."
🚀Please boost and💬 comment to share your thoughts with us!

Down 9% Since Binance Listing (2 Years), Gala Bulls Steady🐃We may observe a Bullish Engulfing pattern on the Monthly timeframe suggesting the creation of a larger range. This range -->>
Monthly resistance 0.0415
Monhtly Support 0.0160

GALA/USDT Bracing for a Bullish Reversal from Key Support?💎 Paradisers, prepare for an exciting turn in #GALAUSDT, as it's on the brink of a bullish leap from a pivotal support area.
💎 Diving into #GALA's recent actions, we're seeing signs of a potential bullish shift right after facing a hurdle at $0.03669. Now, with #GALA hovering around the strong support level of $0.02081, holding firm here could trigger an energetic bullish wave.
💎 Eager to seize every opportunity? If #GALA dips below $0.02081, we're looking to bounce back from an even lower support at $0.01690. Dropping further could lead us to rethink our bullish expectations.

🚨#GALA/USDT Long#GALA
The price is moving in a descending channel on the 12-hour frame
Now it is about to break that channel upward after testing the downtrend of the channel
We have buying momentum on the MACD indicator
Entry price is 0.02287
The first target is 0.02424
The second goal is 0.02689
The third goal is 0.02965
