Gamestop

GME 1W: when the memes fade, the structure speaksGameStop is once again testing the lower boundary of its long-term consolidation, bouncing off the 21.53 zone - a level that aligns with the 0.79 Fib retracement and historical support. This zone also intersects with a key trendline on the weekly chart, and just recently, a golden cross (MA50 crossing MA200 weekly) printed - a rare but technically significant signal. The stock continues to trade inside a broad descending channel, and if this support holds, the natural next step is a move back toward the mid-range at 37.42 (0.5 Fib), followed by a possible push toward 64.92. The tactical setup favors a confirmation entry near current levels, with a stop under 21.00. Risk/reward here is among the cleanest GME has offered in months.
On the fundamental side, GameStop remains in a transitional phase. The company is shutting down unprofitable segments, reducing costs, and doubling down on e-commerce and digital distribution. Financial results are still slow to recover, but the latest Q2 2025 report showed positive operating cash flow and narrowing losses. This isn't a value play in the traditional sense - it's more about the potential for renewed retail-driven momentum if technical conditions align.
If there’s still power behind the crowd - this might be one of the most technically compelling entry zones of 2025.

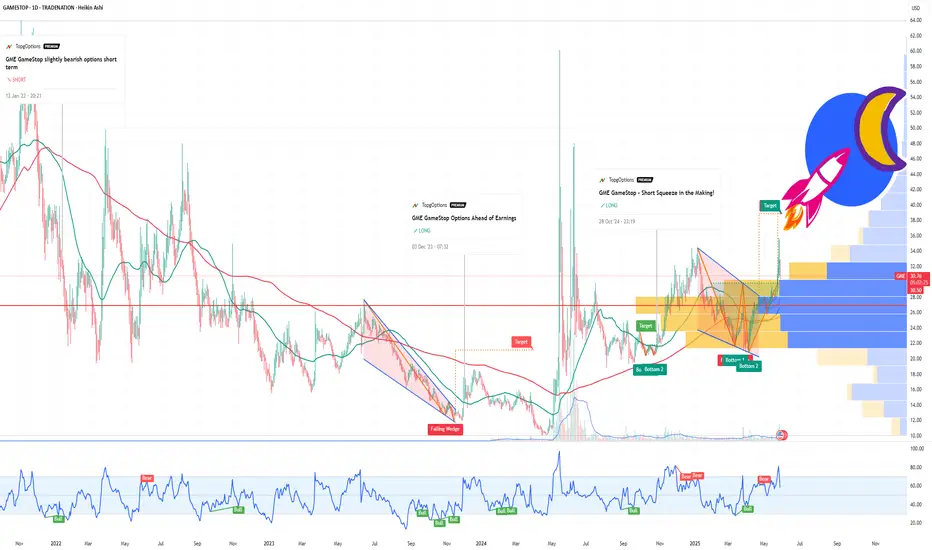
Golden Cross on GME WeeklyGME Chart Breakdown, Déjà Vu or Destiny? Something big just lit up the weekly chart, the 50 MA has pierced through the 200 MA, forming that golden cross traders dream about. On the weekly timeframe. Not a drill.
Now, let’s rewind. The last time this pattern appeared? January 2021. The infamous squeeze. Back then, GME didn’t just nudge upward, it catapulted nearly 4000%, going from a $3 floor to $120 in a blink.
Fast forward to today, new golden cross, new setup, and a $23 floor. If history rhymes even remotely, we’re staring down a hypothetical $1000 per share move. Yes, one thousand.
Is lightning about to strike twice? Stay tuned to find out!

LQTY / USDTBINANCE:LQTYUSDT
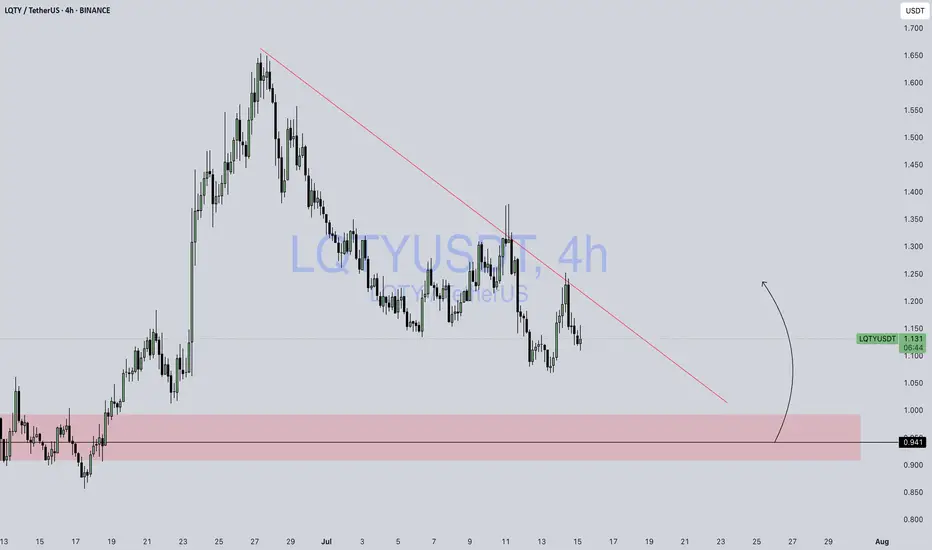
📊 **Chart Overview – LQTY/USDT (4H, Binance):**
* 📍 **Current Price:** \$1.134
* 🔻 **Downtrend Line:** Strong descending trendline still acting as resistance.
* 🟥 **Demand Zone (Support):** \$0.91 – \$0.96
* 🟢 **Scenario Projection:** Price might **retest the demand zone** before attempting a bullish reversal (marked by the black curved arrow).
---
### 🔍 Key Observations:
1. **Trend Structure:**
* Price has been respecting a **descending trendline** since the \$1.65+ top.
* Recent rejection from the trendline suggests **sellers are still active**.
2. **Price Reaction Zone:**
* The highlighted **support zone (\$0.91 – \$0.96)** has a history of strong buying and breakout behavior.
* If price drops into this region again, it may trigger a **bullish reversal or bounce**.
3. **Bullish Opportunity:**
* If price **taps into the demand zone with a long wick / strong candle close**, it could be a **high-probability entry** for long setups.
* Potential upside: **\$1.20 – \$1.30** range.
4. **Invalidation:**
* A **clean break below \$0.91** would invalidate the bullish scenario and signal further downside.
---
📈 **Trade Idea (Hypothetical):**
* **Entry Zone:** \$0.94 – \$0.96
* **Stop Loss:** Below \$0.89
* **Target 1:** \$1.15
* **Target 2:** \$1.25
---
⚠️ **Reminder:** This is **not financial advice** – always use your own risk tolerance and confirmation tools (volume, candle close, etc.)
GME GameStop - A Crypto Proxy with Surprise UpsideIf you haven`t bought GME before the previous rally:
Why GME Could Rally by Year-End 2025:
1. Hidden Bitcoin Exposure
GameStop recently revealed it holds a significant amount of Bitcoin on its balance sheet — quietly positioning itself as a crypto proxy in the equity markets.
While not a traditional miner or crypto company, GME gives exposure to BTC upside without being a pure-play crypto stock.
With Bitcoin aiming for new highs in 2025, any company with BTC on its books becomes more valuable — just as we saw with Tesla and MicroStrategy in prior cycles.
2. Retail Speculation and Meme Momentum
GME has always been a retail-fueled stock, and retail interest is surging again in crypto and meme trades.
As crypto enters a new speculative phase, GME could benefit from a reflexive feedback loop: BTC goes up → GME gains attention → more retail FOMO → GME rises.
Recent reappearance of figures like Roaring Kitty has reignited interest — and if crypto sentiment stays hot, GME could ride that wave.
3. Lean Balance Sheet and Optionality
After multiple share offerings, GameStop is flush with cash and minimal debt — giving it financial flexibility.
Holding BTC enhances its treasury strategy during inflationary or weak-dollar cycles.
This also gives it optionality to enter Web3, NFTs (again), or even blockchain gaming — areas where its brand could carry weight.
Technical Setup
GME is consolidating above key support in the $20–23 zone, forming a potential bull flag or base for another breakout.
Any breakout in Bitcoin or renewed meme-stock energy could push GME to test $35–40, or even $50+ if momentum returns.
Final Thoughts
GME may not be a traditional crypto stock, but it’s now quietly tied to Bitcoin performance. With crypto heating up and retail risk appetite returning, GameStop becomes a speculative bet on BTC, memes, and volatility — all in one ticker.
Disclosure: I am part of Trade Nation's Influencer program and receive a monthly fee for using their TradingView charts in my analysis.

GME COLLAPSE - NET SELLOFF - MARKET ANALYSISGameStop (GME) is dropping in after-hours trading following its $1.3 billion convertible senior notes offering, which investors see as potential dilution. Similarly, Cloudflare (NET) is also falling due to concerns over its $1.75 billion convertible debt offering, which could impact shareholder value.
On the flip side, Oracle (ORCL) surged after reporting strong Q4 earnings, with cloud infrastructure revenue expected to grow over 70% in fiscal 2026. This could provide a tailwind for the broader cloud sector.
The market’s pullback today was much needed, with many stocks retesting key breakout zones

WC: 29.58 Target: 1800-2400 MOASS: 47k-100K: Week Of 06/09Ok this is my last video on Gamestop
You will see less frequent posts going forward and they will be at the MACRO level and focused almost exclusively on the daily charts
Its been a ride covering this over the past year or so
True to my posting intention (I'm only here to help people trade better) this video is educational in nature
Its not hopium fueled at all...this is me, one last time...TEACHING YOU HOW TO FISH
First half of the video is setting your charts up for the squeeze
Second half of the video is showing you some new stuff around the 20 Week Cycle that you havent seen before
But yeah..no hype...just TA and some rambling..because as my Tagline on my X profile says i'm:
"Just a guy who likes to draw Elliott Waves on stock charts and ramble on about markets."
GOOD TRADING TO YOU ALL...SEE YOU ON THE OTHER SIDE!

GameStop (GME) Is the New MSTR — And It Might Moon Harder ! If you haven`t bought the dip on GME:
Now You need to know that GameStop (GME) is the new MSTR MicroStrategy — But With Meme Power!
GME GameStop just made its boldest move yet: the company revealed it has purchased 4,710 Bitcoin, officially entering the crypto game in a serious way. While it hasn’t disclosed the total price paid, the intent is loud and clear — GameStop is transforming into a Bitcoin-holding company, just like MicroStrategy (MSTR) did back in 2020.
This isn’t just about hype. In March, GameStop raised $1.3 billion through a convertible note offering, specifically to help fund Bitcoin purchases. It also updated its investment policy to formally add Bitcoin as a reserve asset — the same exact strategy that led to MicroStrategy’s 10x stock explosion.
But here’s the twist: GameStop brings more than just Bitcoin exposure — it brings meme momentum. Unlike MicroStrategy, which had to win over the market, GME already has an army of loyal retail traders, massive online visibility, and a cultural legacy as the original meme stock. If MicroStrategy was the corporate face of Bitcoin adoption, GameStop is the internet’s version — louder, faster, and potentially more explosive.
Yes, the stock dipped on the announcement — typical for big moves like this — but long-term, the upside is undeniable. Bitcoin on the balance sheet gives GME new life, and volatility is GameStop’s comfort zone. With Bitcoin becoming a political and financial flashpoint — highlighted by major figures like JD Vance and Donald Trump Jr. attending the 2025 Bitcoin conference — GME’s move couldn’t be more timely.
This is more than a pivot. It’s a power play. GameStop is no longer just a nostalgia-fueled retailer — it’s a digital asset powerhouse in the making.
If you missed MicroStrategy’s rise, GameStop might just be your second chance — with even more firepower behind it.
Disclosure: I am part of Trade Nation's Influencer program and receive a monthly fee for using their TradingView charts in my analysis.
GameStop goes crypto: what 4,710 BTC means for the chartGameStop has disclosed a $500 million investment in Bitcoin, marking its first significant move into the crypto space.
The video game retailer is sitting on $4.76 billion in cash and hasn’t disclosed a limit on future purchases.
GameStop shares fell 10% following the announcement, while Bitcoin pulled back toward $107,000. A 14% rally would be needed for BTC to reach the 127.2% Fibonacci extension at $122,000, while $103,800 could be a key support level where we previously saw consolidation.
CEO Ryan Cohen addressed the Bitcoin 2025 Conference in Las Vegas via pre-recorded video Wednesday too, citing macroeconomic concerns as a key driver behind the company’s decision. These likely include rising U.S. debt levels and trump tariffs.

$GME Epic Short Squeeze? NYSE:GME had a classic breakout on the daily chart today.
- Breakout occurred on high volume
- Weekly & Daily RSI has room to run
- Clear stoploss level if this fails
- Upside parallel channel = target
Longing this name as long as it stays above $29.80
Next minor resistance will be the gap fill and then I believe we will liquidity sweep the most recent pivot highs before a pullback.

Gamestop Mascot $BUCK - Is it Destiny?At the time of writing, BUCK, a Solana-based meme token (also named "GME Mascot") is easily dismissed as a joke - with a sub $2m marketcap.
Just yesterday it had $1.3 million total invested into it, having today confirmed a MAJOR breakout as NYSE:GME stock also did the same. Is it one to ignore though? Should we just monitor it or jump straight into this token? Consider some thoughts below:
Technical
Buck is beginning what seems to be an Elliott Wave 3 of larger Wave 3 awaits (green line).
This is the phase of adoption seen of the Crypto industry that gains the most jaw-dropping price action. A phase when major exchanges acquire the token for ANY price - when observing insatiable demand and an explosion of consumer interest. If this comes to pass, this might just be the fastest monetisation of an asset in history.
This would be the same move that catapulted CRYPTO:PEPEUSD and COINBASE:DOGEUSD to stardom. Except this tokens rise could be even more swift than even either of those 2.
Speaking of PEPE, underlaid THIS chart is a dark green bar pattern extracted from the CRYPTO:PEPEUSD chart then scaled to all historical price action. This helps demonstrate that this sort of monetisation is a real possibility and HAS been witnessed before.
If we take the height of the flagpole (yellow) from the initial move of its creation in November 2024 and apply it on top of today's breakout - we get a marketcap of $4.5bn (2,250x). And that could happen in just 2-3 short weeks.
On breakouts of such patterns, price tends to want to extend itself into the "golden pocket" between the 1.414 (turquoise) and 1.618 (blue) fibonacci lines.
Target 1 is $4.5 (meaning buck is to reach several bucks) - which coincides with the 1.414 fibonacci level.
Target 2 is the $25 level - a value that even would exceed today's Gamestop company marketcap.
For such targets to hit, we will of course need to see at least some signs of the much anticipated #MOASS for Gamestop to finally unveil itself in NYSE:GME stock. That or for them to at least announce their recent BTC or ETH purchase.
If you're looking for leverage on top of GameStop's elevating price - options may not be your best bet. RAYDIUM:BUCKSOL_DGOS4P.USD could be an alternative play with even higher upside than even RAYDIUM:GMESOL_9TZ6VY.USD or RAYDIUM:GILSOL_58DNVL.USD - other meme tokens from the community.
Fundamental
You might be thinking that meme tokens have no fundamentals. But remember we're in 2025.
You might also believe that the NYSE:GME company has no reason to want to see this meme token rise and for it to take attention away the fundamental investment thesis of Gamestop. However let's think about that for a second.
By achieving a marketcap of $4.5bn it would be ranked #29 of all crypto tokens. At $25bn it would become a Top 10 token in just 2 months (see blue line).
Gamestop the business would benefit from a large appreciation of their IP. Buck would become a household name.
Seeing the appreciation of this tool is FREE marketing for Gamestop.
Buck today is a trademarked character and will allow them to sell a bucket-load of merchandise and hardware/accessories.
In prior decades was seen in several video games like "Buck and the Coin of Destiny". You can imagine future titles too like "Buck to the future". It's a catchy name.
The creators of this token seem to have been working on a video game of some sort behind the scenes.
Note however that this token is not linked officially with Gamestop in ANY capacity. It's apparently been a community takeover after its sharp drop from $0.12 (Nov-2024) to 0.7c (March 2025).
Last but not least.. if you have considered what seemed to propel COINBASE:DOGEUSD , CRYPTO:PEPEUSD , COINBASE:SHIBUSD into the public eye - consider that BUCK too has a short snappy name. It also features a heavily marketable animal character.
Buck too has a chip on his shoulder and is very popular in the community - for kids, teens & adults alike.
As outrageous as it is, to be talking about meme fundamentals, consider that Elon often says "the most entertaining outcome is the most likely outcome".
Not to mention...
As Neo once witnessed on his computer screen in the Matrix...
Follow the white rabbit 🐰
-------------
In a months time.. you too might just not regret it...

GME - Uncertainly certainThe future is simply bright, from a top down view, GME is executing on the turnaround, by betting on Bitcoin. Simple as that, the future trajectory of this stock will be heavily tied to the Digital Gold, which is a good thing.
This turnaround also exposes Gamestop to future volatility events happening in the Cryptocurrency world. Up or down, once the pile of coins gets big enough, GME will benefit... Or go through intense selling periods (à la MSTR).
My proposed targets are :
- $65 August 2025
- $137, January 2026
- (-60% heavy correction through most of 2026)
- $174+, January 2027 this date being my personal MOASS date : January 27th 2027.
Confident in the leadership, confident in the market short and medium term. Those two factors could launch us into the second leg of this bull market, we may see GameStop perform exceptionally well, even on words and promises. Thankfully video games will sell themselves (GTA 6), consoles will too (Switch 2), but GME is finally about to become a lot more than that.
Don't sleep on it because it's a meme stock, these perform the best when the market goes banana on stimulus and deflation. If everything hits at the right time, then this 21% drop on SPX we've gone through in March and April of 2025 was the best dip buy ever.
GME forever bottomed in 2020, and since they started executing on the turnaround, the ceiling has been truly raised, although it was always high from the get-go :D
I must say, about that $174+ I honestly think, it's much much higher than that, I'm expecting this target to be busted through quite easily, ultimate target : $501. If, and if we get there, early 2027, I'm looking at a quite fantastic event, some kind of big news will shake up the markets, but GME, with a little bit of help from BTC could go through inversing main indices.

GameStopA stonk? Yes, a stonk.
Not just any stock. I really like the stock.
Technically, this looks ready for a run.
Fundamentally, it's the most bullish thing known to mankind.
Ryan Cohen just acquired 500K shares.
GME is investing in BITSTAMP:BTCUSD
What's up apes? 💎

GameStop’s Bitcoin Bet Fails to Wow Traders. Can It Copy MSTR?GameStop NYSE:GME wants to jam Bitcoin BITSTAMP:BTCUSD into its treasury. But isn’t that a risky move that threatens to derail the video-game retailer’s finances? With $1.3 billion on the line, GameStop’s pivot to Bitcoin in efforts to revive its flagging share price may make things even worse. Let’s talk about that.
Desperate times call for desperate measures. After a couple months of speculation, traders’ suspicions turned out correct — GameStop is indeed adding Bitcoin on its balance sheet .
The company confirmed the plan in its quarterly earnings update released last week. That was all good — shares jumped 8% on the news and closed the cash session higher by 12%.
But these solid gains were not only wiped out — traders doubled down on the selling pressure when the shares crashed 23% a day later because GameStop unveiled a scary figure.
To make Bitcoin a treasury reserve asset, GameStop said it is seeking to sell $1.3 billion of convertible bonds , which will be used “for general corporate purposes, including the acquisition of Bitcoin in a manner consistent with GameStop’s Investment Policy.”
What do these convertible bonds do? They’re essentially papers that certify you’ve given the company a loan. Usually, they come bearing some nice guaranteed yield, but in this case, the yield is exactly 0.00%.
Another string attached to GameStop's bonds is that they are due in 2030 and you can choose to convert them into shares, each with a price tag of $28.46, or you can take them out in cash. That’s one reason why the stock tanked last week — not too favorable conditions.
Another one, and perhaps a bigger worry for investors, is that GameStop’s net income will no longer be as secure as it’s been until now. More precisely, GameStop generates around $220 million in interest each year thanks to its holding of Treasury bills.
With Bitcoin getting in the mix of factors contributing to the bottom-line figure, things may spin out of ordinary. True, Bitcoin may go up in price and lift GameStop’s net income but it could also decide to nosedive for no reason and eat into GameStop’s profits.
Judging by the votes of the traders last week (if the stock market is a voting machine in the short term), they seem to believe in the latter. At least for now. But that's not a concern to the OG meme stock . Where it hopes Bitcoin will make a difference is the long run. Just look at MicroStrategy MSTR .
Strategy, formerly known as MicroStrategy , is the world’s largest corporate Bitcoin holder. Even more, it’s a Bitcoin hoarder, sitting on more than 506,000 Bitcoin, according to BTC-tracking platform Bitcoin Treasuries .
Strategy has been issuing debt to buy Bitcoin since 2020 and that’s the exact same thing that GameStop is doing. But there’s a key difference. Strategy has largely strapped its share price to the performance of Bitcoin. So much so that the market has been feverishly buying the stock as a way to get exposure to Bitcoin (on steroids). For GameStop, it’s too late for that.
Shares of Strategy are trading at less than 2x the value of its Bitcoin holdings.
GameStop, in contrast, has appealed to investors for its stack of cash (besides the speculative bonanza) with $4.8 billion in dry powder ready to be deployed. The stock is trading at more than 2x its cash holdings and the cash-to-Bitcoin conversion is likely to dent that performance and trigger some outflows. And that’s how the company puts its premium at risk.
So is it safe to say that GameStop is looking to spark a share-price rally by following MicroStrategy’s lead? Maybe. But the exposure to Bitcoin also comes at a perilous time for the cryptocurrency industry. Bitcoin is down 10% on the year and more than 25% from its all-time high of $109,000 to hover around $84,000 a pop.
Can the Bitcoin philosophy reel GameStop out of the slump? Or will it drag the bottom line and chip away at whatever’s left of the bruised valuation under $10 billion? You be the judge — share your thoughts in the comment section!

GameStop Stock Holds 11% Gain Following Earnings ReportThe stock price has surged rapidly, nearly reaching the $30 mark, after a strong bullish shift emerged following the company’s latest earnings report. At first glance, the results were mixed: sales came in at $1.28 billion for Q4 2024, down from $1.8 billion in the same quarter of 2023. However, net income held strong at $131 million, compared to $63 million a year earlier. This disparity in results created volatility in the stock price. Adding to the bullish momentum was the announcement that GameStop plans to sell assets to create a strategic reserve in Bitcoin, which helped fuel the rally in recent hours.
Breakout from Bearish Channel:
The stock had been trading within a downward channel since early January, but recently broke out with a strong bullish move. The speed and strength of this breakout may lead to short-term selling corrections as the price stabilizes.
RSI Indicator:
The RSI line is now approaching the overbought zone around the 70 level. As price action continues at these levels, the market may be showing signs of imbalance due to excessive buying pressure, which could open the door to bearish corrections in the upcoming sessions.
Key Levels to Watch:
$31: A nearby resistance level, marking the highest price zone reached earlier this year. A sustained break above this level could trigger a strong short-term uptrend.
$25: A support level aligned with the top of the previous bearish channel and the 61.8% Fibonacci retracement. This could act as a tentative area for a short-term pullback.
$19: A distant support level, corresponding to the lows from September 2024. If selling pressure brings the price back to this level, it could reactivate the broader bearish channel seen in recent weeks.
By Julian Pineda, CFA – Market Analyst

GameStop-Themed Memecoin Spikes 167% Amidst Latest Bitcoin PlayA memecoin named after GameStop Corp. NYSE:GME skyrocketed about 167% Tuesday breaking out of a falling wedge pattern after the video game retailer adopted Bitcoin as a treasury reserve asset.
Build on the Ethereum blockchain, GameStop Coin (GME) soared 167% in the last 24 hours, dwarfing returns by blue-chip cryptocurrencies like Bitcoin and Dogecoin
The latest uptick widened the coin's monthly returns to an astounding +3778.06%. However, a cursory glance at its trajectory revealed periods of short-term rise followed by sharp collapse, indicating its speculative nature.
Note that the cryptocurrency isn't tied to GameStop in any way but seeks to capitalize on the hype surrounding the meme stock.
Technical Outlook
As of the time of writing, NYSE:GME coin is up 9.92% currently retraced as hinted by the Relative Strength Index (RSI) at 60. With the growing hype surrounding meme coins Gamestop coin is looking poised for a comeback as indicated by the daily chart - the wedge is still in play with a speculated surge to the January high, 2025.
GameStop (gamestop-coin.vip) Price Live Data
The live GameStop (gamestop-coin.vip) price today is $0.000101 USD with a 24-hour trading volume of $1,595,457 USD. GameStop (gamestop-coin.vip) is up 4.09% in the last 24 hours, with a live market cap of $41,512,628 USD. It has a circulating supply of 411,297,484,026 GME coins and a max. supply of 420,690,000,000 GME coins.

Gamestop ($GME) Surge 16% in Premarket Amidst Earnings Beat The shares of GameStop (NYSE: GME) surge nearly 17% as the firm reported fiscal fourth-quarter results, which saw revenue fall 28% year-over-year to $1.28 billion.2 However, adjusted net income rose to $136.4 million, or 30 cents per share, from $67.7 million, or 22 cents per share, a year earlier. The earnings growth came as the company moved to cut costs.
GameStop (NYSE: NYSE:GME ) updated its corporate investment policy to include Bitcoin, sending shares higher in extended trading Tuesday.
The video game retailer said its board unanimously approved the decision to add Bitcoin to its investment policy, following reports last month that the retailer was considering investing in cryptocurrencies.
The announcement follows speculation about GameStop's crypto plans after CEO Ryan Cohen last month posted a picture of himself with Michael Saylor, cofounder of Strategy (MSTR), the largest corporate holder of Bitcoin formerly known as MicroStrategy. The price of Bitcoin was just under $88,000 in recent trading.
Shares of GameStop jumped more than 6% in after-hours trading Tuesday following the announcement. The stock was down about 19% for the year so far through the market close.
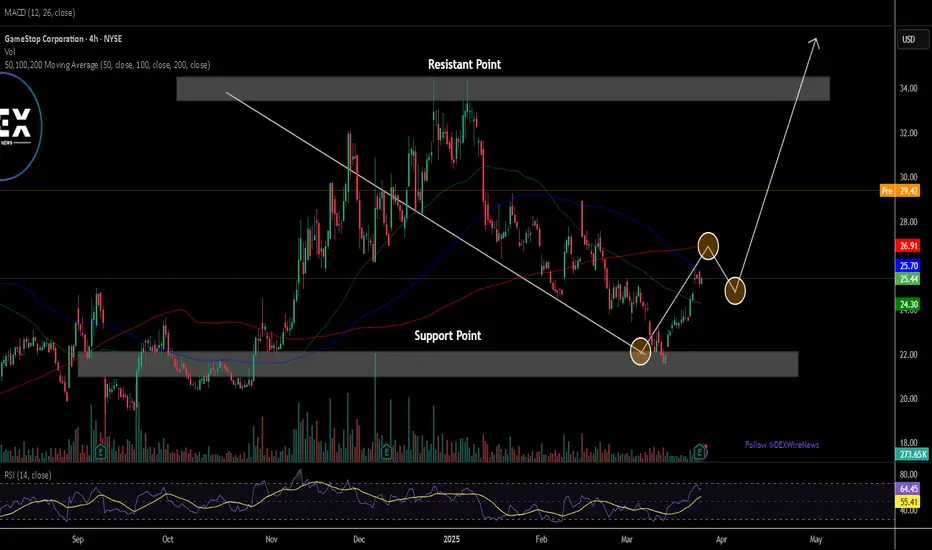
GameStop Corp. (NYSE:GME) to add BTC as a Treasury Reserve AssetThe price of GameStop Corp. (NYSE: NYSE:GME ) shares saw a noteworthy uptick of 7% in Tuesday's after hours trading, primarily based on the news that the firm is set to add Bitcoin as its Treasury Reserve asset.
The asset bounced from it's psychological support zone aiming for a move to the $35- $40 price point. This move would be feasible if GameStop Corp. (NYSE: NYSE:GME ) shares break pass the $30 resistant point.
In light of that manner, GameStop Corp. (NYSE: NYSE:GME ) also is set to announced earnings report Tuesday, March 25, 2025, after market close.
About GameStop Corp. (NYSE: NYSE:GME )
GameStop Corp., a specialty retailer, provides games and entertainment products through its stores and ecommerce platforms in the United States, Canada, Australia, and Europe. The company sells new and pre-owned gaming platforms; accessories, such as controllers, gaming headsets, and virtual reality products; new and pre-owned gaming software; and in-game digital currency, digital downloadable content, and full-game downloads.

$GME - More of the same weird stuffHi all,
More of the same weird stuff where GME has been showing signs of wanting to spike for quite some time now. Generally last week and especially on friday it showed parabolic upwards spiking which usually happens when a move is imminent.
If i was my old degenerate self, i'd be buying out of the money calls expiring this week, and i might just do that.
I don't have a perfectly locked on AI model for GME yet so i don't know for sure yet what's going to happen. My model is okay but not perfect, last i have is a signal from the 11'th saying to buy 22.5 Puts and although that trade did win temporarily by dropping GME to 21.90, GME is now at 23.00 so yeah... needs a bit more time to train.
Will update if i see signs of rejection/even more likely to pump.
No idea when it will pump but due to the parabolic way the data is moving, it usually means the move is extremely imminent e.g day/days less than a week etc.
Lets see. Will update once i have more.

Ethereum THE GREATEST SHORT SQUEEZE in CRYPTO!ETH paired with BTC x GME stock
What happened to GameStop stock? This is very interesting because it helps to understand the “mechanics” behind the formation of such a specific arc (logarithmic chart).
1. Professionals were actively taking short positions.
2. Uncovered shorts forced sellers to buy back shares (to close positions) as the price increased, which further accelerated buying.
3. Volatility and price growth fueled enthusiasm, increasing demand and triggering a pump.
The GameStop situation was long considered a “retail victory,” but as it turned out, it wasn’t entirely so—it was a coordinated move by some major players against others who were heavily shorting the stock, being absolutely convinced of the company’s failure.
How much hate is there around ETH? How many bloggers are writing, “ETH is useless now”? Exactly. Meanwhile, ETH has 6-8 times the TVL of SOL!

$GME - Another oneHi guys,
Seeing a ton of short covering in the last 2-3 weeks for GME in my data.
What i expect to happen:
To keep things simple, i estimate that there will be about 30 days of $22-27 on GME, more likely on the lower end of those prices, then a 11% price increase around early early to mid march, a small drop from profit taking and possibly another 12% price pump mid-end March.
The reasonable thing to do is to wait for you guys to drop it to $22-$23 range before buying in.
imgur.com
The trade:
Not entirely sure from where the +11% pump will start, it could be from 22, 25 or even 27. Due to that i'm buying at $25 call expiring in around 45 days from today and then another one once you drop it to $22 ish. Basically ATM calls expiring before GME earnings as that seems to be the timeframe for what i see in my data.
Will update this if the data changes excessively due to strange and excessive buying/selling caused by this post that may skew this play.
Other:
My AI training on this is still in progress. Will announce my website that uses my strategy on trading GME and a lot of other tickers soon.

Miggles/UsdtMEXC:MIGGLESUSDT
"Miggles is looking good, something’s cooking! Stay tuned,
but this isn’t financial advice!"

Trade high probabilities using game theoryAccording to statistics, 95% of traders are losing longterm. Not because they lack skill, but because they involve in high variance (or poor probability) situations.
What is game theory? we can define GT with three principles.
*People dont want to lose. (hence.. predictable).
*People buy good things at good price, or they are profit maximizing.
*Everyone is strategic.
** we assume that "nobody can predict future".
** markets respond to feedbacks or signals.
Practice: the higher something goes, potential narrows and risk increases. Deeper something falls, "potential" becomes attractive. Once market decides that it will fall -- people assume crash as possibility. People who can buy at a strong trend line - has benefit of having more information.
(1) Downtrending VIX highs and accumulating lows. a strong signal about SPX peak, with everyone expecting a market correction before US election. ---> GT in practice.
(2) pre-election. Markets be wobbly, pointing to 50-50 probability or risk. Maybe there was fear of NVDA/AAPL high valuations, or the fear due to Trump tariff policy (markets are 6m forward looking) as bond yields were rallying.
If we assume statistically, markets boom after elections. We can predict GT in action (or call it market forces). imo that still is a profitable risk.
People hate uncertainty and they love guarantees. So the "wobble" was reasonable.
(3) VIX higher low.. predictably (GT) sell off follows. Almost as by the book.
other way to put it? people maximize potential while minimize loses/risk. There are periods of volatile markets and periods for one directional rallies.
P.S. Blue arrows are longterm macd turning points.
