$GME Gamestop. Another day, another bear flagI previously warned shareholders to run when it broke a bear flag at $129. It now broke another bear flag at $99, and I can just reiterate that warning to shareholders. Run.
Gamestop

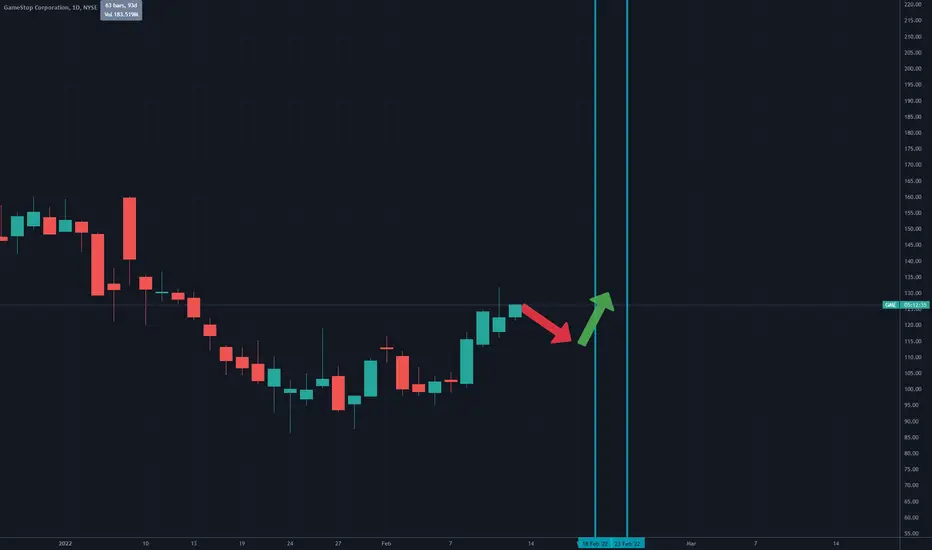
GME to $107 MARCH 4th Noticing a trend on the charts that if it were to play out, we'd see GME to $107 tomorrow which, then has it climbing until the 8th, which oddly enough is the Apply event, which then has it coming back down, go figure. Anyway, I've highlighted the buy zone in red, and included a rough arrow outline of my idea. Be careful of a break in trend (green), you may see 90 or lower.
I sold my 5 shares, so expect GME to squeeze to $100k tomorrow.

GME Accumulation PhaseUpdate for my previous chart with a pattern fix and some more detail on how I plan to trade the accumulation phase and do some nice compound trading in a retirement account. Will likely stop posting new charts and just keep updating my trades here on this chart so be sure to follow.

GME chart (weekly) BUY/SELL Zones & TrendsHere's my GME weekly chart, with trends and zones marked.
I'll likely record a video on this chart.
Watch the trends carefully especially the green, and if we close under, I'd consider dropping out until we see what happens around $90 and $54.

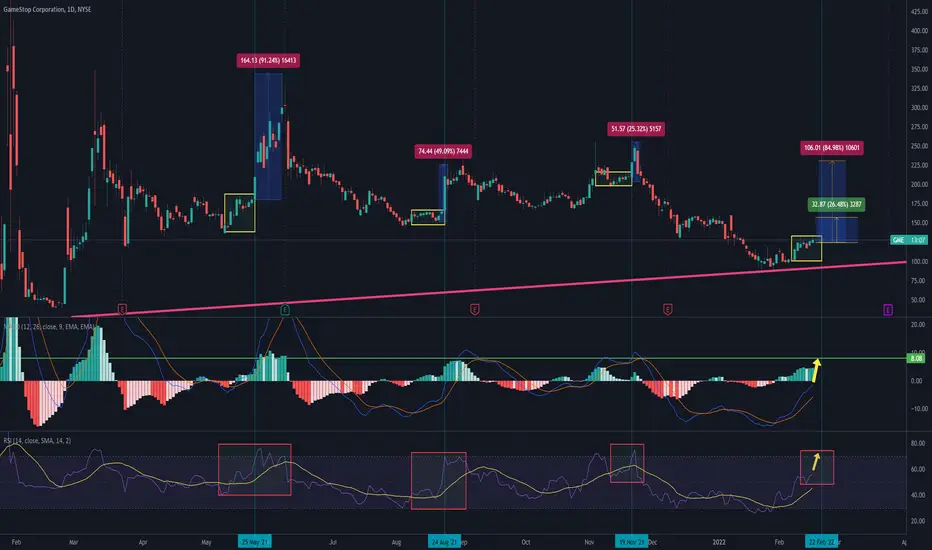
$GME - February Run, Final UpdateThis cycle is looking extra interesting.
Today is the day where the top 30 NSCC members (Banks) may start depositing money to the NSCC for this month's option clearing that start on the 18'th of February this month. Typically market orders stemming from option clearing hit the market STARTING next week TUESDAY. The first batch that hits the market typically is sudden and unexpected and causes 1 large daily candle.
-------
Currently GME's short utilization is at 100% and has been for an entire week. Short utilization at 100% basically means the following :
>There are people out there that believe a stock's price is unfair and should go down.
>Said people BORROW shares for a tiny rate per day or year (1.8% for GME, fluctuates to 2.6%).
>Said people then use these BORROWED shares and either sell them(Oversimplification) at opportune moments to cause the price of the stock to go down.
>Said people also use these borrowed shares to sell calls or perform other complex option strategies that help in dropping a stock's price.
As the price of a stock drops, actual stockholders who own shares in said company decide to sell to cut their losses. This makes the price of the stock go down more. This is the intent of a short seller.
Returning The Shares: Eventually the short seller needs to buy those shares back and return them to the lender. He does so after he's forced to, or has reached his shorting target price. Once he buys the shares back, the price of the stock will increase, but because on the way down, the short seller made other people sell their shares too to cut their losses, the short seller has managed to buy back the same amount of shares a bit cheaper. He pockets the difference, pays the borrow rate to the lender & hopes he's made a profit.
--------
To quickly recap, short utilization is at 100%. This means that from a pool of 700k share lenders, all have lent out all of their GME shares for shorting purposes. Obviously there are likely SOME lenders as well as institutions that are not within this 700k pool of lenders and so while we're at 100% short utilization and for 1 straight week, it doesn't nessesarily mean that there are no more shares to be used to short the stock with.
Having said the above, there have been noticeable moments yesterday & today where for just a few minutes, VIX, SPY, XRT, IWP and GME itself weren't following each other as they normally do or should. This has never happened whilst the short utilization was below 100% and has only started happening within this week. This is either GME's mythical negative beta showing it's teeth and/or it's a sign of depleting lendable share pools.
The only other time GME had 100% utilization was in December 2020 and it was like that for 2 weeks straight before it started dropping. After the drop, GME ran like crazy for 2 months. We are in what looks like the same situation now and the timing is impeccable.
Next week when the cleared option flow hits the markets, in reality, these orders can be mega bullish or mega bearish. All i know about this is that there's a FIFO/First in First Out rule to option clearing and i can only assume that this means that the first options in at the start of this month & quarter are the ones that will get Netted First, and so on and so on. GME has ran every time during these clearing cycles and the next one is on 22/2/22 (Tuesday or Two's day... sorry).
So far out of the 4 quarterly runs / cycles of 2021 for GME, 3 ran up successfully as expected as you can see in the chart above whilst the last one in November was slightly failed. I believe that this is where exactly shorting began and is the cause the official Short Interest/SI of GME has increased from 12% of the total free float to 20% of the total free float.
With 100% of known lenders having lent out their shares & GME inching upwards, the shorts are in danger of having to buy back the shares they shorted at a loss or at the least, earlier than they expected or hoped to due to a not so infinite GME share free float thanks to the recent wave of DRS/Direct Registration of shares by GME holders who are exiting regular brokers & are transferring their shares out of those brokers and directly to a company that lets you register your shares DIRECTLY to your own name, something which all brokers do not do.
Your broker actually owns your shares, they are in your broker's name. That's how your broker is able to also lend out your shares for a profit for themselves. Typically this lending of shares only happens to accounts that trade on Margin as "strict" segregation must exist for all brokers for "Margin" & "Cash" accounts. GME holders have stopped using margin since last year & have begun to register their GME shares in their own name as there are unconfirmed signs that perhaps "Cash" and "Margin" account segregation is being violated.
When you buy shares from a broker, since they are in the broker's name, these shares don't typically count towards the total float of the company you're buying. GME has a free float of ~38 million available shares (Actually a lot less than that) even as the entire world bought GME in 2021 January, the entire free float was never locked.
By Directly Registering your shares to your name using GME's transfer agent (ComputerShare), you both fully own your shares and they cannot be lent out to people that will use them to short the same stock you just bought & you also actually truly lock part of the total available float of GME's shares thus truly reducing the suppply & thus truly driving the demand up for the same shorters who borrowed lendable shares to short the stock with.
With minimal suppply of GME available after everyone directly registering their shares & locking the available share float, the smaller the supply & the higher the demand from the shorters to buy back the shares they borrowed, the higher the price of GME gets driven.
=========
=========
Coming back to the basics here...
After having read all the above, last year in GME's December ~10 earnings report, the amount of Direct Registered Shares was ~5 million shares and this was only 3 months after GME holders started directly registering their shares. It is speculated via bot data that the directly registered shares for this quarter will be around 15 million give or take 5 million (+5 more million from the previous quarter).
Since the available GME shares free float (Excluding insiders, reports from institutions etc) is around 38 mil, then 38 mil - 20mil is 16 mil shares.
The total free float is around 62 mil shares. And 20% of 62 mil is around 12 mil. Let's round it down to 10 mil for no reason just to be nice.
Shorts are utilizing 100% of GME available shorts. Some don't report their short positions so 20% short interest on GME's total free float is being nice.
10 mil shares owed to be bought back. No more (known) lenders available to lend out more shares. If the over-estimations of how much of the float is locked are correct, then on March 9's GME earnings, we'll know that the free float will be 16 mil shares with 10mil shares short.
If you're a smart short, you'll close your shorts before that happens and some may be doing it already due to the current price peaks that are still typical of an SLD/NSCC deposit cycle, so it could be either...
The problem for the shorts is that next week, there's going to be volume hitting GME from option clearing and it's been bullish in 4/4 last cycles technically. There's no reason it wouldn't be bullish for this cycle on 22/2/22 as well.
So if the options clearing period causes GME to go up even more to it's preferred position of $180 (The battle for $180), and with only 19 days left to earnings & the announcement on how much of the float is locked by Direct Registration of shares... then, yeah, shorts are actually in a bit of a pickle regardless of whether the reported DRS/Direct Registration shares are less or a lot less than expected as with 100% short utilization, ~10mil shares short is the best that they could do & a drop of price to $100 with us slowly inching upwards thanks to the 90 day quarterly option clearing cycles & bullish orders stemming from those.
The shorts are going to struggle with GME like they struggled with Tesla, but more. I believe this is an unwinnable battle for them in the long term & that GME can only provide them short term gains. As to the shorts that will never understand the above who will keep attempting to short GME at any price as it always slowly inches up, they will keep getting burned & will continue to contribute to GME's slow but definite price rise. GME is an eternal bear trap.
The only way forward for the shorts (funny pun for those who'll get it), are Synthetic Forwards & other Synthetic option strats that mimic short positions & Variance Swaps & the replicating portfolios made up by options (and the ports are dynamically hedged by adding more options) to make money off volatility rather than movements of the underlying but with effects on the underlying.
======
======
My own stuff
Since today on market open at around $124.9 i managed to go all in with plenty of NTM, ITM and Deep ITM calls for March 04. All my calls are below $130 strikes expiring in March. I picked those instead of 25 Feb as IV increases on Feb 25's do not give ANY significant return especially with the NTM strikes i like. With the March expiring options, IV increases can actually provide another +10% on top of intrinsic option gains if opened & closed at the correct timing which is what i plan to do.
I have several super deep ITM calls that i plan to exercise. I pity the person who sold those who's about to get assigned on those. I plan to sell my NTM's at the peak around the 25'th, maybe earlier or later as the true range of the cycle is 22 Feb - 04 March and this is the timeframe where options still get cleared & orders from them still hit the market with the FIFO/First In First Out order. No one knows what's gone in first and what's coming out last. A clever man would've made sure that his FIFO orders would cause an initial price drop during the netting at the NSCC/OCC to screw retail GME holders & short put sellers. This did not happen in November in my opinion and as i said somewhere above, shorting commenced exactly on the day of November's cycle and not one day too early, but it was moot and just gave people a chance to buy calls at the bottom & load up on more shares cheap, myself included.
I have personal PT of $242 for this run. In reality we might not pass $150. That's why i'm fully hedged but in the majority bullish for this run. $242 is my PT based on what the current SLD week is looking like. It really is looking like last year's MAY run where GME ran by +85%. Equally we could simply repeat last November's run and only touch +25% on the underlying stock price.
In May we went up 90% ish, in August we went up 50% ish and in Nov 25%. One would expect 12% for the next run. I expect +90% due to what this SLD week is looking like and again, it looks like last year's May run (See chart above). As VIX slowly drops towards and below 20 & the GME borrow rate plummets, we should see the runup occur and the timing of it looks like it'll be impeccably on exactly 22/2/22 in my opinion based on option flow, CFTC swaps & 1 year of too many hours of daily GME & market research.
I own nothing else other than GME for now. Let's see what the future brings. None of this is financial advice. Just because i've yolod my entire life's worth on this run, doesn't mean you should too.
Good luck whether you're long or short. I really hope for your sake that you're only short puts for the next 2 weeks and not short calls until March 02 where the option clearing cycle ends. Please have realistic price targets for this run. Better safe than sorry.
Again one more time, not financial advice, and i'm literally not a financial advisor. This is my research & i trade based on it, but it's aggressive and maybe not suitable for others.
GME GameStop consolidation areaAfter GME went even lower than the exacted support line:
Now we need to keep in mind that $90 is a great entry price in case of a selloff due to market condition and increasing of interest rates.
GME is now in a high volume consolidation area, slightly bullish in my opinion.

GME uptrend into OPEX. My prediction and thoughts.Hello all my fellow GME chads. I see GME forming a normal 5 wave uptrend pattern forming. Rules of EWT states that the 4th wave cannot go past the peak of the 1st wave and even tho we broke it by pennies, i still believe this pattern is valid. Therefor I see the 5th wave ending in the blue rectangle box labeled as such (~$150). 5th wave extensions are very common as well, especially bec we did not get a complex wave yet in this pattern. If we extend, i expect the next resistance to be 160 and 169. OPEX is this friday which means the T+2 settlement date is 2/22 (Tuesday). The higher we go into OPEX the better, I am very excited.

$GME - Feb Cycle UpdateJust a small update.
I've started building a position in GME long calls starting today as i'm not sure whether we'll see the typical SLD drop. My thoughts are that the latest Ukraine/Russia warmongering by the US media has failed to cause the market to plummet and thus be used as an excuse for the monthly & quarterly SLD drop that should happen this week.
I'm not sure whether we'll see the drop or not, but i'm now leaning more towards that we won't see the drop for GME. Due to this i've started building my GME cycle position for next week & the week after. I closed my SPY puts today at $438 and reversed some of it into GME calls. I'm holding on some cash in case we do drop more this week so i can get more calls near the money cheap. I've also got into another retailer stock that likes sympathy runs during these GME cycles, but i won't mention it here as it's besides the point.
Good luck to whatever you decide to do.

$GME - Cycle about to start, but beware of next week.Next week from Wednesday to Friday, the top 30 NSCC members (Biggest banks) need to provide liquidity to the NSCC for option clearing.
Typically during the week that this occurs (next week) in 3/4 cycles, next week will see a drop in SPY and most indexes as well as their constituent stocks.
This drop is very to include GME as well. So far in 1/4 cases (Last November) this did not happen and instead GME was very bullish for what November's equivalent that is next week.
I've taken profit on my GME cycle calls and plan to re-open them some time mid-late next week during the dip. During this time i've already grabbed SPY puts due to the expected index drop during the SLD/Supplemental Liquidity Deposit banks need to make for the 17 Feb - 02 March OPEX/Option Clearing cycle. From the behavior of the market/GME/SPY etc, it "feels" like we are in a proper GME cycle and that we should expect that options being cleared that will hit the market on 23 Feb will cause GME to reach the $180 PT or more.
This is not 100% for sure of course as there has been one out of 4 instances where this has actually failed. I'm going with the odds that SPY will drop, GME will drop.
Good luck to whatever you decide to do. The fact is that next week is the SLD and the week after is OPEX. I'm gonna roll with it and expect that the whole market will behave as it SHOULD during this period which is to "correct" a little, see VIX pump next week & all stocks down with an eventual recovery around Thursday-Friday (hence where i'll be re-entering GME calls).

GME OutlookHello again, still watching the monthly and weekly charts on GME. It's possible we have a new bull run in the next few weeks, but i believe we still have more downside. Institutions still are not buying and there has been no major increase in volume. Follow the money and think like a whale. With that in mind i believe we will still see $50 range and see some form of accumulation phase similar to what we saw before the previous bull run. Hard to say if it will squeeze again, if at all. However the company really does look to making progress towards becoming a great tech company with all the new hires, msft deal possible, and nft marketplace.

Lrc trendsWe still haven't come back to touch major trend yet. Everyone feels very bullish right now, but we Still have a strong possibility of rejection here.

GME BREAKS TRIANGLE = BULLISHWe never hit the bottom of the triangle, which is super bullish. I know everyone saw what happened today and is wicked pumped, myself included. Honestly i just want to keep posting updates to keep the hype train rolling. NFT announcement finally LFG! Cannot wait to own my own in game items, i am not into buying skins in video games bec they are just a waste of money rn imo but once this becomes an investment that i can own on the GMERICA marketplace I am going to be so hyped. Gamers will be able to capitalize on their hours playing video games by earning items with real world value. it is so cheap at current valuations, it baffles me people are not jumping on it right now. Also, my bday was yesterday and i gave myself the day off from the charts so having today be the first day back and seeing what GME did was an awesome present :) See you on the moon gents!

GME Breakout daily candleGME range expansion today after a 9 bar consolidation. 15% more rally estimated based on the mode. Previous mode was accurate.
Bought ATM Feb 18 calls for $10.00

GME + FibTriangle = Super Bullish ! ! !Oh GME, Oh GME, are you really forming a fib triangle for FibTriangleWavesforDayz to finally give to the GME CHADS? The pattern that I owe my username to? My favorite bullish reversal pattern. I love taking a long position at the E wave. If we hit 89 or 90 either tomorrow or friday, time to buy more shares/calls. Lever tf up boys. I CANT STOP BUYING!!! BUY, HOLD, DRS, BUY CALLS!

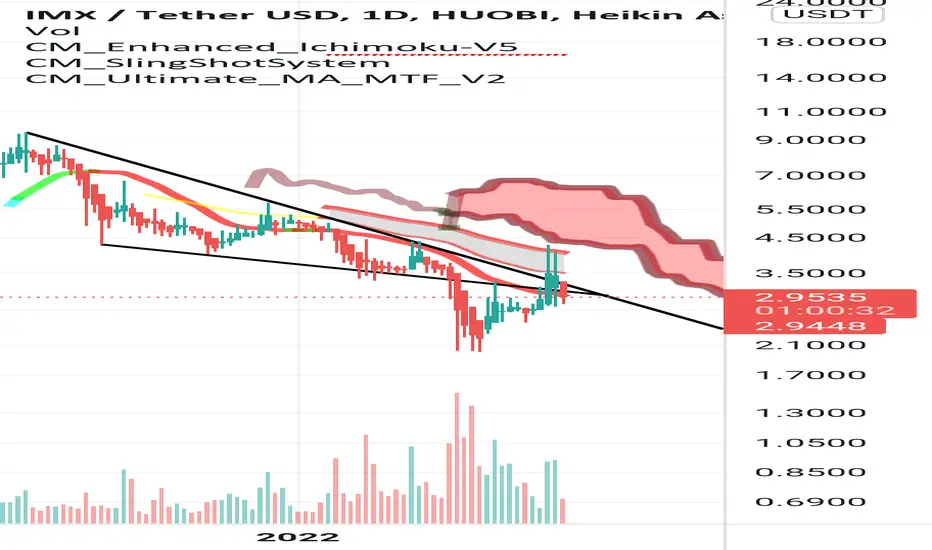
Thanks GameStopFor dumping 14 million imx tokens you recieved on apes/retail.
You can see we broke down, broke up again and then we broke back down below but holding. The weekend will probably determine where we go.
Clearly not enough interest to keep this afloat and I believe it's mostly due to Very negative social sentiment. Leads me to believe this will be dropping further as one looking to get into imx will not be drawn in expecting further downtrend. LRC looks to have the better social sentiment at the moment.
Holding on the daily so far. Pucker up crypto is a rollercoaster.
Reversion to the meanThing getting back to normal. Last time this stock did this was 2008 area but then was not as crazy like now.

GME - OH YEAH I LIKE HOW THAT LOOKS !!!Ik i have been posting a lot of bottoms lately and its bec there have been a lot! GME has had this weird daily price action where it closes red on the day with a green daily candle but does not really make any new lows. Breaking above this gets my nips ready for another rocket ship moon landing. I got NO2 and turbos in my rocket ship. My rocket ship goes fast!!! My moon tickets were bought, did you forget to buy yours anon?

$GME - February Runup Update #2 & Possibility of an extra earlyHere's some non standard TA otherwise known as: "This isn't TA, your resistance/supports are wrong m8"
The stock is going to start running around the 17'th - 23'rd of Feb. The run may last only until the 23'rd or may continue until the 02'nd of March where the OPEX/Option Clearing cycle ends.
I've found indications of the possibility of an early run just like in November on Nov 3. The indications are based on GME swaps expiring 9 of Feb which also coincide with Ryan Cohen's standstill agreement ending.
Looking in the past, there were similar swaps expiring for Nov 12 ish. No swaps were found for the previous runs of Feb 2021, May 2021 and August 2021. This leads me to believe there's a possibility we might run around the 2'nd or 3'rd of February 2022 with a duration until the 9'th of Feb Max. After this we'll experience the regular quarterly opex run down from 14-17 of Feb and then a run up on Feb 17-23 maybe up to 04 March.
The chart i've posted here describes all scenarios i've mentioned above.
TLDR: Basically this is the bottom, so get March 04 near the money calls at around +5-15% from the current underlying spot price, or if you're a bit smooth, basically if the price of GME is anywhere between $95-$100, then get $110-$120 strike calls expiring March 04 as these are the optimal to let you reap the max benefit whether the price runs early or later around Feb 22. I don't like those Feb 25's because the theta on those is too steep. Additionally the March 04's near the money as i've mentioned are almost always slightly mis-priced / on sale by around 15-23% off their theoretical correct price as long as volatility isn't going nuts when you buy them during the day.
The trade:
If you're a regular trader, basically buy GME at the current price & set a PT of $175-$185 as a safety place. Anything more is a bonus.
If you're an ape, just buy shares, hodl, drs or whatever.
If you're a degenerate who loves options, $110-$120 March 04 calls are great.
If you're a proper degenerate who wants max profit & risk, then consider $175 Feb 04 or Feb 11 expiries for the possible initial run and or & $175 strikes expiring Feb 25.
I don't post on Reddit anymore because people there are crazy. There is money to be made in GME regardless of what longs and shorts want and they are in the form of the OPEX ineficiencies mentioned above & previously in my reddit posts.
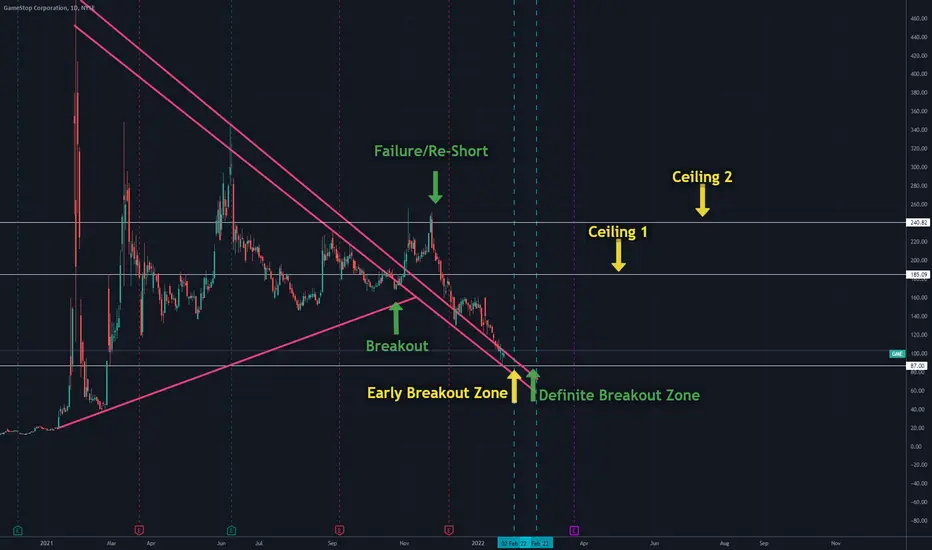
GME: THE PRICE IS WRONG / CYCLE THEORY, WHY WE WILL MAKE A RUN First and foremost, credit to u/PWNWTFBBQ
Not financial or sexual advice.
GameStop runs on 90-day cycles, 17 day run-up, and is followed by a big red candle. If this cycle theory proves itself correct, the following dates we should expect a run-up would be:
Jan 26 - Feb 22
April 25 - May 16
July 22 - Aug 10
Oct 20 - Nov 10

Gamestop - MOASSIdea for GME:
- The MOASS is here.
- There is a global shortage of both US dollars and high quality collateral for debt (10-year US Treasury bonds). Why would the dollar be rising despite the high CPI prints? It's simple. To borrow, one must have collateral.
- CS's Zoltan Pozsar explained in Nov. 19th Global Money Dispatch that currently, this demand is caused by Europe. "the ECB bough too much , reducing net supply via QE, and it topped it up with TLTROs... This week, the collateral shortage in Europe spilled over into the FX swap market: on Tuesday it became cheaper for a euro deposit holder to pay a premium and swap euros for dollars and buy Treasury bills with those dollars than to buy German bills."
- While I won't go into it, it is speculated that Citadel has a great short exposure to 10-year US Treasury bonds, through their repo market arm, Palafox. May or may not be true, but it is evident that someone (probably every hedge fund) is short USTs and they are also short GME. GME by extension is a bond market volatility proxy. As long as the correlations hold, it can be traded.
- What is also true is that Large and Small speculators are record short 10 Year T Note futures, while commercials are record long. Bond market volatility is reached a level where VIX was trading at 50+ previously and is higher now than what it spiked to during GME's first squeeze to 500. Somebody is about to get to get blown up.
Bond Market Options Volatility (MOVE) leads GME by 15 days. Timing of MOASS, Dec.3:
GME losing correlation with IWM and gaining correlation with VIX and USTs (new regime):
You might get one more smash down (I expect a smash in bonds in a risk parity event before a squeeze), but I am confident this is about to happen. I'm not even going to give a price target, but it's over 4 digits for certain.
When I did analysis for my AMC trade, I correctly read the psychology of the large market participants, after reading into it more and connecting the dots, turns out they were BlackRock and Citadel:
If you are short GME, do you even know who is on the other side of your trade? Retail "apes"? No no no!
BlackRock, who manages the US assets of foreign sovereigns, and ICBC China, with a 100% correlation to GME. China is about to enter an easing phase:
GLHF
- DPT
Causation always produces a correlation. Liquidity takes time to flow through the economic machine.

GME BOTTOM FOUND! HEDGIES R FUARKED!Get excited GME CHADS!!! 0.5 puts expire today... push below 100 to make paper hands scared lol. I have never been more bullish! My call option position has been tripled today! BUY GME !!! GET YOUR MOON TICKETS NOW & I'LL SEE YOU ON THE MOON !!!

Let's play the GaME!GameStop broke this triangle 📐 up, and I think there is chance for run to 605 USD and even higher. Just bought the pullback to the BUY level, which is previous local high now acting as support. Let the game begin! 🎮
ENTRY : previous local high @ 189.33
SL : local low @ 136.5
TARGET : height of the triangle projected from midpoint of the local range (BUY - SL) @ 605
RRR : 8
INVALIDATION : when SL level hit
Like👍 & Enjoy🍿!
#GAMESTOP #GME #STOCKS #WALLSTREETBETS #WSB #SHORTSQUEEZE
