GME Bull Flag Formation
Flag Forming on GME stock 15 min interval. Play the breakthrough of resistance (around 220+ on the close) for a long position.
Sell Attack may happen from the hedge funds, you can potentially short on the fall through of support (flag).\
Neutral for now as it is sideways market.
Gamestop

Gamestop Ponzied - Stop Pogging - Learn to InvestPoggers are fun. Broke, but fun. Learn to invest and you'll do great. Hint: It's not Bitty or the Doge either. Dang Monkeys. I mean Apes. My bad.
#cannabisboom2021
*rising rates gonna wreck the POGGERSSSSS!!!!

AMCBig breakout over the 40 level today. Calls paid big if you played this.
Trade Idea: 8/27 50C over 46. *roll up with profits. (higher risk if you didn't already trade it yesterday.)
**Over 700 call sweeps yesterday.. one for 9/17 100C

Next Stop is $269 for $GMEEverything is right on schedule. $340 target still working, next stop at the station is between $265 & $269. I am your Mom's favorite trader.

A new way to look at $GME (Gainzstonk)This may be a stretch but in theory it could work. What if we're still on the 2nd wave of this macro 5th wave cycle? What if the moves from 140-340 were just a complex elliot wave pattern inside of the true big boy one? Just a thot. If this ends up being true we could see a move past the ATH of 483 and then one more corrective wave before the big daddy 5th wave to end it all. Worth considering. GME to the moon baby!!!

[GME] GameStop - Pump Fake or Beginning of another Pump?GameStop saw a $60 jump today in price. However, it is still below the 200 Day MMA, so I am not sold that it is the beginning of another pump yet. It could have been just a pump fake to shake out the retail traders. If so, we will likely see a Bull Trap tomorrow and then a dump. But if it is the beginning of another pump run, then tomorrow it will continue pumping. Will be watching and update as things unravel...
GME Wyckoff Events and PhasesToday I'm studying Wyckoff while watching The Wachowskis.
Switch: "Not Like This, Not like This"
I'm afraid so. Everyones favorite short squeeze has Wyckoff all over it and we're at the phase where a Sign of Weakness may be revealed.
I think a reinvented GME is going to surprise everyone in the future, but in the short term things are looking bearish.

$GME - Next GME Bull Cycle is hereThe next GME bull cycle is here.
Aug 24 - Sept 02 bull run, to unknown price range.
Possible continuation until the 8'th of Sept.
9'th of September futures rollover we will either MOASS or drop down significantly as we did in March and June and wait until the next cycle and repeat.
All in all, the general floor is increasing by $10-20 every cycle so if you held for a few years at a good price (let's say $150, you'd be golden). The ceiling for the other side of the trade is decreasing which is why i have doubts we'll touch $300's again. If we go beyond $260 in my opinion, that's margin call territory. On September 1, their margin requirements for SWAPS/Futures increase x 25 due to Phase 5 of UMR. That will put significant strain on "them" and perhaps deny them the ability to rollover the GME Swap Future position into the next quarter. Regardless they will take a loss on it and we will runup to 'some' price in the next 2-3 weeks.
If the margin requirements are too hard on them which they should unless they are exempt, this should/could be marge calling, but regardlesst of that, there WILL be a runup, it's just a question of whether this is the one or not. If its not this one, it could be the next one.
Buy & Hold
www.reddit.com

$GME: Round 2 of Selling?With rough retail numbers behind us, is there any room left for GME to run or will we continue the descent to ~110-100. We'll see!

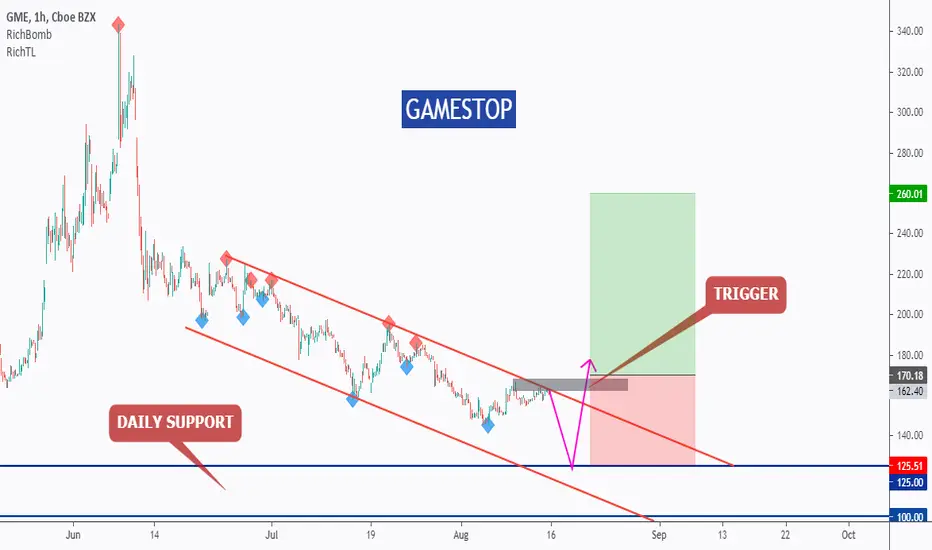
GAMESTOP - Potential Bullish Reversal!Hello everyone, if you like the idea, do not forget to support with a like and follow.
GME is sitting around a strong support zone in blue so we will be looking for buy setups.
Before we buy, we want the buyers to prove that they are taking over again.
You don't want to buy a bearish market right?
on H1: GME is forming a channel in red but the upper trendline is not valid yet, so we are waiting for a new swing high to form around it to consider it our trigger swing. (projection in purple)
Trigger => Waiting for that swing to form and then buy after a momentum candle close above it (gray zone)
Meanwhile, until the buy is activated, GME would be overall bearish can still trade lower inside the zone before going up.
Good luck!
All Strategies Are Good; If Managed Properly!
~Rich
Actual GME TAI think we've hit the bottom of this 5th wave downtrend and i believe that were in the middle of the abs correction as we speak. Current SHORT TERM price target is 195 and after that we have a big gap to fill. HOLD and await the tendieman, I heard he is coming ;)

Retail gamblers lifesavings got ... katapulted away!This virtual e-commerce company with virtual profits let everyone know how many millions they lost yesterday / this night.
This is what happens when bad investors refuse to cut their losses. Now here we go with "class action lawsuit" whining.
And today in "I put a bunch of tech catch words together which doesn't mean anything but attract suckers" awards, I present:
"With Katapult, you get a cutting-edge lease to own option built for you, with no credit required. You can apply using our intuitive online process in-store or at home while shopping online. Our flexible pay-over-time options coordinate with your pay dates. So, you can make payments when you have the cash."
In todays best rektage, there are a few other examples.
Metromile
The investors most certainly are not smiling here
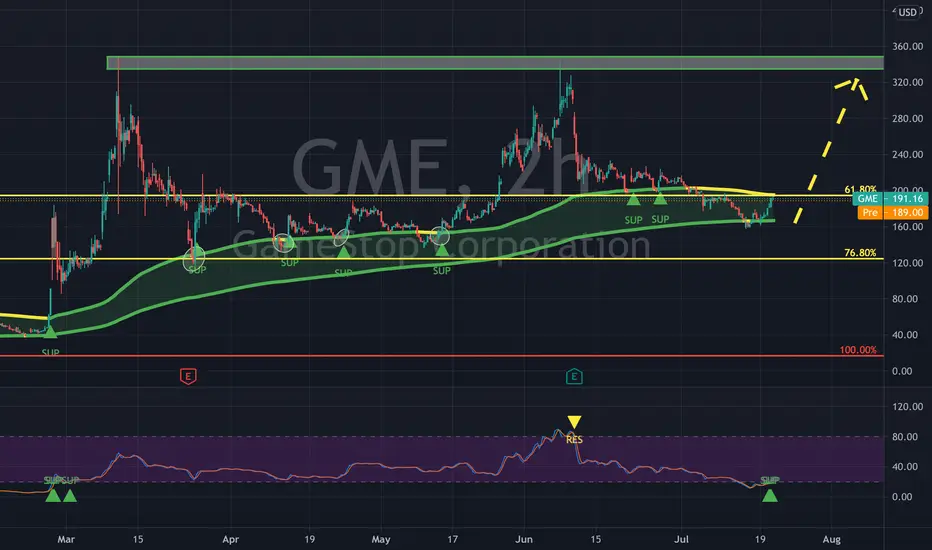
You may note how it consistently retraces to around 61.8% before the big fall.
I don't do stocks, or not much, maybe I should, I wish I knew about these free money garbage companies.
But I do know about GME, it was on the news and all. And it too has potential, with lots of bagholders.
Those companies are troll shell companies with
- NO PROFIT
- NO MARKET
- NO GROWTH POTENTIAL
- NO PURPOSE (OTHER THAN SCAM BAGHOLDERS)
- NO USEFULNESS TO SOCIETY
The kind of company that goes up is obvious. Here. Pfizer is at all time high already! Simple.
Gamestop went up because of the short squeeze and that is long over. There are no shorts left (there are but less than 1/10 of what used to be).
The trolls holding now are 100% irrational. They have loss aversion and that's it.
By the way, Moderna is the best performing "asset" this year.
It is the best performing stock in the S&P 500 AND it's price to earnings is still cheap.

GME - Very BullishRSI has touched 30 for the first time since Jan of 2020.
BlueWave also gave us a GreenDot buy signal
We're also in a great buy zone


Vanguard S&P Small Cap Growth ETF - clear horizontal boundariesFour months range-bound, this low-volatility ETF includes 600 constituents and offers a tiny 0.10% fee for the more passive, but still risk inclined investor (these are small cap growth oriented stocks).
The pattern boundaries are clear, and volatility is relatively low vs. historical. Price action above $235 would confirm a breakout to the upside, while a move below $205 could reflect a broader selloff coming for growth stocks.
Constituents include companies like: Gamestop, Omnicell, Macy's, Chart Industries, 3D Systems, Agree Realty Corp.
Several of the individual constituents also have constructive charts, with subjectively clear risk levels, such as 3D Systems (DDD).
$GME, $GTLS, $ADC, $DDD, $OMCL, $VIOG

GME LongJust up & HODL to the green belt, Buy the golden dip brick by brick, Buckle up to the ...... moon, No exit strategy just get some bloody red tips!

Possibilities for a strong move upwardIn the image above there are some strong trendlines that pass through the yellow rectangle. Two are particularly strong, and two not quite as strong.
The downward trendline cuts through the other three, and I believe one of those will be where we see a drastic upward movement.
Why?
It's a uhnch, really, but I believe that this is a heavily manipulated stock so otherwise recognizable patterns might be distorted. I don't think we'll see a significant upward move above the downward trendline until the price action establishes itself along one of the upward ones. It's essentially a wedge, but with lots of downward pressure from synthetic positions. That, of course, can only last so long. It may take until the last week of August, but I see it happening before then. The completion of this loosely shares the same timeline as my prior post about e-minis. I see emini's upward climb failing in mid Aug.

GameStop - GME - Are you ready to get in the Game?GameStop - GME - Are you ready to get in the Game? GME found support at the lower moving average. The last time GME touched the lower moving average there was a big move in price. What will happen next? Move up or move down?
"the grand heist"this is not financial advice.
i've never quite seen anything like this before in my life - not even crypto.
treating this stock as a learning experience for my own personal research, nothing more.
-
if the og apes could pull this one off - then the future generation of millennials will be reading about this in their history books for the many years to come.
✌

GME is in the buy ZONEGME is currently in the buy zone.
BlueWave Confirms Green Dot buy signal.
Its in the consolidation zone.

Lets help Bill AckmanWith the fundamental : Billionaire Bill Ackman's blank check company, Pershing Square Tontine Holdings Ltd., has signed a deal to buy 10% of Universal Music Group for about $3.95 billion. Tight Risk Stop 22.00. Entry 22.50. Target 35.60.


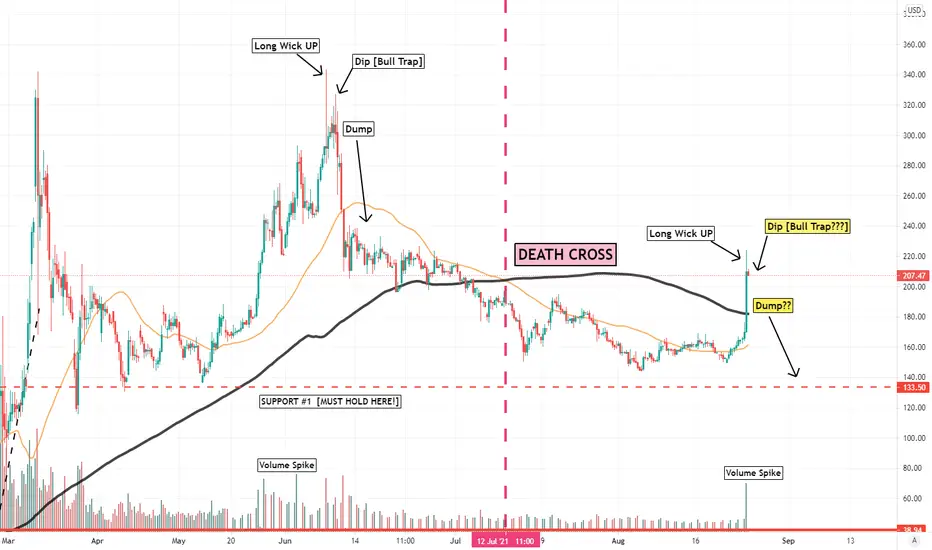
Game Stop [GME] - 7/15/21 - It's going DOWN. Here's my analysis on GME. It's been weakening for a month and we just got a death cross. Not a good look. Headed down for the foreseeable future. Must hold at Support #1. If it can hold, that's a good sign. If it breaks below that, it's gonna be a LONG summer. If you're still holding at that point, I'd probably just HODL and move on to other stocks and wait until the next time it pumps. In my opinion, this is a very RISKY asset. It's a pump and dump. My approach to trading this would be to enter when it creates a floor... and then sell for profit when it gets pumped. Rinse and repeat until this stock no longer is being pumped and dumped and they move onto the next one.
Not financial advice, but just my thoughts after observing GME over this past year and hearing all the rumors and theories out there. The idea of a MOASS is keeping investors from selling when it gets pumped and even has investors buying HIGH. This can be a recipe for disaster. From my observation of these meme stocks, this is a risky game here, especially for new investors/traders. Don't worry about facing off with the "hedgies". That's likely to be a losing battle and that's not worth the headaches. The way I'd approach it is to get in at a low price when it drops... then sell after it pumps and take my money to the bank. Rinse and repeat until it's no longer being pumped and dumped. The reason we trade/invest is to make money. Gains are not guaranteed. We can't fall in love with a stock and we can't fall in love with an idea. We have to take profits when we see profits. In the end I could be wrong and the MOASS could be coming but I wouldn't bet my life savings on it. Maybe grab a couple of lottery tickets at the most. Just my 2 cents.
