GME Weekly RSI Turning Up STILLThis is an update from my previous post flagging the potential for breakout:
You Won't Believe What the World's Most Beautiful Girl Looks Like Today
...WHAT A MOVE. Looks like it's ready for more as we are not really even in overbought territory yet.
Do we enter my upper trendline and push for $500? I think so...
Gamestop

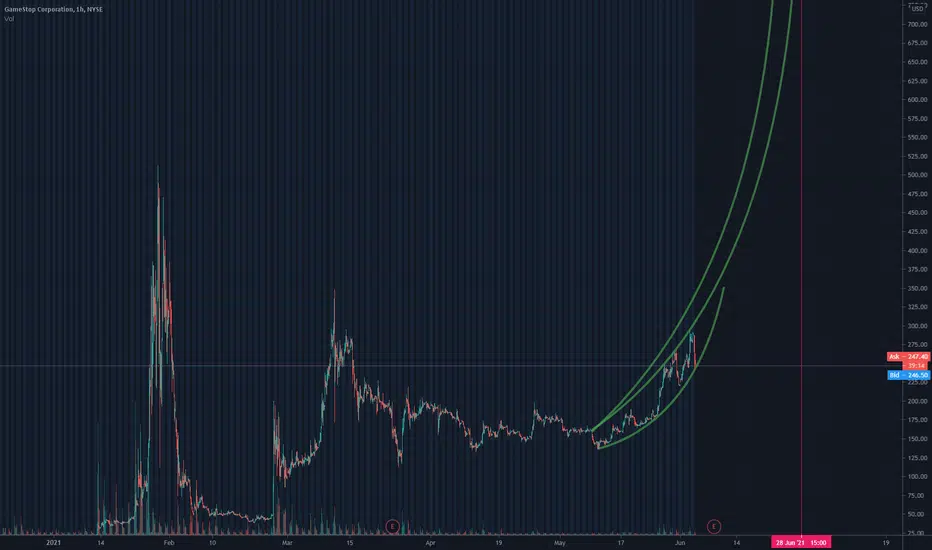
GME 6-Month Logarithmic Trend ForecastSince Dec '20, $GME has bounced off a logarithmic floor. This chart forecasts that trend for the next 6 months.

AMC stock :powerfull buylimit place we dont advice trade on AMC or other meme stock like gamestop (atleast use very low size with SL,each seconf they can crash to 10$) but technical say it must go down,fill gap , then fly up to touch 100$
for next days we advice = looking for sell on dax futures FDAX1! , buylimit on bitcoin 18000 ,
if you have more than 50.000$ (buy bitcoin 18000 for hold until min 80.000) please massage me ,we want buy above 15 btc in 18000
good luck

$AMC #AMC Personal prediction for today and start of next week Hello all,
Here a little technical analyse about $AMC #AMC. Why? Because i love the stonk. Am i biased? Absolutely! Is this financial advice? Absolutely NO. I'm just a crayon eating Ape who loves to draw lines and like you can see in my last predictions, an average gorilla can predict better.
What does the chart tells me? I see an Apish break out once the price breaks out of this pattern. After the breakout normally it will followed with a little retest of the pattern or support at our latest high. Once that retest is done and you see Apish momentum going up, this might be the time for me to get some more moon tickets. Need my paycheck to grab some more. More then all-in will be in debt and one thing we learn from all this what hedge funds are doing is, don't gamble with money you don't have. It can go well for a while, but one day it will go bad and then its gonna be really bad.So be wise and spend what you can miss for a while. By the way, read the book 'The Richest man of Babylon'. Great inspirational book about everyone can create more financial wealth for itself.
Back to the chart.
When the breakout will go the bearish path, don't be scared. As long the hedge funds haven't covered and closed their short position there is absolute no doubt, that the price will go back up higher. I call those moments even good opportunities to grab some moon tickets with a discount. Main thing to focus on, is the number of stonks short by the hedge funds. We only can see what is known, and that is there are 513 million shares outstanding. 18% of that number, so 90 million shares, are used to short this beautiful company. After this week and the second interview of CEO Adam Aaron with Trey Trades, we know 2 things for sure.
1) AMC has raised approximately 750 million US Dollar, with selling 20 million stocks. This isn't a bad thing for a so-called 'meme-stock'. Right now there 46.000 stocks left to use for AMC to raise more capital. That's why they want an extra 25 million stocks, so they can use them to raise more capital, but they will not use them before 2022. And because of that there is not a good reason to believe AMC will go bankrupt soon, with all the re-openings after Covid-19.
2) The management of AMC has chosen to use these 20 million stocks, which were intentionally meant for the management as kind a salary/bonus, but instead paying them to their selves, they have chosen to really help the company and used it for strengthen its position. Because you all know, the business where they are in is a though one the last decade and Covid-19 hit hard. They are going to use this capital so lower debt with a discount and if they see an opportunity to expand their business, they will grab it.
An other good qoute, which helps me in this Ape journey is from Charlie Munger. I assume you all know he is, and if not DYOR.
'The big money is not in the buying and selling, but in the waiting.'
Well, i'm in since January and that's for an investor pretty short term, but for a continuous battle with hedge funds i can tell you it is intensive. But the good thing about this whole Ape thing is, I am not alone. You are not alone. In March there were already 3,2 million shareholders, only accounted in the USA and Canada. That was in March and that was only counting the USA and Canada. I think we can say that by the day of today, there are probably around the 5 million shareholders, only in the USA and Canada. And well there is more in the world then the USA and Canada. It may have bin started in the USA, but like myself, im from Europe and already in it for 5 months now. And i know there are many, many Europeans just like me in it since January. And i know also that since March i've seen growing this population bigger and bigger, week after week. I think we can take a little guess and say there are approximately 7,5 - 10 million shareholders by today.
Just simple math
Outstanding shares 513 million
Shares short -90 million
Institutional shareholders -40 million
That will make approximately 380 million shares for the other shareholders.
380 million shares / 7,5 million shareholders is 50 shares on average for each shareholder.
I don't know if you all have bin following some Apes on Twitter, Reddit or other social media platforms, but people with 50 or less stocks are a minority. Don't forget when the stimmy did kick in, the average price was 11/12$ and most of the people who spoke about it used their complete stimmy, which gave them already 100 shares. That's the good thing about the share count. So make sure you going to vote for the shareholders meeting and ask your broker how you can vote. It wouldn't surprise me that total outstanding shares will be multiplied. Understand good, this is against the law. When it comes out that their will be not 513 million shares, but 1 billion shares or 2 or 3 billion shares are outstanding, someone or a few more peoples are in big trouble, really big trouble, when the price will keep going up and they get a margin call. Because when you are trading with money that's not yours, the day will come that the owner wants his money back and above all don't want to lose his own money because of your risky trades. On top of that if SEC and FINRA will do their job, which they didn't really do after the 2007 crash, the punishment can be bigger and much bigger then only losing money. JAIL.. But.. don't know if you have watched 'The Big Short' and if you haven't you certainly should do, this financial world is kinda scaring.. It is a bubble. They are living in a bubble and the average Joe can pay the bill for it. In 2007/2008 millions of people lost their houses, jobs, family and above all they have seen an decrease of their health. Don't forget what money troubles do to a person. If you have to take care for your family and you are paying the rent every month, but your landlord is in trouble, you are in trouble. It is that simple. Shouldn't be like that, but in the USA it was that way in 2008 and maybe still. So sincerely I do hope my Ape family is right and we will see the biggest transfer of wealth in history. Because I do believe a lot of Apes can make their lives and the lives of their loved ones a little bit better with some gains. The difference between 1 or 10 million USD on your account is not that big, but the difference between $ 100,- and $ 1.000.000,- is huge!
Uhm.. Wait the chart.. Well one last thing about the chart..
After the Apish breakout from this pattern and have retested it 100$ is a region where we can find a nice area with probably some accumulation before it will continue. This is based on the price action we have seen this week. When HF's starting to cover it all will no make sense and the moon is the limit. Anyway, no advice, but i'm holding those stonks with diamond hands!
Let me remind you, this NO financial advice, nor am I a financial advisor. I just love the stonk, love to eat crayons and draw lines.
Make everyday some smiling, give every day something extra and you make the world a better place!
#ApesStonkTogether
#MOASS is inevitable
#AMCARMY
BTW This all above is also for #GME.
I'm holding both and I love both! #ApeNoFightApe


$GME - Is it go time? (Not a DD post)Hey all,
Not a DD post as i think the rocket is on it's way up already, so what's the point right?
I think we're in fact trading on Max Pain even though many people (including myself previously) are now convinced that we're not. I've collected my own Option Flow data and compiled it and realized that the max pain for the OI of the past 2 days is $290. For the price to drop significantly today there must have been new excessive call/put buys or actually contracts being closed due to the new OCC-003 coming to effect today which increases market makers collateral requirements for options. This would mean it would be much harder for them to keep kicking the can down the road using deep ITM puts and married puts.
I speculated that there would be a sort of flash crash when wer'e near $300 on one of my reddit posts 1 day before the actual mini flash crash from $292 down to $260 happened. This assumption was based on the HUGELY uncommon amount of ITM puts at $300 purchased on the 23'rd of May for $61 million premium dated to expire in 2022 and 2023 January (lmao). My assumption was that somehow exercising these would flash crash GME, but i think that's completely wrong, i think what actually happened was that they dumped/closed those contracts yesterday with something like 95% loss which caused the other side of the trade (algo) to dump the shares it was hedged with and this was likely the reason behind the drop from $292 to $250 ish yesterday.
Today 3'rd of June i assume the reason why we're a bit down is that because more contracts are being dumped due to OCC-003 coming into effect today EOD. If they don't dump them, it'll mean insta-margin call tomorrow, so they have to dump them or at least that's the assumption i'm making. By dumping those contracts they're severly affecting the Max Pain point between call / put open interest for GME which is likely the reason why we're moving so erratically.
Jefferies has also restricted short sales on GME today which is quite funny because of it's timing with OCC-003's arrival today. It says a lot.
I think the rocket is off and is only a few meters/feet off the ground right now. If these levels at $240-$250 hold and we bounce off upwards from here then that's fantastic news because the GME chart is likely to be fully vertical by the end of June as the price is moving up logarithmically right now and that's bloody insane. ~$250 is the bottom of this logarithmic/exponential curve.
Let's see what happens, strap up, lay back and relax and prepare yourself for a generational wealth transfer.
I'll be doing a DD write-up later on as i have too many theories on how they've been able to game the system for this long and how it's coming to an end for them due to the recently introduced new regulations under the SEC, FICC, DTC, OCC, NSCC etc. I've contacted the SEC in regards to the deletion of regulation SR-DTC-2021-005 and requested a FOIA update on it. This should get the wheels turning and questions asked on who deleted this 1 regulation that literally kills share rehypothecation.


$GME GAMESTOP ELLIOTT WAVE ANALYSISJUST MY INTERPRETATION> NOT FINANCIAL ADVICE, I have a target at 566 which should be possible by the end of year in my opinion . What we saw this week is the possible first wave of the 5 wave for gme.

GME Potential LongAfter seeing GME make a fake break below the symmetrical triangle and then reverse back up with a nice move out of the base, seems like the momentum is back for this wild stock. Liking a long trade on a break of the yellow line right around 265.
*Opinion only - not financial advice*

GME morning bear trap (historical reoccurence) leaves gapIt's hard to see but the resistance is at 290, 330, and 405.50 would be the exit of this second wave and the negative divergence and p-n-p MACD bullish divergence and in CCI OB vs on the last drop in that price range

GME CHART ANALYSIS - LONG TERM MOVEGME IS SHOWING SIGNS OF A MACRO MOVE UP. I BELIEVE THAT WE WILL SEE $700-$1,200 WITHIN THE NEXT 30-60 DAYS. THE STOCHASTIC IS STARTING TO CURL UP AND THE MACD IS POSITIVE AND TRENDING UP. VOLUME IS INCREASING EVERY DAY AS WELL. IT WILL BE VERY EXCITING TO SEE WHAT GME HAS IN STORE FOR US.

Gamestop - GME - May run up in June! What do you think?Gamestop - GME - May run up in June! What do you think?


BOASS (Big Brother of all Short Squeezes)Medical History:
Based on Fibonacci levels expect a return to high 200s. Also expect some profit taking at that point. I am not expecting a return to low 100s, and although I wouldn't rule it out, R/R is favorable for long positions. Regardless of earnings details there will be volatility, and if a retracement occurs those who have been on the sidelines are likely going to take this opportunity to jump on the bandwagon.
Lab Investigations:
-Fibonacci levels
-Wyckoff accumulation model
-Decreasing Volume and MACD divergence
Diagnosis:
Squeeze
Management Plan:
Buy the dip
Don't forget to like & subscribe!

Short at least a third of the upsideAnother spike maybe on earnings but after that this stock is back down. January 2021 won't repeat itself with this stock.

$GME Update + In Depth Technical AnalysisAs you can see, GME has yet again shown another day of upward momentum similarly to January earlier this year. It has reached its Fibonacci levels how I anticipated in previous posts. We saw resistance yesterday at the 38% retracement level around $215 near the close, but further steam gathered in post and premarket trading as AMC began to take off as well, sparking the "return of the squeeze" from WallStreetBets apes. AMC has nearly retraced from its highs nearly 100%, and GME has shown very similar price action and breakout patterns but seemingly after AMC this time. Price jump in the morning pushing it even higher right through fibonacci resistance level, now approaching 50% retracement which is ($265). I do see this going to that level, and option flow volume tells the same story. The price targets are respective to fibonacci levels, and important levels to look watch in the coming days and into next week.
PT1- $211 > 38%
PT2 - $265 > 50%
PT3 - $315 > 61%
PT4 - $387 > 78%
PT5- $485 > 100
I personally believe this easily goes to $265 short term, and then depending on how it reacts at that level with price action and volume, judge it and update through a post accordingly. I think AMC Retracement levels are giving people confidence and even causing some speculative buying because of how AMC has traded in respect to fibonacci levels.
Options Flow Summary & Heatmap
Top Contracts in Premiums
5/28 $250 Calls - $4.35mil
5/28 $200 Calls - $3.78mil
7/16 $800 Calls - $1.98mil
Total Call Premium $ = $27mil
Total Put Premium $ = $4.43mil
- 0.72 Call/Put Ratio
All to those factors to me, are very bullish.
RSI Convergence popped nicely, and still has room to run, not being in overbought territory, as well as MACD showing a strong reversal with a value of 10.78, meaning this can most definitely move higher as previous 2 waves ran near a 50.00 value before a pullback.
Hope you enjoyed this analysis and if you have any other questions, anything else you would like to see, and if you would like more detailed analysis like this let me know. Follow for more opinions, appreciate the feedback, GLTA. Twitter linked below.

Gamestop - GME - will it do the same as AMC - repeat the SqueezeGamestop - GME - will it do the same as AMC - repeat the Squeeze. Get Rich slow? We will see?

GME: Long Puts from 270-295Well here we go again, I am back to spin the roulette meal that is GameStop. Full disclaimer, I have gotten lucky on this ticker… and made money for all the wrong reasons. also lost money for… The right reasons?
Anyway, I will be playing this one again despite my hesitancy, as I feel a really incredible opportunity for an options play could present it self here soon. I will admit that I have doubted the game stop journey from day one, and genuinely did not believe we would ever see these prices again, yet here we are, and that presents an opportunity!
I’ll plan to buy OTM puts when if the price enters the zone on the chart (270 to 295). I really can’t give a tighter range because… Well this is GameStop after all, so my entry within that zone will really depend on the price action I am seeing. My strike will be around 195, expiration 04June2021 (cannot be totally sure so I will update if/when I open the position.
I was just my personal strategy, and not intended to be trading advice.
Good luck out there!
- Joe

$GME Wyckoff Accumulation In Wyckoff's terms, a period of accumulation (cause) eventually leads to an uptrend (effect). In contrast, a period of distribution (cause) eventually results in a downtrend (effect). You can visually see a distribution (cause) if you take a look at Bitcoins chart. It provides another great visual of the inverse of this pattern on GME. We have now initiated launch sequence for the "effect" part of this journey.

GME forming a cup and handleIt looks to me as if we are forming a base after downtrend since match 10th lost steam. I expect a trend reversal over the next few weeks and a retest of the level at 280.
This is commonly referred to as a "Cup and handle" pattern. It's a very strong and very reliable bullish pattern.
The underlying psychology is bulls running into a resistance, they retreat to form a base. Meanwhile the bears try to shake out paper hands, forming a slowing downtrend. At the base we have a stalement between bears and bulls, until the bears realise they now only face diamond handed bulls, leading to a retreat of the bears, a retest of the resistance and the eventual break, followed by the continuation of the initial uptrend.
Trade idea: GME long stocks.
Stop loss: if GME breaks 116 to the downside, I consider this prediction to have failed.
Take profit: If you are just trading the technicals, the handle will likely begin at 260 to 280. If you believe in GME, buy and hold.

Down Then Back UpPrice is moving pretty erratic. Gap at $190. I would expect a drop before going up again. But who knows at this point.

$GME is a shark and cypher with the target of $3500recently I was extremely bearish on GME because of a reversal butterfly harmonic pattern with the target of $9. today I noticed a big shark or cypher on the chart and changed my mind.
AB=0.61 XA
BC=1.13 AB
tp1=0.78 BC=$32
tp2=0.88 BC=$44
tp3=0.78 XA=$132
tp4=1.27 BC=$154
tp5=0.88 XA=$207
tp6=1.6 BC=470
tp7=1.13 XA=$626
tp8=2 BC=$1607
tp9=2.24 BC=$3482
