GME SOME HOPE AGAIN?GME Crypto has performed a nice 50x since my call around 3 months ago. That's a pretty crazy result. Are there some hope to pump again? In my hopinion, the fight has just begun. I think we will see a pump on GME Stock and GME Crypto could likely follow. Actually the price reached an interesting buy zone, and i think we can see an upside move that could lead the price near 0.18
Gamestop

GameStop’s Stock Price Plunges About 20% After Meme Stock Surge GameStop's stock ( NYSE:GME ) price dropped about 20% after a meme stock surge by investor Keith Gill. The company announced plans to sell new shares and lower its sales forecasts, causing the stock to fall back to Earth. GameStop ( NYSE:GME ) now expects first-quarter sales to range between $872 million to $892 million, significantly lower than the $1.24 billion it made in the same quarter last year and below analyst estimates of $1 billion.
The video game sector has lost steam since the start of the pandemic, and there are no near-term catalysts in sight for GameStop ( NYSE:GME ). Analysts believe that the issuance of new shares makes sense, as it raises the company's cash reserves while sales continue to fall. However, they remain pessimistic about its long-term future.
Michael Pachter of Wedbush believes that GameStop ( NYSE:GME ) cannot "save its way to prosperity" and expects the mix of software sales to continue to shift to digital and away from physical. He believes that GameStop ( NYSE:GME ) will see continuing sales declines next year as well, and the company must deploy its cash productively or hope to issue more shares at elevated levels to forestall the inevitable.
The surge in GameStop shares ( NYSE:GME ) came after Gill resurfaced online, posting an image of a man sitting forward in his chair, a meme that gamers often use when things get serious. Since the earnings preannouncement by GameStop ( NYSE:GME ) and the company's decision to sell additional shares, he has posted 17 additional memes, indicating he plans to continue supporting the company.

Merger on the way, up to the stars with Gamestop🎯 TEDDY Merger is happening NYSE:GME x NASDAQ:BBBY
Cohen & Company AMEX:COHN recently issued an S-3 filing to register sale of securities.
Now why is this important?
AMEX:COHN received NOL benefits which are linked to NASDAQ:BBBY and are activating the merger.
Check x
edwinbarnesc/status/1791523806449930563

After the upcomming merger gme goes boomyears of mockery will be dealt with :)
The not yet anounced merger is discussed on different platforms, still a hypothesis though.
4d chess, great to be a part of it.
x com edwinbarnesc/status/1791523806449930563
OTC and dark pools wont be sufficient once the first short seller will close their position.
We will discover the real price only then.

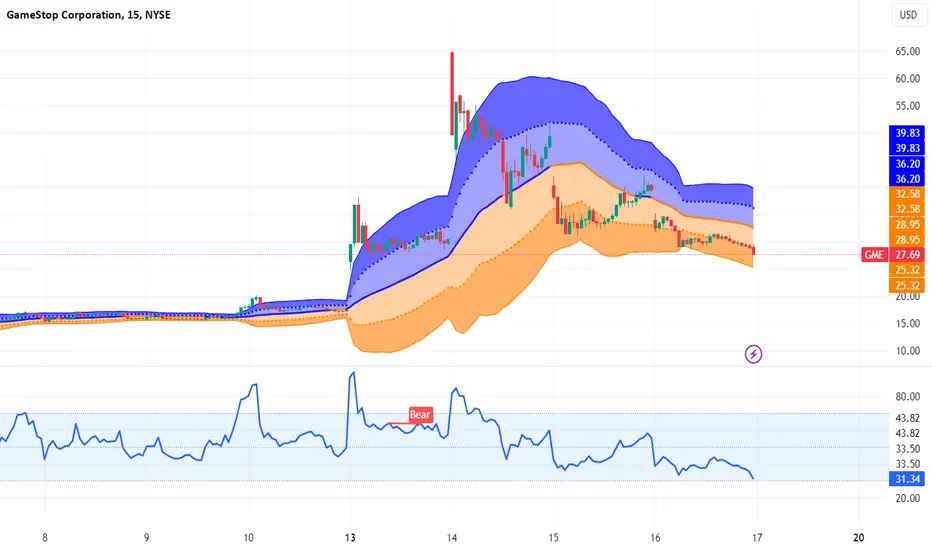
$GME: Where to Next? $100? 🚀Hi everyone,
Here's a quick update on $GME. We started yesterday at $64.74 and dropped sharply to $31.11 but managed to hold the 0.382 Fibonacci level. If GME can break above the 0.236 level at $41.72, we could quickly rise to $64, potentially closing the gap at $74 and even reaching as high as $100+.
Our MTTSA indicator predicts a significant upward movement, as the daily is about to cross the monthly.
Downside targets:
If we lose the 0.382 level, the next target is the 0.5 Fibonacci level.
If the price falls and closes below the hourly on the MTTSA indicator, expect it to seek support at $25.42.
There's also very strong support at the monthly level alongside the 0.618 Fibonacci level.
Conclusion:
GME has been making higher highs and higher lows. As long as it stays above the $31.72 level (0.382 Fib), this uptrend should continue. With the daily set to cross above the monthly, we anticipate a significant rally—similar to the impact seen when the hourly crossed the monthly.

GME: Continues To Hold the Bullish 0.886 Position and 200-SMAThis is a little bit of an update and reminder that GME is still holding above the 0.886 retrace and the 200-month Simple Moving Average with Hidden Bullish Divergence within a Falling Wedge. We've held this level for months and it still appears that it can Bullishly Breakout of the wedge at any time, which should lead to some extreme upside between $60, all the way up to 134.77. But given how long it's been I'd say on a shorter term timeframe basis, just to be safe, $25 would be the first profit taking target.
It is also worth noting that on the monthly GME confirmed a Bullish Morning Star after the test of the 200-Month Moving Average.

#GAMESTOP IS NOT GOING TO STOP!GameStop Corp (#GameStop) video game store chain shares soared by 46% during Monday's trading on the New York Stock Exchange (NYSE), reaching $25 .
The surge didn't stop there, as on Tuesday the price reached up to $60 per share! Wednesday opened with a sudden downward gap, but by the end of the session, the price confidently recovered to $40. What will happen today?
The rollercoaster ride repeats itself with this stock after the sudden return to social media by YouTube streamer Keith Gill, known as Roaring Kitty. He posted a mysterious message on the X service (formerly Twitter), showing that he's always in the know. Gill's post garnered over 8 million views within hours of its late Sunday posting, marking his first post on the account since June 2021.
The surge in stock prices led to a so-called "short squeeze" - a situation where investors betting against the stock and opening short positions are forced to buy stocks as their prices unexpectedly rise, contrary to their expectations. This situation further fueled the rise in shares, which appreciated by hundreds of percent. As a result, funds betting against the company's stocks lost billions of dollars. Giacomo Pierantoni, Head of Data at Vanda Research, stated that the overwhelming majority of demand for shares now comes from retail investors. It seems that, as in January 2021, investors are betting against those shorting GameStop Corp (#GameStop) shares, notes MarketWatch.
GME: History Repeats Itself | 61.54% Potential ReversalGamestop Corp (GME) has been a hot topic in the financial markets, and it seems history might be repeating itself.
After a significant drop, GME has shown signs of a potential reversal, with technical probabilistic indicators are suggesting a bullish trend.
In this trade idea, I will analyze the current market conditions, key levels to watch, and a potential entry and exit strategy for GME.
Key Points:
GME has experienced a considerable decline in recent months, which may be attributed to market volatility and investor sentiment.
My FREE OrderFlow indicator is indicating a bullish trend may be on the horizon.
This probability analysis suggests price rejection at the 0.5 level, which could serve as a potential entry point.
The 30m buyside liquidity level could act as a potential target for short-term target while the 1W buyside liquidity acts as long term target at $120.
Entry:
Wait for confirmation of a bullish reversal, such as a break above the 0.5 Fibonacci retracement level or a strong bullish candle on the 30m chart.
Set a stop-loss order below the recent sellside liquidity on 30m.
Exit:
Consider using a trailing stop-loss to protect profits as the trade progresses.
Risk Management:
Ensure that the trade size is appropriate for your account size and risk tolerance.
Use proper position sizing to manage risk effectively.
Monitor the trade and be prepared to exit if the market conditions change or the trade setup fails.
Please note that this is not financial advice and should be used for educational purposes only. Always conduct your own research and analysis before making any trading decisions.

GMECurrent position: 50 Shares at $31 (small position)
Option premiums are too pricey, so I just bought shares.
Trade Idea May 24 50C $2.15 (very high risk)

Black Gold Judgment Says Huge Challenge Is Just One Step AheadGlobal shares rose while the dollar retreated on Wednesday, after a hot reading of U.S. wholesale inflation set a nervous tone for trading before a consumer price report that could prove decisive about when the Federal Reserve cuts interest rates.
The frenzy in so-called meme stocks entered a third day, with shares in AMC and GameStop soaring by more than 25% at one point in premarket trading before retracing some of those gains.
Price action was more subdued as investors were reluctant to push any market too aggressively one way or another ahead of the monthly U.S. consumer price index later in the day.
The boom has drawn parallels with the meme-stock craze that gripped markets in early 2021, where retail traders, using trading platforms and social media investment advice pumped up the value of stocks that many large investors had bet heavily against.
Technical graph for Brent crude oil says, right here is a similar challenge like in 2021.

GameStop Rises from the BottomAfter enduring a tumultuous three-year period following its all-time high, Gamestop has begun to exhibit promising bullish signs.
The company's recent performance indicates a potential reversal in fortune, and investors are starting to take notice. With renewed optimism surrounding Gamestop, it will be fascinating to observe its progress in the coming months and evaluate whether this momentum can be sustained.
As always, the market is inherently unpredictable, so caution and thorough research are crucial when considering investment opportunities.

GME : Is the GAMESTOP Super Pump OVER?NYSE:GME 🚀 NYSE:AMC
In a single day, GameStop was able to outperform an entire year of BTC.
GameStop stock and AMC shares soared Monday after Keith Gill, who sparked the meme stock rally during the pandemic, made his return to social media for the first time in three years. The New York Stock Exchange temporarily paused trading on GME stock 34 times.
Short sellers are estimated to have lost over SEED_TVCODER77_ETHBTCDATA:5B in tow days.
One thing that is very evident (except for massive whale plays and no doubt insider trading) is the gap that formed around $20-$25. The price is known t return to fill the gap, so I am SHORT until that zone is filled, calling this entire scheme one big pump-and-dump.
AMC will soon fall to pre-pump lows as well, as the price levels fails to hold for even 12h:
Sellers are now dominating lower timeframes and the price continues to fall fast. The price COULD fall or wick as low as the trendline on the technical indicator:
__________________

GameStop Jumps Again - Up 118%GameStop shares recently surged by 118% in two days, coinciding with the return of Keith Gill, known as "Roaring Kitty," who ignited interest with a cryptic social media post.
This event underscores the ongoing challenge that meme stocks like GameStop pose to traditional financial analysis.
Historically, GameStop experienced a massive spike in January 2021, with shares increasing over 2600% due to coordinated buying by retail investors on platforms like Robinhood and social media forums.
Although the stock quickly lost nearly 90% of its value from its peak, showcasing the high risks of such volatile investments, it has shown signs of recovery.
After a period of stagnation, GameStop's stock rose sharply by 75% on Monday and saw early gains of 113% on Tuesday before settling to a 60% increase by the day’s end due to selling pressure.
With the stock's history of dramatic fluctuations, there is potential for surpassing its all-time high of $120, but significant volatility remains, with the $50 mark being a critical resistance level to watch.
If you enjoyed this post, make sure to like, and follow for more quality content!
If you have any questions or comments, comment below. We reply to every comment!
See below for more information on our trading techniques.
As always, keep it simple, keep it Sublime.

The Power of Retail Investors ---- PEPEIn the past two days, the U.S. stock GameStop has experienced another obvious pump again after three years. Roaring Kitty, a representative of retail investors, posted on X after three years of silence. The follow-up of retail investors caused the stock price to rise. At the same time, meme coin GME, Kitty, etc. also had pumps.
Due to its poor performance, GameStop continues to be shorted by large asset management companies, and its value is separated from its business support. Three years ago, financial institutions restricted long positions on GameStop, which caused strong dissatisfaction among retail investors and led to a short squeeze phenomenon. Whether it is from the current value of GamStock or the type of holders, it can be described as a meme stock.
Fair is the biggest consensus of meme coin. This is why this stock market event spread and affected the crypto market. This is the power of retail investors. Meme coins have seen a significant rise in the past two days. In addition to the eponymous tokens GME and KITTY, the highly decentralized PEPE has also seen a significant increase.
We have analyzed PEPE before and gave a BUY signal on February 23 through the TSB indicator, believing that PEPE is about to rise. On May 2, after the TSB indicator once again prompted a BUY signal, PEPE began to rise again. Currently PEPE is refreshing its ATH. We can see the formation of long green candles over the past two days, accompanied by increased trading volume. The bullish trend is healthy.
Introduction to indicators:
Trend Sentinel Barrier (TSB) is a trend indicator, using AI algorithm to calculate the cumulative trading volume of bulls and bears, identify trend direction and opportunities, and calculate short-term average cost in combination with changes of turnover ratio in multi-period trends, so as to grasp the profit from the trend more effectively without being cheated.
KDMM (KD Momentum Matrix) is not only a momentum indicator, but also a short-term indicator. It divides the movement of the candle into long and short term trends, as well as bullish and bearish momentum. It identifies the points where the bullish and bearish momentum increases and weakens, and effectively capture profits.
Disclaimer: Nothing in the script constitutes investment advice. The script objectively expounded the market situation and should not be construed as an offer to sell or an invitation to buy any cryptocurrencies.
Any decisions made based on the information contained in the script are your sole responsibility. Any investments made or to be made shall be with your independent analyses based on your financial situation and objectives.

AMC and GME Gamma Squeeze vs Short Squeeze durationYou are surely wondering how long this rally on GME and AMC could go!
Let's look at the 2021 short / gamma squeezes to find out!
GME rallied from Jan 13 to Jan 28 for 15 days and went up 24X at its peak! That was a gamma squeeze!
AMC, on the other hand, rallied from May 13 to June 2 for 20 days, during which it went up 6X at its peak. That was more of a short squeeze!
A gamma squeeze and a short squeeze are both market phenomena, but they operate in different ways and involve different types of trading strategies.
Short Squeeze:
In a short squeeze, traders who have sold a stock short (i.e., they've borrowed shares and sold them with the intention of buying them back later at a lower price) are forced to buy the stock back at higher prices to cover their positions. This buying pressure drives the stock price even higher, causing more short sellers to cover their positions, thus further increasing the price. It creates a feedback loop where rising prices force short sellers to buy, further increasing demand, and thus prices.
Short squeezes often occur when there's significant negative sentiment or speculation about a stock, and a sudden positive development causes the price to rise sharply, catching short sellers off guard.
Gamma Squeeze:
A gamma squeeze, on the other hand, involves options trading. It occurs when option sellers (who are often large institutional investors or market makers) have sold call options (contracts that give the holder the right to buy a stock at a certain price) and need to hedge their positions by buying the underlying stock. As the stock price rises, they need to buy more stock to maintain their hedge, which further fuels the price increase.
Gamma squeezes are typically triggered by a sharp rise in the underlying stock price, causing the delta (the rate of change of the option price with respect to the price of the underlying asset) of the call options to increase rapidly. This forces option sellers to buy more stock to adjust their hedges, leading to a feedback loop similar to a short squeeze but driven by options trading.
We could be entering a cycle here, let's see!

GMEWhat a lovely market cycle for gamestop . since we have dipped inside the previous structure on a monthly look for the reversal coming up soon.
Time to "I like this stock" again.
Personal short term target is 40$+

[WSB] How to trade the GameStop Short Squeeze!r/wallstreetbets recently picked up the GameStop Stock (GME). Why? Because we basically have free money sitting here.
GameStop struggled with keeping up with the growing digital gaming market and the price plummeted.
With a strong focus on E-commerce, a strong brand with over 55 million PowerUp members and a solid team (Source: r/wallstreetbets "GME FULL STORY),
we will most likely see further growth in the company in terms of revenue and stock price.
I made this chart to verify important levels and an in depth trading-plan to reduce the risk as much as possible.
Everything relevant is on the chart. The Cup & Handle Pattern is one of the easiest patterns to trade and extremly powerfull to extend
a strong uptrend - which is highlighted by the Ascending Parallel Channel.
Please make sure to place a Stop-Loss order and place your buy after the confirmation with a Breakout-Candle.
Let me know if there are any questions and feel free to discuss in the comment section.
cheers

$GME: The Next Big Move You Don't Want To Miss 🚀Hi everyone,
Welcome back to another technical analysis update that has proven effective! Here's a quick recap:
RECAP:
Using our MTTSA/Metric Pro indicators, the price moved above the hourly mark indicating an upward trajectory toward the daily mark, which it successfully reached. After a brief dip to the $10.70 range, it climbed back above the hourly and broke past the daily level. The price then ascended to the weekly resistance, previously unbroken in three attempts, but this time, GME surged through it, reaching a new daily high of $17.43.
CURRENT STATUS:
I believe the options chain is primed for a Gamma Squeeze, marking the beginning of a potential major move toward the monthly resistance at $20.
What is a Gamma Squeeze?
A gamma squeeze occurs when the price of a stock rises sharply as market makers who sold call options must buy more of the stock to hedge against their increasing exposure, thus driving the price even higher.
CURRENT STATUS cont.:
If GME can surpass and sustain above this level, we might witness a squeeze surpassing the one from 2021. Using the Fibonacci sequence from the top of 2021 to the recent low, our targets are: 0.236 ($17.92), 0.382 ($25.79), 0.5 ($34.63), 0.618 ($46.49), and 1.618 ($564.22). GME needs to break past the 0.236 level to progress to the 0.382. Watch for resistance at the 0.5 and 0.618 levels. Additionally, GameStop has broken out of a three-year wedge pattern, which could be significant.
DOWNSIDE SCENARIO:
Should there be a retracement, look for GME to potentially fall back to the weekly level at $14.36.
CONCLUSION:
As always, this isn't financial advice, but prepare yourselves—this could be a monumental ride past the moon, heading straight to Pluto and beyond!

GME Descending triangle breakoutReasons for bullish bias:
- Descending triangle breakout on a weekly
- Entry at LH breakout
Here are the recommended trading levels:
Entry Level(CMP): 28.67
Stop Loss Level: 16.22
Take Profit Level 1: 37.83
Take Profit Level 2: Open

Squeezer $GMEwww.tradingview.com www.tradingview.com
NYSE:GME Squeezer aside It will take time, IF squeezer happens it can fast track this
Ill Update as we go
This could be a much larger Move.
If this is a 5 wave of one this means were in a 1 of 5 impulsive move up to Pre NASDAQ:TSLA split prices
I'm not saying anything
I just like the stock

GME Gamestop Technical Analysis and Trade IdeaHistorically, GME (Gamestop) has been in a downtrend when we look at the monthly time frame. However, recent developments indicate a potential shift in the trend. As we zoom in on shorter time frames (weekly and daily), we observe signs of bullish momentum. Buyers may find opportunities in these time frames.
In a video, we explore a potential trade idea. First, on the 4-hour chart, we notice that the price has retraced into an optimal buy zone. Next, we delve into the 15-minute chart, waiting for specific price action confirmation before getting involved.
Remember that trading carries inherent risks. This information is intended for educational purposes only and should not be considered financial advice. Always manage your risk wisely. 📈👍

GME GameStop Options Ahead of EarningsIf you haven`t sold GME before the previous earnings:
Then analyzing the options chain and the chart patterns of GME GameStop prior to the earnings report this week,
I would consider purchasing the 13.50usd strike price Calls with
an expiration date of 2024-3-28,
for a premium of approximately $1.41.
If these options prove to be profitable prior to the earnings release, I would sell at least half of them.

GME Euphoria time?Analyzing GameStop is always difficult. I have seen the previous reddit pump some years ago, and it was pretty hard to find possible entries and reversal pattern. But this time the chart is giving us some useful info. We can see a break above daily trendline, and the black box a liquidity zone (actually a resistance). The main chart looks bullish, and today's pump can be a signal of a possible round 2. To confirm a bullish trend, we must close a daily candle above the black box, that will eventually help us reaching the top again. If the community will try to repeat the miracle again, this time funds will be prepared and it will not so easy. But, on the other hand, community is stronger now and probably bigger. Let's see
