GME GameStop is close to a Long Swing Starter"The basic idea is, 'we don't care what really goes on at GameStop, or if they have a certain new product or whatever.
We just want to show the market that success is not the reality of production but the enigmatic character of our act,'"
Slavoj Žižek said
Gamestop


TESLA has no resistance until 155, SHORT SQUEEZEIf you look at the VRVP analysis you can see clearly (the yellow) that no buyers filled the gap between 120-155, meaning this was a straight fall shorted by hedge funds. They are trying to fill out their shorts at this 107 price level, it's just a question of time at this point, they can't keep this suppressed with such a large gap, it would initiate momentum to the upside and with no sellers left at that level, it would fly up, margin calling shorts, and only further accelerating the price level to potentially 180.

$GME - Load up Zones $19.5 and $17.xxBe sure to load up responsibly at the correct zones. $19.5 and $17.xx are decent prices to get in. Always save some cash to buy more later at lower prices. Don't go all in at current prices.
I've loaded up on March calls $20c for around 1/4 port value. I'm ready to get more if we dip more at $17.xx will probs get $18c for the same expiration.
Sorry for switching between long and short so erratically but i've got to follow events as they unfold.

GME: CTB on the rise can price go back up to $40?Hey everyone,
As always not financial or sexual advice. That being said, every time the CTB rises drastically there has been a sharp increase to the upside in price.
March 15-24th 2%-22% increase of ~153%
May 19-25th 8%-50% increase of ~64%
July 21-22nd 32%-124% increase of ~ 20%
Dec 19 - Present 8%-27.7% increase of ???
Fibs suggest a downside of $18.40 and $17.61.
Good luck!

Meme Basket Found - AMC CHPT COIN DT F FIVN GME GRAB HOOD LUMNTo add a good approximation of what the current meme basket looks like just copy this and add it as a new symbol.
AMC+CHPT+COIN+DT+F+FIVN+GME+GRAB+HOOD+LUMN
This is the current basket and someone's sold $166 mil worth of spreads ranging between $0.4 up to $6.3 in spread on this basket on the 7'th of Dec and 15'th of Nov. There's around 78 transactions worth $2m each done in quick succession on those dates.
Here's the stocks that are part of this basket:
AMC
CHPT
COIN
DT
F
FIVN
GME
GRAB
HOOD
LUMN
This isn't that good because HOOD is part of the basket and so is AMC (which we all kinda knew). But because HOOD is part of this basket and FTX's was hoarding HOOD shares that may be sold off in the market (hopefully will be sold in a block trade auction instead), if those HOOD shares are sold at market value, they'll tank the whole basket. Regardless, even if sold algorithmically, those HOOD shares are going to have a decently big effect on the basket (Price go down).
This is a weird basket with lots of mixed sectors... All i can say is that there's a falling wedge which indicates that something may start occuring in Feb just in time on Feb 21 for the quarterly meme run. Hopefully the whole market doesn't decide to correct again on that date like it has the past few cycles specifically on that EXACT day out of coincidence...
Found this swap in the DTCC- SEC swap depository online as this is something i've been tracking for a bit over a year now. Since a month ago SWAPS are reported with a lot more and useful information and the full meme basket name is now visible basically.

$GME - Turned Bullish, but what about the rest of the market?GME is looking super good today. Shorts increased their positions by another $25mil which is extremely bullish for GME in terms of making the price increase/run or whatever you want to call it. It looks like the run is happening after all.
You need to however take the rest of the market in consideration before getting too happy.
For the past few cycles, GME has done it's thing into a bearish market. One example was when CPI/FOMC was on the exact same day as a run (twice actually) and the run got crushed. Another example was when AMC gave out it's dividend 1 day before the GME run and 1 day after the GME run was the TSLA split. There were plenty more instances where GME just did it's run into a dying market.
EOD Data
-Looking at the EOD data for GME, as i said things are looking super bullish. A run is going to happen for sure.
-Looking at the rest of the market, i'm not sure what's about to happen e.g i can't tell. If the rest of the market does not die starting tomorrow, the run should be a good one and would touch in my opinion $40 for GME. If the rest of the market starts dying tomorrow onwards, i think GME could make a new low at $17.xx.
Positions: SPY Puts, AMD Puts, Coca Cola Puts.
I could've kept my GME calls but i'm not feeling this one even if the GME data is clearly saying things are bullish. This means #1, i'm a week early and #2 you're all about to get rich. So, good luck. I really hope GME doesn't get pumped whilst the market is dying for whatever random sudden news comes out tomorrow...
TLDR:
-Data says GME go up for sure.
-I'm not feeling it, so i think it's going to $17.xx
Data is almost always right, i'm alost always wrong. Cheers.

$GME - Load up, a lotMy previous target of $19.40 ish is almost there. The biggest loading zone is here. My entire port is now on GME calls.
No PT from here, i only know that $19.4 is an extreme support. If broken by a lot and for more than 1-2 days, god save us all.

Daily Falling wedge on GME has just entered the Discount ZoneLooking at this Falling wedge on the daily, a breakout of this wedge could be substantial and shoot this stock back into the 40s with ease. SI is on the rise as is IV, Also SMC showing GME has just entered the Discount zone and grabbed a pretty big block of liquidity. Prem zone on the Daily is sitting in the $43 dollar range.

$GME - Dec 6 RunIt's simple, just like my previous posts.
This has nothing to do with earnings or fundamentals. It's purely a market mechanic trade.
The delta from expiring/exercised/rolled monthly expiring options from the end of the month will always hit the market on the usually first Tuesday of the next month.
Dec 6 is the date where lots delta will get settled due to last month's expiring options & from Nov 22's failed sucker rally options.
Would rather not over-share the method to this at this point. Just look at my previous posts on $GME and decide for yourself. When bashing for whatever reason at least please keep the language civil in the comments.
At the same time here's a screenshot of something and no explanation what it is or a direction prediction so that i can appear cryptic and smart like others do. imgur.com
Jk imgur.com Dip before the rip on the 6'th probs will be caused by today's CPI thing.
Keep in mind that this even is market wide but it only manifests as 1 sudden big spike on very few stocks. Some of the other stocks i'm analyzing with the method i analyze say that this is the bottom whilst GME says there's another dip spike before the 6'th. I've decided to ignore this dip and i've gone ahead and bought risky options not GME but another stock with a similar but even better setup that i believe will spike even higher than GME on this run. I won't be posting my position in said other stock here not to get inversed by highly regarded folk.
Regardless, there's money to be made on GME.
The safe space is with 9 Dec 24c's (-100% or +200% return)
Mixed Risk is: 9 Dec 24c's & 29c's (-100% or +450% return)
Yolo / LFG: 9 Dec 29c's (-100% or +800% return)
Stay safe. There's mixed signals on the data i'm seeing whether there will be a dip before the rip in the next few days or today. I'm betting there won't be one, but i'm a fool. A good trader would wait for that dip.

GME GameStop Options Ahead Of EarningsLooking at the GME GameStop options chain ahead of earnings , i would buy the $30 strike price Calls with
2023-1-20 expiration date for about
$3.00 premium.
If the options turn out to be profitable Before the earnings release, i would sell at least 50%.
Looking forward to read your opinion about it.

15 Min Symmetrical Triangle on GMEA breakout out of this Symmetrical triangle could drive GME back into the high 30s possibly 40s not to mention witching just around the corner.

GME: Huge Price Action Next Week? $43?Hello,
Welcome back to another TA! First and foremost, I eat crayons every day, and none of this is financial or sexual advice. That being said, the MACD, although a lagging indicator tells us a bigger picture of what is to come. First, the further the signal line is below zero, the stronger the signal once the MACD line crosses from below to above the signal line the more bullish. We're mostly going to talk about the daily timeframe but the weekly is also a telling story.
MACD
So, in the past year, starting in
March (RC buy-in) MACD was way below zero and once it crossed above the stronger uptrend we had a ~122% move up.
May MACD also way below zero and once it crossed over we saw a 77% move up
July MACD had a bullish crossover but we were already above zero so the strength of the uptrend was not as strong 27%
Aug MACD was again above zero and the move up was 33%
Sept MACD crossed over below zero but didn't move up past zero. This resulted in a mere 11% move up.
This takes us to the start of the week, Nov 14th, where we had a bullish crossover that started below zero and has crossed from below to above zero. This means our uptrend strength should be greater than expected.
RSI (Relative Strength Index)
The RSI on Nov 9th started below 50 and has since crossed 50 which indicates the stock is bullish. On the weekly, the RSI is curving up to reclaim the 50 line and once we cross over there we'll see some huge uptrend.
Fibonnaci
Fib retracements show that we'll hit $29.99 (0.618) soon. Coupled with what we know about the MACD and RSI we should see at least $32.19 and if the bull trend is strong, we should see (1.618) $43.08
TL;DRS Everything signals bullish with this stock and we should see huge price action which could potentially take us to $43.

BGFV GME 2.0 MASSIVE SQUEEZE COMING!!!www.reddit.com
Please refer to the reddit post for more info^^^^^
According to iborrowdesk.com There are only 300 shares available to be shorted and on top of that borrow fees have risen to 7.8%.
You know what that means SHORT SQUEEZE

GME Bullish Breakout of WedgeAfter a long few months of trading sideways, and a couple of fake outs, it looks as though GME is holding it's bullish breakout of the wedge that formed the last 3 months.
Looking for a break of the $45-50 ish highs from earlier in the year and to settle in somewhere above that heading into the end of the year / early 2023. I suspect wall street does not want a bunch of retail investors (younger folks) using their Christmas money to lock in large buys at low prices. They won't allow those people to get in at these low levels. Look for one more major drop sometime in February / March when tons of basket swaps expire and to make the Christmas money buyers see some heavy red in their accounts (and a likely large bounce back up once those people are potentially shaken out).
Just for fun, not financial advice. I'm looking to enter 12/2 through 12/30 $25-45 calls and see what happens.

$GME - Nopex Nov 22 2022Publishing this as a correction to my previous post about GME possibly running next week. I checked Friday's EOD data and things don't look terribly good.
More here as i cannot post images to explain this fully on tradingview: www.reddit.com
It makes my heart weak to tell you GME is not gonna do well this opex, but someone's gotta do it.

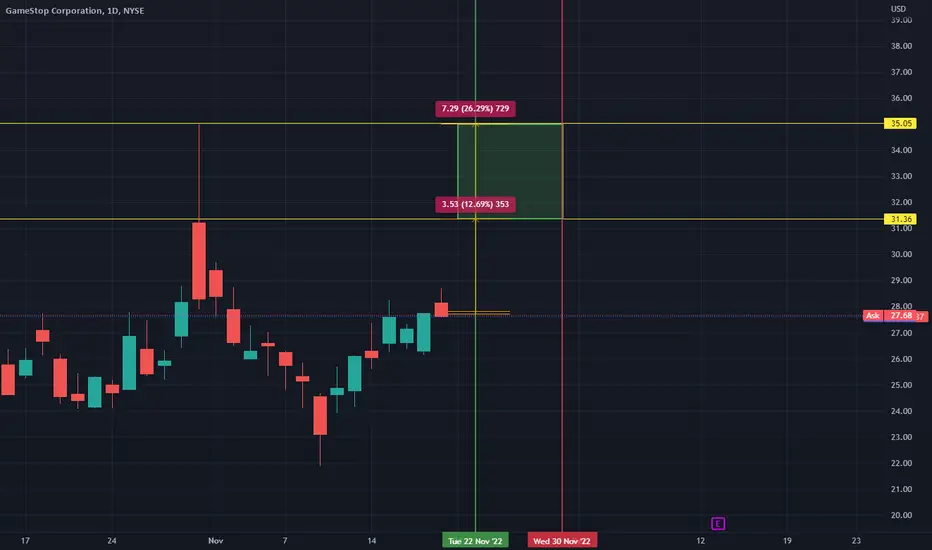
$GME - November 2022 run, keep it shortThe 2022 November quarterly GME run is here.
I'm looking at my indicators to see whether we're gonna have an Opex or Nopex. 2/4 of my indicators tell me that it's a coinflp between an OPEX and a Nopex. Sorry, i know this is not what you wanted to hear, but...
1) Indicator 1 - Swaps (Negative)
Swaps on GME the other peripheral stocks like AMC/BBBY/XRT are minimal as usual... This means that there's no swap based volume support for this rally and that it's possibly all moving just due to dealer hedging for 0 to 1dte options for this big Opex. TLDR: Swaps say there won't be a big move up next week.
2) Indicator 2 - XRT Put OI Drop (Positive)
According to a source who has his own indicator based on XRT's Put OI where if the OI drops on certain dates, it indicates that a run is coming soon... he says that the Put OI drop has occurred and that we're up for a run. This indicator has worked for him 2/3 times so far, so his indicator is positive for this run. We had a previous Nopex where the indicator strongly showed we're due for a run but we instead dumped.
3) Indicator 3 - Market Opex Behavior (Mixed)
There's a certain behavior the market does during Opex which strongly indicates whether it's an Opex or Nopex.
-We dump for the second and third week of the month (Sorta happened)
-Near the end of the third week (this week) there's a magic market recovery on Thursday and or Friday (Happened)
-Vix starts to drop on Friday (Happened)
This indicates extreme confidence for a run next week. It's one of my strongest indicators.
However, in the previous run for August and the one in May, what has started happening is that the entire market is that some big names in the market pump on the first couple of weeks of the month, then they dump and while they're dumping, some of the other less known memes are pumping in the second week. On the third week, GME the main memes run for 2 days indicating something will happen next week, but then as the weekend passes and Monday comes, the market dies and it dies all the way into the next month for 15-20 days.
4) Indicator - 4 MSM Behavior
Basically the current market gives me no choice but to buy a few calls for next week for GME, then i need to see if the MSM will tell us all that the world is ending on Monday with Monkeypox(Where did the marketing team on Monkeypox go btw?) or an ICBM from North Korea or something about inflation suddenly being super serious during the weekend, then it means they want everyone to sell and this we're in for a GME run and price pump. If there's no reports of world ending events, be scared and dump your calls.
5) Indicator 5 - OCC Hedging Loans
The OCC shows how much collateral is being posted for short positions. Basically if there's gonna be pump on Monday, there will also be an increase in the OCC's Hedging Balance for certain stocks. So far the data shows a small trend upwards as of a few days ago, but it is unconfirmed as it's still a really small curve. The big data comes out tomorrow because the OCC data is EOD data for today, and so we'll know then if someone's doing something next week.
6) Indicator 6 - Borrow Fee
The OCC hedging loans & the borrow fee go together. If one increases, the other will increase along with it and this indicates that we'll have a massive pump next week. The borrow fee has increased a little bit but not enough to indicate a run. Also the OCC hedging balance has not increased yet to indicate a run. Again, must wait to see how today develops. The prudent action here is to get calls first, ask later (Chukumba)
Lastly
Keep in mind that if we do run up and not down next Tuesday, the initial spike is usually the biggest e.g it's all downhill after that. If the spike isn't big enough for the day, it means that the run isn't on next weeks' Tuesday, but the week after. You have to adjust your strat accordingly. These cyclical runs behave in a certain way that i've been watching for the past 2 years now. TLDR, i'll update this post with new comments of what's up over the weekend and on Monday to tell you if we're running or not.
Conclusion
I think the market's gonna dump and that we're seeing some pumping today is because of heding requirements for 0 day to expiry options. There will obviously be the usual price pump on SPY and many stocks 15 minutes before close as brokers pre-emptively close people's expiring options which will cause a tiny pump, but i think that's all she sang.
I need to see today's EOD OCC data to be able to say that we'll have an SLD Opex next week and not a Nopex. So far i'm negative for a successful opex, but i have to grab a few calls to be in just in case. Also keep in mind FTX just fell and if it was reaaally being used for locates, then this opex could be insanely good unless they have a temporary stopgap for now.
The reason why i didn't want to mention when the cycle may occur in my last post is because people buying calls on the day of the pump MAY (unconfirmed) cause price suppression due to hedging requirements and may be why our SLD/Opex runs are so weak or inexistent. Alternatively the reason i believe more likely to be the reason for diminished Opex/SLD runs is because of the successful campaing on Reddit to make people not buy options over time. No option buying, no dealer movements, no price movement. Again, equally, it could all be because everyone DOES buy calls & hedging those on the dealer side is what screws us.
Regardless, this last of part in my conclusions is more close to theories and tinfoil than something you should listen to i think (Up to you really). I wish you luck on whatever you decide to do. I'm keeping my long puts on most of the market and some straddles i have on other names like BRK.B & RBLX. For GME i already bought a few calls a few days ago on low IV and i'm hesitant to get more at this point with this IV jackup, but i might grab a couple more... i dunno. You can bet ya that CC sellers will take advantage of this IV and will sell CC's into it... so be careful, don't go nuts on this cycle.
Until next time regards.
Fib Circles show GME at $80!Been playing around with Fib circles on GME and if you mirror it to the original run, it'll knock at previous highs then come back to retest the top of the channel.
$80 by January then back to $30 range in spring-summer 2023.
Then MOASS end of 2023-2024.
Of course, it's a new tool I'm playing around with, but I personally will be considering selling at this range and waiting to see if it consolidates.
Let me know your thoughts

15 min Double top!!!We can see the Confirmation of a 15 min Double top this morning when looking at Gamestop. Also the Relative Strength Index is weighing heavily on the overbought side With the moving average convergence divergence also looking to cross downward. Possible small 2 to 3 dollar dip in the next coming day or days before it starts to make another run back up leading into the last Quadruple witching for the year which will take place on Dec 17, I think we should see GME at new quarterly high about 2 weeks prior to witching and then will fade back off until next quarter in 2023.

GME | GameStop | $GMEVideo breakdown of what looks like a short trade in GameStop...
Time will always tell.
Control risk 1% and 2:1 RR

$GME rare opportunity 👁🗨
*This is not financial advice, so trade at your own risks*
*My team digs deep and finds stocks that are expected to perform well based off multiple confluences*
*Experienced traders understand the uphill battle in timing the market, so instead my team focuses mainly on risk management*
Here @SimplyShowMeTheMoney we strive to educate our traders on the importance of being able to recognize rare occurrences in the market structure on a chart. Today GameStop $GME presented us with a rare opportunity in its structure that my team simply could not ignore. We watched $GME open at 12% and shoot up to around 20% before retracing all gains back down to the negative 1 hour before the final bell. This comes as we enter a busy earnings week with a 2-day fed meeting that begins tomorrow and numerous data reports that could ultimately dictate the direction of the feds and the market.
$GME is no stranger to making headlines. With midterm elections right around the corner we wouldn't be surprised if $GME made a ridiculous move in either direction.
My team was able to secure shares of $GME at $28 while it was red this afternoon. We have an automatic stop loss set at $27 due to the obvious risk factors associated with $GME.
Entry: $28
Stop loss: $27
If you want to see more, please like and follow us @SimplyShowMeTheMoney

WATCH GME AND THE MEME STOCKSHere's my GME chart. Election week has potential to explode.
If you can, a nice buy zone is forming right under $26. I'd say the max upside is $64, but momentum could carry it higher. I'd still recommending exiting at $64 if it were to get that high (unlikely scenario)
Realistically, $25 to $31 seems to be a nice trade window, with the potential to trade the extra upside if it were to keep going.
stop is around $21
I feel this movement will be quick when it happens.

Atlantia SpA (ATL.mi) bullish scenario:The technical figure Triangle can be found in the daily chart in the Italian company Atlantia SpA (ATL.mi). Atlantia SpA (formerly Autostrade) is an Italian holding company active in the infrastructure sector, including motorways, airport infrastructure and transport services. The group manages 9,400 km (5,800 mi) of toll motorways, Fiumicino and Ciampino airports in Italy and the three airstrips of Nice, Cannes-Mandelieu and Saint Tropez in France with more than 60 million passengers a year. It is listed on the Borsa Italiana and is a constituent of the FTSE MIB index. The Triangle broke through the resistance line on 02/11/2022. If the price holds above this level, you can have a possible bullish price movement with a forecast for the next 7 days towards 22.810 EUR. Your stop-loss order, according to experts, should be placed at 22.520 EUR if you decide to enter this position.
Atlantia's long-term investors, Singapore sovereign fund GIC and Italian banking foundation CRT, have tendered their shares in the takeover offer launched by the Benettons and U.S. investment fund Blackstone. CRT and GIC own 4.5% and 8.3%, respectively, in the infrastructure group. Benettons' holding company Edizione controls Atlantia with a 33% stake.
Risk Disclosure: Trading Foreign Exchange (Forex) and Contracts of Difference (CFD's) carries a high level of risk. By registering and signing up, any client affirms their understanding of their own personal accountability for all transactions performed within their account and recognizes the risks associated with trading on such markets and on such sites. Furthermore, one understands that the company carries zero influence over transactions, markets, and trading signals, therefore, cannot be held liable nor guarantee any profits or losses.
