EURUSD: The Market Is Looking Down! Short!
My dear friends,
Today we will analyse EURUSD together☺️
The in-trend continuation seems likely as the current long-term trend appears to be strong, and price is holding below a key level of 1.15850 So a bearish continuation seems plausible, targeting the next low. We should enter on confirmation, and place a stop-loss beyond the recent swing level.
❤️Sending you lots of Love and Hugs❤️
Gann

SILVER: Strong Bullish Sentiment! Long!
My dear friends,
Today we will analyse SILVER together☺️
The market is at an inflection zone and price has now reached an area around 37.873 where previous reversals or breakouts have occurred.And a price reaction that we are seeing on multiple timeframes here could signal the next move down so we can enter on confirmation, and target the next key level of 37.962..Stop-loss is recommended beyond the inflection zone.
❤️Sending you lots of Love and Hugs❤️

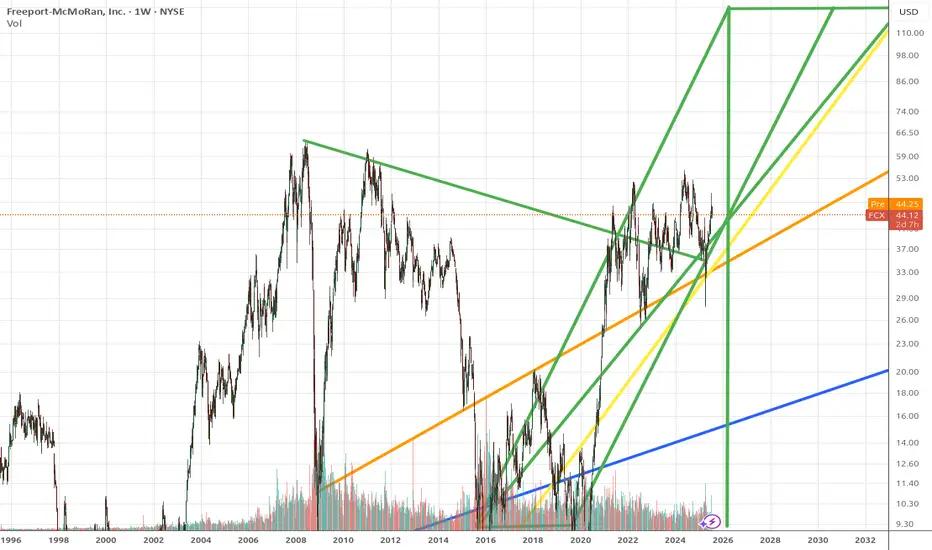
New normal for FCXWhen gold and silver are high and copper is in high demand as well as other metal, FCX goes balistic
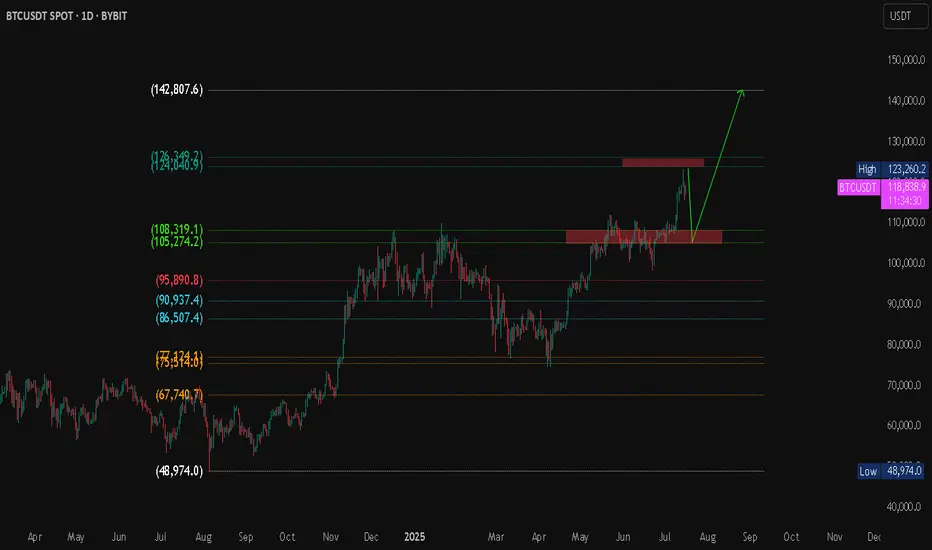
BTC/USDT Technical Analysis Market Overview
Bitcoin is currently trading at $118,788, with an intraday high of $119,311. The market has recently tested a major resistance zone and is showing signs of a potential pullback toward a key demand zone before a possible continuation to higher levels.
Projected Scenario (Bullish Bias)
Expected pullback to the support zone around $105K – $108K.
If price holds and shows a bullish reversal, a breakout above $124K is expected.
Primary upside target: $142,807 (Fibonacci projection / potential new high).
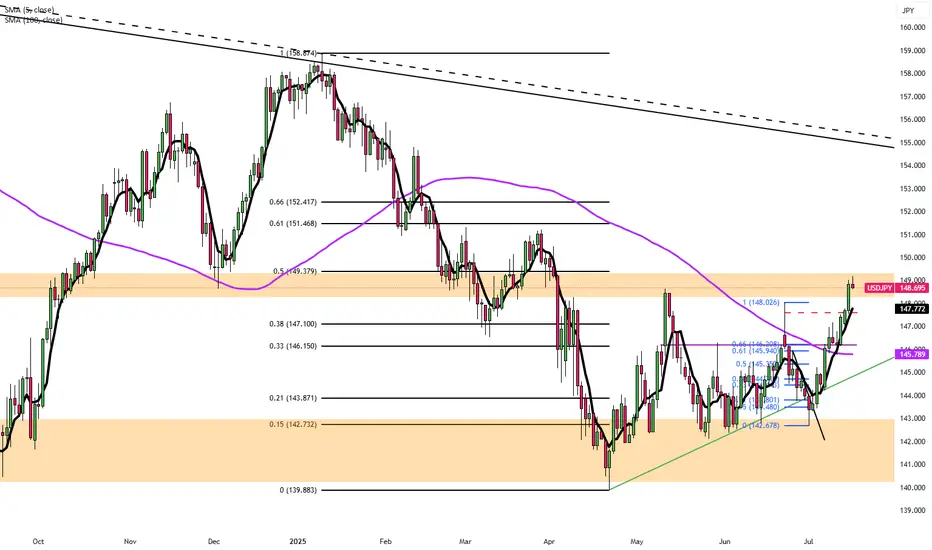
Yen Slips Near 2-Month LowThe yen traded around 147.6 per dollar on Tuesday, close to a two-month low, as market sentiment remained fragile amid lingering trade tensions. The U.S. plans to impose 25% tariffs on Japanese exports starting August 1, but Tokyo hasn’t signaled retaliation. Talks between the two sides have stalled, and Japanese officials warn of potential economic fallout if the measures take effect.
Resistance is at 147.75, with major support at 146.15.
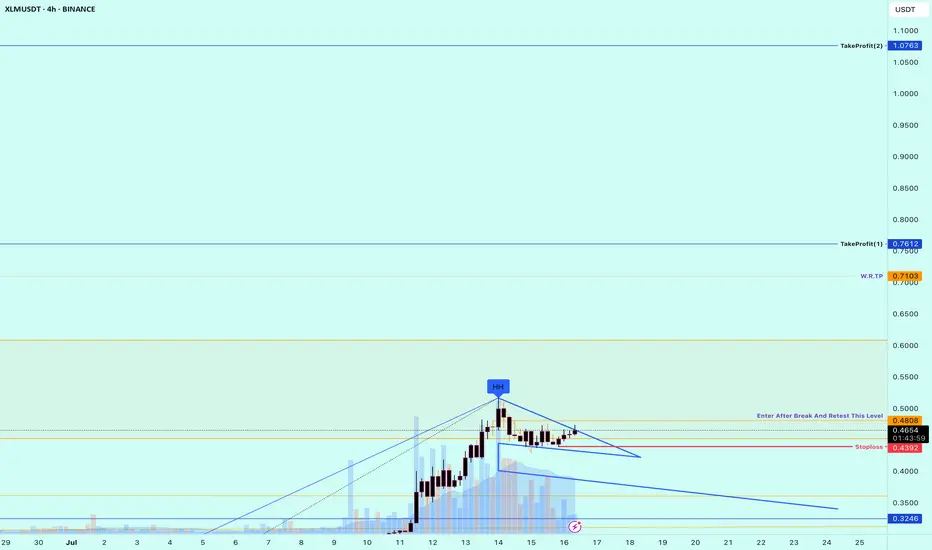
Buy Trade Strategy for XLM: Powering Fast and Inclusive PaymentsDescription:
This trading idea highlights XLM (Stellar Lumens), the native asset of the Stellar network — a blockchain platform built to enable fast, low-cost, and borderless financial transactions. XLM is designed to facilitate cross-border payments and connect financial institutions, payment systems, and individuals, especially in underbanked regions. Backed by the Stellar Development Foundation and partnerships with major global players such as MoneyGram, Stellar is focused on real-world use cases, making XLM a compelling project in the global payments and remittance sector.
With growing institutional interest and real-world utility, XLM stands out as a fundamental player in blockchain-based financial inclusion. However, despite its strong fundamentals, the cryptocurrency market is highly volatile. Factors such as global economic conditions, regulatory changes, and evolving technologies can significantly impact price action and project development.
Disclaimer:
This trading idea is for educational purposes only and does not represent financial advice. Trading cryptocurrencies like XLM involves substantial risk, including the potential for total loss of capital. You should always perform your own research, understand your risk tolerance, and consult a professional financial advisor before making any investment decisions. Past performance is not indicative of future results.
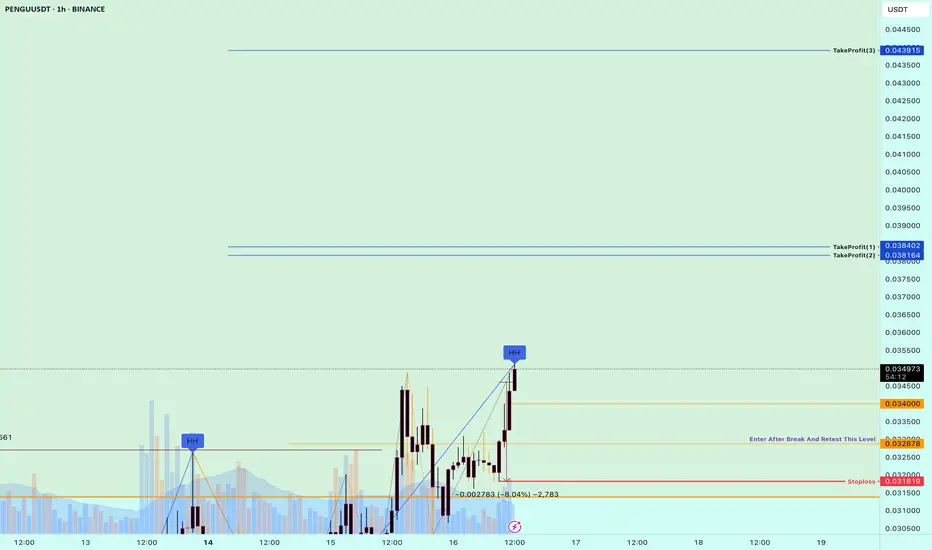
Buy Trade Strategy for PENGU: Tapping Into Meme Culture and UtilDescription:
This trading idea centers on PENGU, a meme-based cryptocurrency that has gained attention not only for its viral appeal but also for its effort to introduce real utility into the meme coin space. Unlike many short-lived meme tokens, PENGU combines strong community engagement with ambitions for ecosystem development, including NFT integrations, staking mechanisms, and cross-platform use cases. Its fast-growing community and increasing social media traction position PENGU as a potential breakout project in the ever-evolving world of digital assets driven by online culture.
Despite its popularity, it’s important to understand that meme tokens like PENGU carry high levels of risk due to their speculative nature and susceptibility to rapid price swings influenced by hype, sentiment, and limited fundamental data. As always, a cautious and informed approach is essential when engaging with these assets.
Disclaimer:
This trading idea is provided for educational purposes only and does not represent financial advice. Meme coins such as PENGU are highly speculative and involve significant risk, including the potential loss of your entire investment. Always conduct your own research, evaluate your financial situation carefully, and consult a licensed financial advisor before making any investment decisions. Past performance does not guarantee future results.
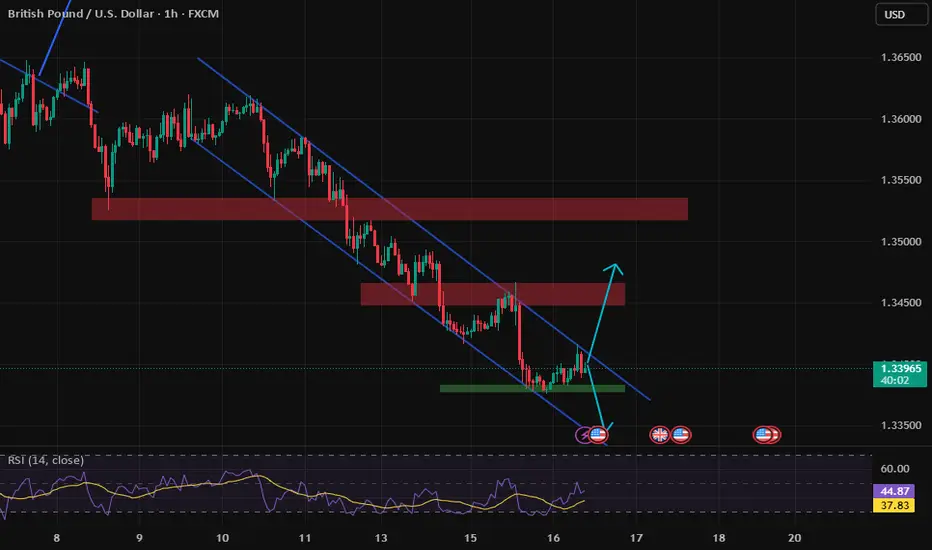
GBPUSD LONG FORECAST Q3 D16 W29 Y25GBPUSD LONG FORECAST Q3 D16 W29 Y25
Welcome back to the watchlist GBPUSD ! Let's go long ! Alignment across all time frames.
Professional Risk Managers👋
Welcome back to another FRGNT chart update📈
Diving into some Forex setups using predominantly higher time frame order blocks alongside confirmation breaks of structure.
Let’s see what price action is telling us today!
💡Here are some trade confluences📝
✅Daily order block
✅1H Order block
✅Intraday breaks of structure
✅4H Order block
📈 Risk Management Principles
🔑 Core Execution Rules
Max 1% risk per trade
Set alerts — let price come to your levels
Minimum 1:2 RR
Focus on process, not outcomes
🧠 Remember, the strategy works — you just need to let it play out.
🧠 FRGNT Insight of the Day
"The market rewards structure and patience — not emotion or urgency."
Execute like a robot. Manage risk like a pro. Let the chart do the talking.
🏁 Final Words from FRGNT
📌 GBPUSD is offering textbook alignment — structure, order flow, and confirmation all check out.
Let’s approach the trade with clarity, conviction, and risk-managed execution.
🔑 Remember, to participate in trading comes always with a degree of risk, therefore as professional risk managers it remains vital that we stick to our risk management plan as well as our trading strategies.
📈The rest, we leave to the balance of probabilities.
💡Fail to plan. Plan to fail.
🏆It has always been that simple.
❤️Good luck with your trading journey, I shall see you at the very top.
🎯Trade consistent, FRGNT X

BTC Bottom & New ATH..... when ?!!! Hello Guys
There are some notes of BTC weekly Chart:
1. We have a new ATH every 4 years ( 1428-1477 ) days..
2. After the ATH we take about ( 52-59 ) weeks to make a new bottom then we go up a little ...
3. Every time we reach a new ATH we drop down in a same angle (-55) before the new bull run starting .... look at my chart ( Red angles and curves ):
****** We dropped from ATH 2013 to Bottom 2015 by an angle ( -55 ) .
****** We dropped from ATH 2017 to Bottom 2018 by an angle ( -55 ) .
****** Same (24 July 2019) we dropped from local top to the local bottom by Angle ( -56 ) .
****** Will we drop from ATH 2021 to Bottom (2022 - 2023) by the same angle ( -55 or -56 )??
4. In my opinion , I expect we will reach the final bottom between ( 26 December 2022 : 6 march 2023 ).
5. I don't care what will be the price of BTC then , but I care only for when will be the possible bottom !!.
But if we can try to expect the price it will be in a range of ( 11900 : 9000$) ...
Note:( 10K - 10500$) is very very strong demand area for BTC .
-------------------------------------------------------------------------------------------------------------------------------------------------------------------------------------------------------
Finally , I think the new ATH will not be before Nov 2025 ( 150k $ ).
It is not a financial advice , I am only share my thoughts with u :)
Thank u and good luck.

Buy Idea: FAUJI FERTILIZER CO LTD (PSX)🔷 Buy Idea: FAUJI FERTILIZER CO LTD (PSX)
Context:
Price tapped into a discount zone, swept liquidity below the recent lows, and formed a strong bullish engulfing candle. The setup aligns with a low resistance liquidity run toward the higher timeframe distribution zone.
✅ Entry Criteria:
Entry: Above the bullish candle close at ~366
Stop Loss: Below the recent swing low at ~323
Target: Monthly resistance / low resistance area at ~435
RR Ratio: ~1:2.5+
📊 Justification:
Liquidity Sweep: Price swept the previous low (creating inducement)
FVG Reaction: Immediate bullish reaction from the demand/FVG zone
Distribution Zone Targeted: Market is likely to grab liquidity from unfilled sell orders in the upper zone
No major resistance till 435 (clean traffic)
⚠️ Risk Notes:
Confirm daily candle closes above 366 before entry
Monitor any reaction at ~390-400 distribution zone

GBP-USDWatch for buy with the breakout of the descending trendline, sell with the breakout of support
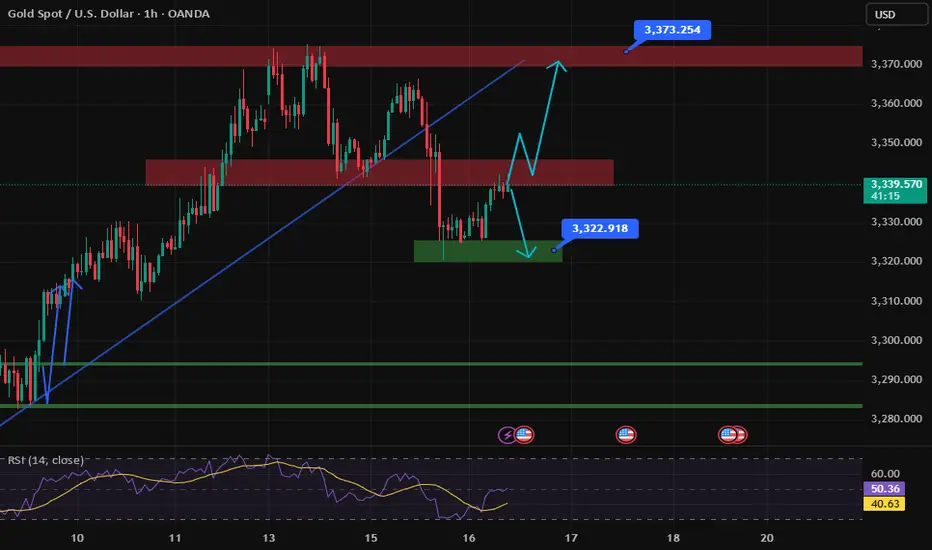
GOLDReached static resistance📉
If it breaks above it can be bought on pullback🕯
If it falls below the resistance, it can be confirmed to sell🔽
us30 to break down us30 to break down
bears to take control - as shown in zigzag manne
swing low broken
volumes drying up
stoploss will be swing high

GBPUSD I Weekly CLS to be completed I Target Key LevelYo Market Warriors ⚔️
GBPUSD is going to complete WCLS, in to the key level. In COT data we see shorts being added which is taking net positions down. Intraday shorts model 0 are possible, Its early to long.
if you’ve been riding with me, you already know:
🎯My system is 100% mechanical. No emotions. No trend lines. No subjective guessing. Just precision, structure, and sniper entries.
🧠 What’s CLS?
It’s the real smart money. The invisible hand behind $7T/day — banks, algos, central players.
📍Model 1:
HTF bias based on the daily and weekly candles closes,
Wait for CLS candle to be created and manipulated. Switch to correct LTF and spot CIOD. Enter and target 50% of the CLS candle.
For high probability include Dealing Ranges, Weekly Profiles and CLS Timing.
Analysis done on the Tradenation Charts
Disclosure: I am part of Trade Nation's Influencer program and receive a monthly fee for using their TradingView charts in my analysis.
Trading is like a sport. If you consistently practice you can learn it.
“Adapt what is useful. Reject whats useless and add whats is specifically yours.”
David Perk aka Dave FX Hunter
💬 Don't hesitate to ask any questions or share your opinions

Bitcoin Analysis – 2W Timeframe
📌 As long as price holds above $113K, the trend remains bullish.
🎯 Next targets:
• T1: $151,635
• T2: $175,596
🔍 Any pullback toward $113K is a buying opportunity in a strong uptrend.

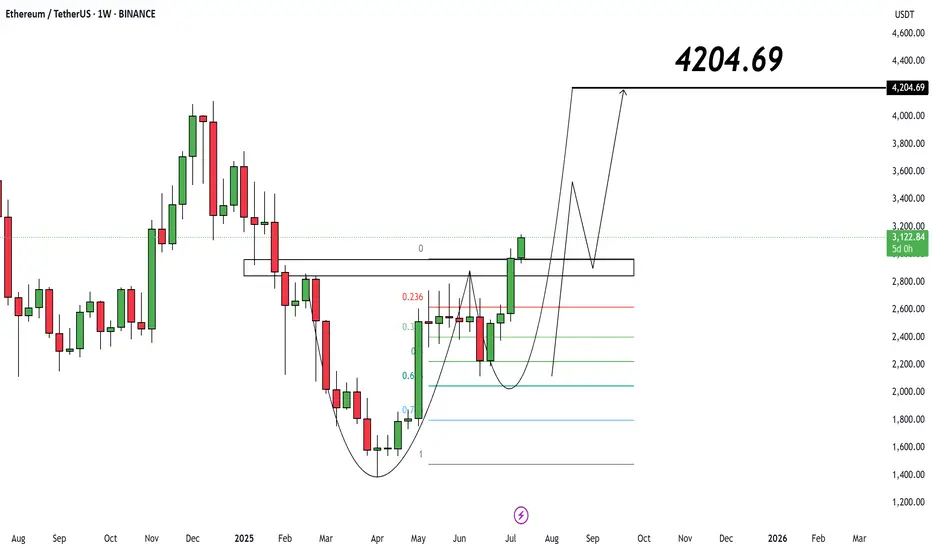
Ethereum ($ETH/USDT) – Weekly Analysis
Current Price: $3,127
📌 As long as ETH holds above $2,950, the bullish structure is intact.
🎯 Target:
• $4,204.69
🔍 Price is building momentum after multi-week consolidation. Pullbacks to $3K are potential re-entry zones.
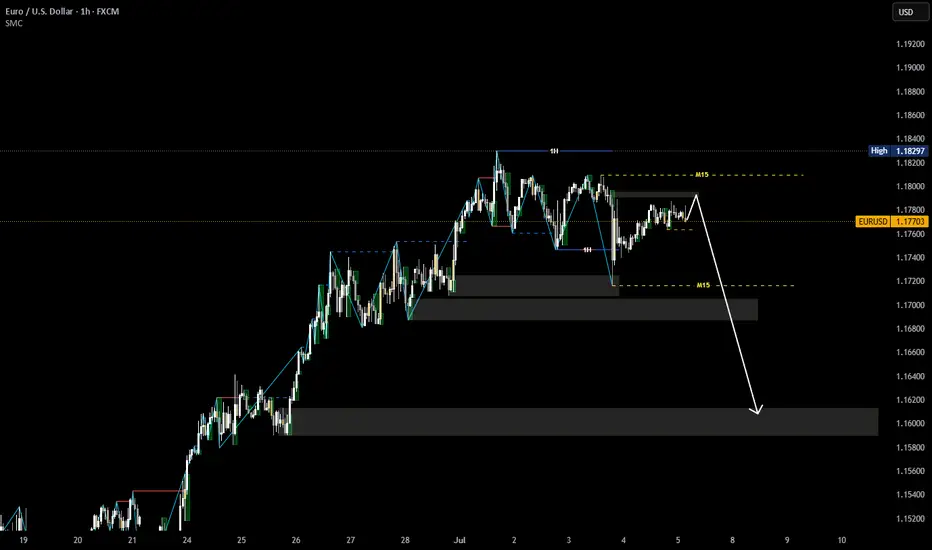
EURUSD structure analysis on M15 and H1- 4H swing is bullish, currently is pullback
- 1H, M15 swing is bearish, current is pullback.
- We can look for selling opportunities according to the wave configuration of H1 and M15 timeframes
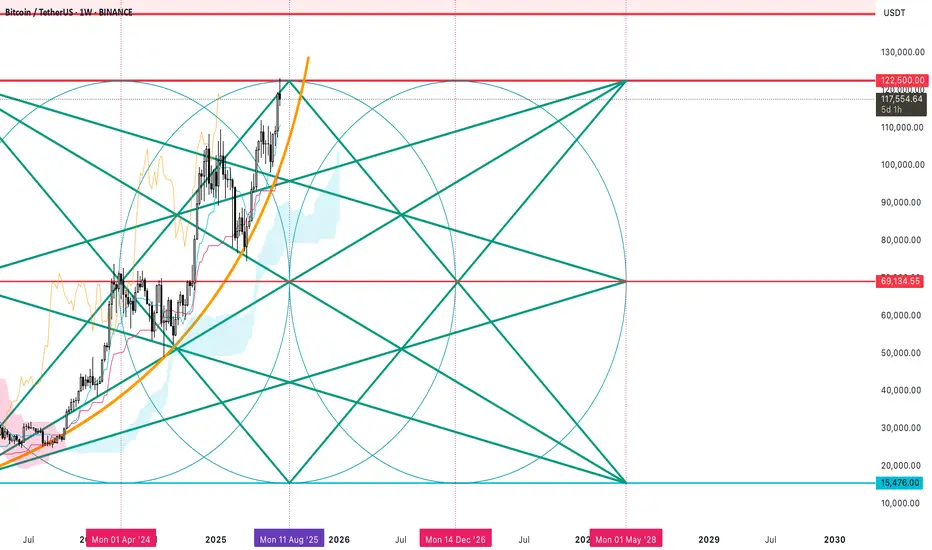
Bitcoin Geometry x IKAGI 2025 - 2028 (Solar Peak)Harmonic angles, and geometry in price and time for Bitcoin.
$122K (Major Level for the system). Potential top
Ethereum is not going up?The impact of the crypto bull run is not trickling down to altcoins, and despite major buying, why Ethereum (ETH) price is not going up?
Read more here: www.cointrust.com
XAUUSDGOLD still on a uptrend in a bigger picture but we can probably have a pull back
We before breaking and closing outside 3400 or 3250 "there is nothing to do"

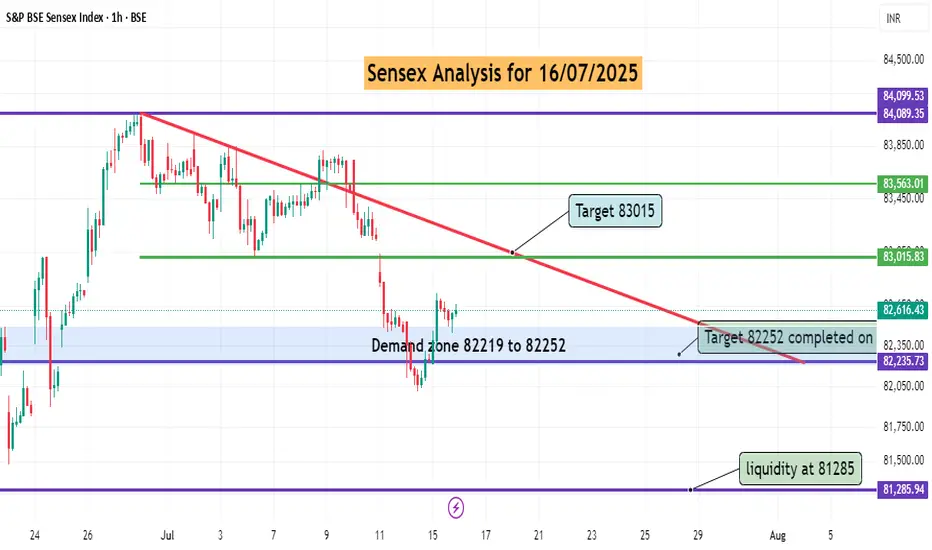
sensex Technical analysis for 16/07/2025sensex got support and sustain on 82200 level today which was demand zone. tomorrow expected to touch 8300 level.
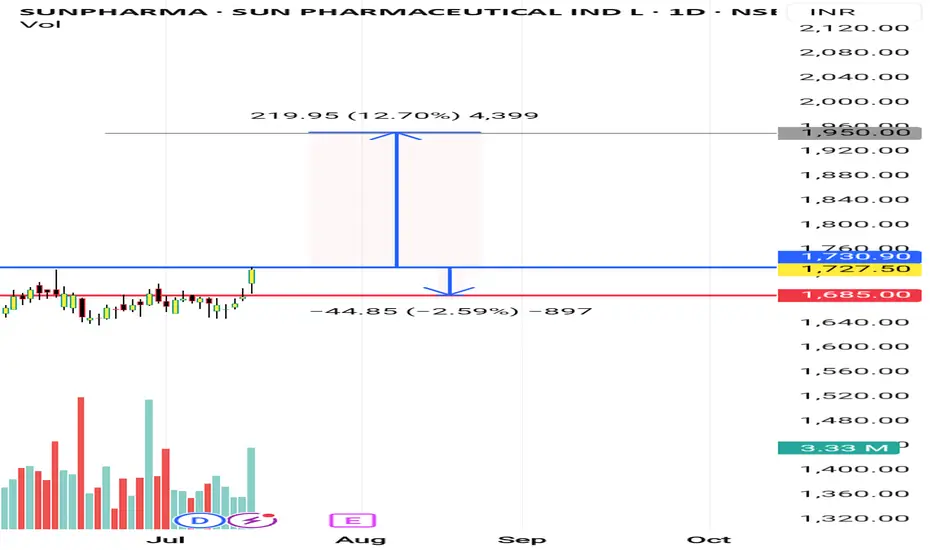
Sunpharma I'm not a SEBI REGISTERED ANYLISIS
just for learning purpose
above the blue line close in D chart candle i will buy and put strictly SL to below red line...once candle close below Red line in D chart...i will close the Trade...
Note: 1
Breakout candle should close time 6 or below 6 points I will buy same day or I will wait for the blue line price to re-trace)
Note:2
If previous volume is buyers(for ex- 10k) Breakout candle volume should be low in present day with buyers volume(below 10k for ex- 9k like this)
target check the chart
WAIT FOR ENTRY......then after
WAIT FOR TARGET...... or
WAIT FOR STOPLOSS
educational purpose only
oits simple ORB WITH VOLUME BREAKOUT STRATEGY...with small condition apply for selecting the stocks
owt not response for your profit and loss
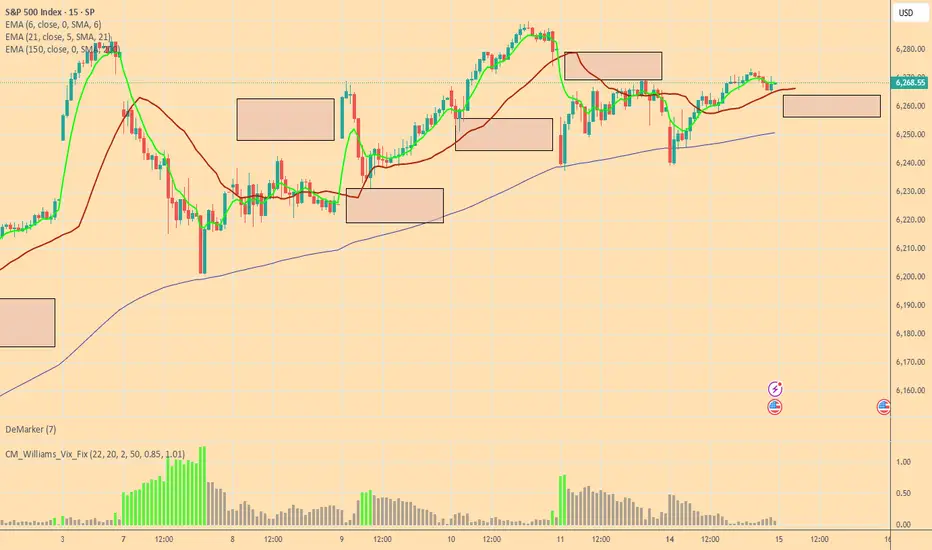
Bulls and Bears zone for 07-15-2025ETH session market is trading higher and expected to Open gap up.
Would traders be able to keep that momentum going rest of the RTH session.
Level to watch: 6328 --- 6330