3M CLS I KL - FVG I Model 2 I Target 50% CLSHey, Market Warriors, here is another outlook on this instrument
If you’ve been following me, you already know every setup you see is built around a CLS Footprint, a Key Level, Liquidity and a specific execution model.
If you haven't followed me yet, start now.
My trading system is completely mechanical — designed to remove emotions, opinions, and impulsive decisions. No messy diagonal lines. No random drawings. Just clarity, structure, and execution.
🧩 What is CLS?
CLS is real smart money — the combined power of major investment banks and central banks moving over 6.5 trillion dollars a day. Understanding their operations is key to markets.
✅ Understanding the behavior of CLS allows you to position yourself with the giants during the market manipulations — leading to buying lows and selling highs - cleaner entries, clearer exits, and consistent profits.
📍 Model 1
is right after the manipulation of the CLS candle when CIOD occurs, and we are targeting 50% of the CLS range. H4 CLS ranges supported by HTF go straight to the opposing range.
"Adapt what is useful, reject what is useless, and add what is specifically your own."
— David Perk aka Dave FX Hunter ⚔️
👍 Hit like if you find this analysis helpful, and don't hesitate to comment with your opinions, charts or any questions.
Gann

Looking for an entry Since the Market just opened they're little opportunities, still have my eyes opened tho


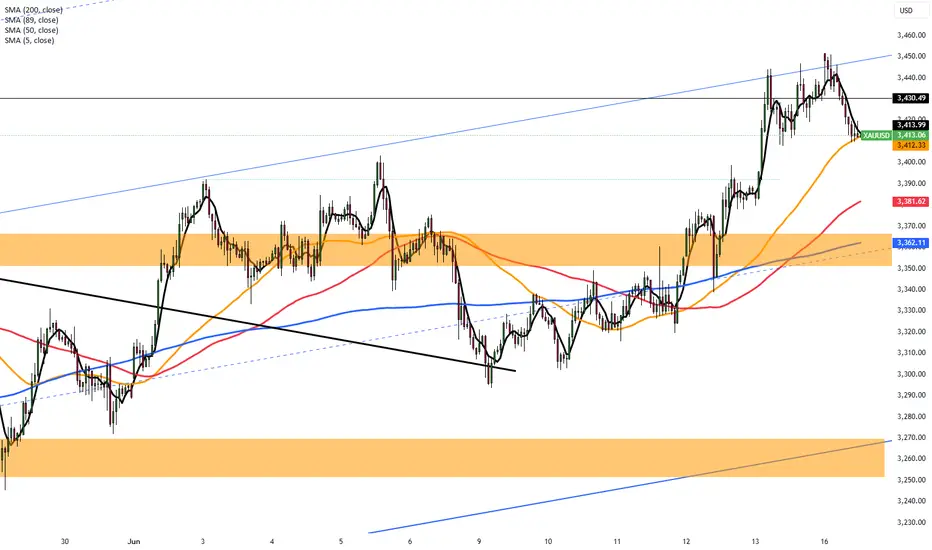
Safe-Haven Demand Lifts Gold Above $3,440Gold rose to around $3,440 per ounce on Monday, staying near April’s record highs, as escalating Middle East tensions increased safe-haven demand. Weekend clashes between Israel and Iran raised fears of broader conflict.
Markets now look ahead to upcoming central bank meetings, especially the U.S. Federal Reserve. While rates are expected to remain unchanged, investors are watching for signals on future cuts. Last week’s weaker inflation data has increased expectations for a potential rate cut by September.
Traders are also awaiting details on President Donald Trump’s upcoming tariff decisions, expected in the coming weeks.
Resistance is seen at $3,430, while support holds at $3,392.
Analysis of gold trend on June 16!
📣Gold information:
Gold prices (XAU/USD) climbed to $3,445 in early Asian trading on Monday, the highest level in more than a month, as rising tensions in the Middle East and expectations of a rate cut by the Federal Reserve boosted demand for safe-haven assets.
Investors remain focused on geopolitical risks despite stronger-than-expected U.S. economic data on Friday. The University of Michigan's consumer confidence index jumped to 60.5 in June, well above market expectations of 53.5 and 52.2 in May. However, the market largely shrugged off the data. Instead, attention turned to the escalating conflict in the Middle East, with Israel's recent attack on Iran fueling concerns about instability in the wider region. In response, Iranian authorities warned that they would "respond firmly to any adventurism," which boosted gold's appeal amid global uncertainty.
⭐️Technical review and analysis: For the current short-term operation of gold, it is recommended to rebound high and go long, with the upward resistance level of 3450-3500 and the downward support level of 3385-3335.
⭐️Set gold price:
🔥Sell gold area: 3465-3475 SL 3485
TP1: $3450
TP2: $3430
🔥Buy gold area: $3390-$3388 SL $3383
TP1: $3400
TP2: $3422

AUDUSD LONG FORECAST Q2 W25 D16 Y25AUDUSD LONG FORECAST Q2 W25 D16 Y25
Professional Risk Managers👋
Welcome back to another FRGNT chart update📈
Diving into some Forex setups using predominantly higher time frame order blocks alongside intraday confirmation & breaks of structure.
Let’s see what price action is telling us today! 🔥
💡Here are some trade confluences📝
✅4H Order block identified
✅1H Order block identified
✅15’ order block
✅Intraday bullish breaks of structure
🔑 Remember, to participate in trading comes always with a degree of risk, therefore as professional risk managers it remains vital that we stick to our risk management plan as well as our trading strategies.
📈The rest, we leave to the balance of probabilities.
💡Fail to plan. Plan to fail.
🏆It has always been that simple.
❤️Good luck with your trading journey, I shall see you at the very top.
🎯Trade consistent, FRGNT X

ETH is doing it AGAIN!Hello TradingView Family / Fellow Traders. This is Richard, also known as theSignalyst.
📈ETH has been overall bullish trading within the flat rising channels marked in blue.
Moreover, the green zone is a strong support zone!
🏹 Thus, the highlighted blue circle is a strong area to look for buy setups as it is the intersection of support and lower blue trendlines acting as non-horizontal support.
📚 As per my trading style:
As #ETH approaches the blue circle zone, I will be looking for bullish reversal setups (like a double bottom pattern, trendline break , and so on...)
📚 Always follow your trading plan regarding entry, risk management, and trade management.
Good luck!
All Strategies Are Good; If Managed Properly!
~Rich

#XAI/USDT#XAI
The price is moving within a descending channel on the 1-hour frame and is expected to break and continue upward.
We have a trend to stabilize above the 100 moving average once again.
We have a downtrend on the RSI indicator, which supports the upward move by breaking it upward.
We have a support area at the lower limit of the channel at 0.0600, acting as strong support from which the price can rebound.
Entry price: 0.0610
First target: 0.0660
Second target: 0.0686
Third target: 0.0722

USDZAR-BUY strategy 2D CHART GANN The pair looks a BUY from a medium-term perspective. we have lower RSI area and also a positive MACD and Fisher form, and others. There are some short-term pressures downside, but overall picture feels we may see movement back towards 18.40s in the medium-term.
Strategy BUY @ 17.7500-17.8150 area and take profit near 18.3750 for now.

#PYTH/USDT#PYTH
The price is moving within a descending channel on the 1-hour frame, adhering well to it, and is heading toward a strong breakout and retest.
We are experiencing a rebound from the lower boundary of the descending channel. This support is at 0.1030.
We have a downtrend on the RSI indicator that is about to be broken and retested, supporting the upward trend.
We are heading toward stability above the 100 moving average.
Entry price: 0.1080
First target: 0.1111
Second target: 0.1140
Third target: 0.1180

EURUSD-SELL strategy 3D chart GANNThe pressure is still upwards, but overall we are close to a reversal considering the ascending triangle, the Hammer Top and overbought RSI. We may still see 1.1650-1.1700 area before the correction, but feel we slowly should scale into a SELL mode.
Strategy SELL @ 1.1625-1.1675 and take profit near 1.1250 area.

Geopolitical Tensions and Economic Uncertainty Impacting GoldFundamental Overview:
U.S. Dollar Impact: XAU/USD is heavily influenced by the U.S. Dollar. A weaker dollar typically boosts gold prices, as gold becomes cheaper for holders of other currencies. Any signs of low interest rates or inflation concerns in the U.S. could further weaken the dollar, providing a bullish scenario for gold.
Interest Rates & Inflation: If U.S. inflation remains high or if the Federal Reserve signals a dovish stance (no rate hikes), XAU/USD is likely to rise as investors turn to gold as a hedge against inflation.
Geopolitical and Economic Risks: Escalating geopolitical tensions or a financial market correction could boost safe-haven demand, pushing XAU/USD higher.

EURJPY LONG FORECAST Q2 W25 D16 Y25EURJPY LONG FORECAST Q2 W25 D16 Y25
Professional Risk Managers👋
Welcome back to another FRGNT chart update📈
Diving into some Forex setups using predominantly higher time frame order blocks alongside confirmation breaks of structure.
Let’s see what price action is telling us today! 👀
💡Here are some trade confluences📝
✅Weekly 50 EMA
✅15' Order block identification
✅Daily Order block rejection
✅4H order block identification
🔑 Remember, to participate in trading comes always with a degree of risk, therefore as professional risk managers it remains vital that we stick to our risk management plan as well as our trading strategies.
📈The rest, we leave to the balance of probabilities.
💡Fail to plan. Plan to fail.
🏆It has always been that simple.
❤️Good luck with your trading journey, I shall see you at the very top.
🎯Trade consistent, FRGNT X

#SOL/USDT#SOL
The price is moving within a descending channel on the 1-hour frame, adhering well to it, and is heading for a strong breakout and retest.
We are experiencing a rebound from the lower boundary of the descending channel. This support is at 142.
We are experiencing a downtrend on the RSI indicator, which is about to break and retest, supporting the upward trend.
We are heading for stability above the 100 moving average.
Entry price: 144
First target: 149
Second target: 153
Third target: 157

EURGBP LONG FORECAST Q2 W25 D16 Y25EURGBP LONG FORECAST Q2 W25 D16 Y25
Professional Risk Managers👋
Welcome back to another FRGNT chart update📈
Diving into some Forex setups using predominantly higher time frame order blocks alongside confirmation breaks of structure.
Let’s see what price action is telling us today! 👀
💡Here are some trade confluences📝
✅Weekly Order block rejection
✅15' Order block to be confirmed
✅4H Order block identification
✅HTF 50 EMA support
🔑 Remember, to participate in trading comes always with a degree of risk, therefore as professional risk managers it remains vital that we stick to our risk management plan as well as our trading strategies.
📈The rest, we leave to the balance of probabilities.
💡Fail to plan. Plan to fail.
🏆It has always been that simple.
❤️Good luck with your trading journey, I shall see you at the very top.
🎯Trade consistent, FRGNT X

GBPUSD SHORT FORECAST Q2 W25 D16 Y25GBPUSD SHORT FORECAST Q2 W25 D16 Y25
Professional Risk Managers👋
Welcome back to another FRGNT chart update📈
Diving into some Forex setups using predominantly higher time frame order blocks alongside confirmation breaks of structure.
Let’s see what price action is telling us today!
💡Here are some trade confluences📝
✅Weekly order block
✅15' order block
✅Intraday 15' break of structure
✅Tokyo ranges to be filled
🔑 Remember, to participate in trading comes always with a degree of risk, therefore as professional risk managers it remains vital that we stick to our risk management plan as well as our trading strategies.
📈The rest, we leave to the balance of probabilities.
💡Fail to plan. Plan to fail.
🏆It has always been that simple.
❤️Good luck with your trading journey, I shall see you at the very top.
🎯Trade consistent, FRGNT X

EURUSD SHORT FORECAST Q2 W25 D16 Y25EURUSD SHORT FORECAST Q2 W25 D16 Y25
Professional Risk Managers👋
Welcome back to another FRGNT chart update📈
Diving into some Forex setups using predominantly higher time frame order blocks alongside confirmation breaks of structure.
Let’s see what price action is telling us today!
💡Here are some trade confluences📝
✅Weekly order block
✅15' order block
✅1 hour order block
✅Tokyo ranges to be filled
🔑 Remember, to participate in trading comes always with a degree of risk, therefore as professional risk managers it remains vital that we stick to our risk management plan as well as our trading strategies.
📈The rest, we leave to the balance of probabilities.
💡Fail to plan. Plan to fail.
🏆It has always been that simple.
❤️Good luck with your trading journey, I shall see you at the very top.
🎯Trade consistent, FRGNT X

GBPJPY SHORT FORECAST Q2 W25 D16 Y25GBPJPY SHORT FORECAST Q2 W25 D16 Y25
Professional Risk Managers👋
Welcome back to another FRGNT chart update📈
Diving into some Forex setups using predominantly higher time frame order blocks alongside confirmation breaks of structure.
Let’s see what price action is telling us today!
💡Here are some trade confluences📝
✅Daily order block
✅15' order block
✅Intraday breaks of structure
✅Daily high rejection
🔑 Remember, to participate in trading comes always with a degree of risk, therefore as professional risk managers it remains vital that we stick to our risk management plan as well as our trading strategies.
📈The rest, we leave to the balance of probabilities.
💡Fail to plan. Plan to fail.
🏆It has always been that simple.
❤️Good luck with your trading journey, I shall see you at the very top.
🎯Trade consistent, FRGNT X

XAUUSD: June 16 Market Analysis and StrategyGold technical analysis
Daily chart resistance 3500, support below 3338
Four-hour chart resistance 3470, support below 3419
One-hour chart resistance 3450, support below 3428-19
Gold news analysis: Last Friday, the further intensification of the geopolitical situation in the Middle East promoted the rise of risk aversion sentiment. Spot gold once broke through $3446, setting a new high in two months. This wave of rise was driven by multiple factors, including the weak inflation data in the United States last week, which further strengthened the market's expectations of the Fed's interest rate cut, thereby increasing the attractiveness of gold. On Monday, gold prices are still likely to continue to benefit from risk aversion and are expected to challenge the 3500 mark in the short term. In addition, this week's market will also be affected by the Fed's resolution and Powell's speech. Investors should pay attention to the potential impact of the Fed's policy trends on gold prices. It is worth noting that US President Trump will visit Canada from June 15 to 17 to attend the G7 Leaders' Summit. The speech during the summit may also cause gold price fluctuations, which needs to be paid attention to.
Gold operation suggestions: From the current trend analysis, the support below focuses on the four-hour support 3419 and the one-hour support 3428. The pressure above focuses on the suppression near the daily level 3500. The short-term long-short strength and weakness watershed 3419 is the first-line barrier. Before the four-hour level does not fall below this position, continue to maintain the rhythm of buying on dips and look to 3500.
Buy: 3419near SL: 3414
Buy: 3428near SL: 3423

The chart you've shared is a 15-minute gold (XAU/USD) CFD tradinThe chart you've shared is a 15-minute gold (XAU/USD) CFD trading chart, and it illustrates a bullish trade setup based on price action and possible harmonic or pattern-based analysis. Here's the breakdown of the idea:
---
📊 Trade Idea Overview:
Asset: Gold (XAU/USD)
Timeframe: 15-minute
Bias: Bullish (Buy/Long Setup)
---
🔍 Technical Details:
Pattern Observed: Possible double bottom or bullish corrective wave structure (Elliott Wave or ABC correction completion).
Entry Point: Around $3,430.40 (market price at time of setup).
Take Profit (TP): ~$3,450.31
Stop Loss (SL): ~$3,420.03
---
📐 Risk-to-Reward (R:R) Ratio:
Approximately 2:1, indicating a favorable reward relative to the risk.
---
📈 Rationale for Bullish Bias:
Price has completed a series of lower highs and lower lows (a corrective phase).
Price has bounced from a key support zone (~$3,429), suggesting buyers are stepping in.
The blue projection arrow indicates an expectation of upward continuation.
Volume is relatively steady with no significant bearish spike, supporting a potential reversal.
---
✅ Confirmation Indicators (Optional Additions):
You may want to look for:
Bullish candlestick patterns at the entry point (e.g., hammer, engulfing).
RSI divergence or bounce from oversold.
MACD crossover or histogram shift.
Trendline break confirmation on lower timeframes.
---
⚠️ Trade Management Tip:
Consider trailing your stop once price reaches halfway to TP.
Watch for reaction at interim resistance levels (e.g., $3,440 area).
---
Would you like me to generate a trade plan or script this into a trading journal format?

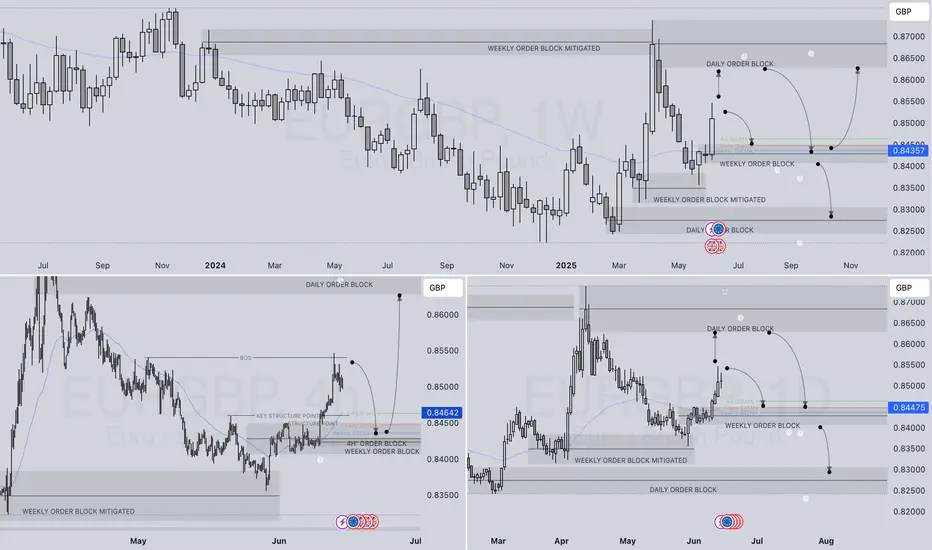
EURGBP WEEKLY HTF FORECAST Q2 W25 Y25EURGBP WEEKLY HTF FORECAST Q2 W25 Y25
Professional Risk Managers👋
Welcome back to another FRGNT chart update📈
Diving into some Forex setups using predominantly higher time frame order blocks alongside confirmation breaks of structure.
🔑 Remember, to participate in trading comes always with a degree of risk, therefore as professional risk managers it remains vital that we stick to our risk management plan as well as our trading strategies.
📈The rest, we leave to the balance of probabilities.
💡Fail to plan. Plan to fail.
🏆It has always been that simple.
❤️Good luck with your trading journey, I shall see you at the very top.
🎯Trade consistent, FRGNT X
EURJPY WEEKLY HTF FORECAST Q2 W25 Y25EURJPY WEEKLY HTF FORECAST Q2 W25 Y25
Professional Risk Managers👋
Welcome back to another FRGNT chart update📈
Diving into some Forex setups using predominantly higher time frame order blocks alongside confirmation breaks of structure.
🔑 Remember, to participate in trading comes always with a degree of risk, therefore as professional risk managers it remains vital that we stick to our risk management plan as well as our trading strategies.
📈The rest, we leave to the balance of probabilities.
💡Fail to plan. Plan to fail.
🏆It has always been that simple.
❤️Good luck with your trading journey, I shall see you at the very top.
🎯Trade consistent, FRGNT X

#BTCUSDTbearish side of the btc is slow, as the volume of sell is not that high...…any strategy doesn't fit the lower low, i am seeing btc to the 132k.
anyone overthere with a new different strategy regarding btc?
