SILVER: Bulls Are Winning! Long!
My dear friends,
Today we will analyse SILVER together☺️
The price is near a wide key level
and the pair is approaching a significant decision level of 36.433 Therefore, a strong bullish reaction here could determine the next move up.We will watch for a confirmation candle, and then target the next key level of 36.547.Recommend Stop-loss is beyond the current level.
❤️Sending you lots of Love and Hugs❤️
Gann

EURUSD: Next Move Is Up! Long!
My dear friends,
Today we will analyse EURUSD together☺️
The recent price action suggests a shift in mid-term momentum. A break above the current local range around 1.17041 will confirm the new direction upwards with the target being the next key level of 1.17163 and a reconvened placement of a stop-loss beyond the range.
❤️Sending you lots of Love and Hugs❤️

GOLD SELL M15 XAU/USD 15-Min Chart Analysis – July 9, 2025
The chart shows that Gold is currently in a bearish structure with multiple Breaks of Structure (BOS) and Change of Character (CHoCH), indicating a potential continuation to the downside.
Current Price: 3,289.710
Resistance Zone: 3,294 – 3,302 (marked in red)
Equal High (EQH): Formed inside the purple supply zone, indicating liquidity above
Supply Zone: Marked in red/purple area
Weak Low: Identified near the 3,284 level
Target Level: 3,279 (marked in blue with “TARGET 3279” tag)
Stop Loss (SL): 3,302 (above the supply zone)
Strategy:
Expecting a minor pullback toward the supply zone (purple area)
Price is likely to reject from this zone and continue bearish
Final bearish target is 3,279, with possible extension if the weak low is broken

XAUUSD: Market analysis and strategy for July 9Gold technical analysis
Daily chart resistance level 3340, support level below 3245
Four-hour chart resistance level 3308, support level below 3264
One-hour chart resistance level 3296, support level below 3275.
The expectation that the Fed will keep interest rates unchanged in July has been widely accepted by the market, mainly because Trump announced that he would increase import tariffs on goods from many countries from August 1, triggering market concerns about rising inflation. This expectation pushed up the US 10-year Treasury yield, supporting the dollar to a two-week high, which put gold under downward pressure. On Tuesday, gold closed sharply lower at the daily level, with ma5 and ma10 running downward, indicating that the bears once again dominated. Today, the price of gold may continue to fall. Pay attention to the support near the lower track 3275. If the price of gold closes the real falling candle again today, it will drive the Bollinger Band opening downward, which will further confirm the downward trend. The market may start a new round of decline in the future. The 4-hour level K line continues to fall, and the Bollinger Band opening expands downward! The short-term key support position below is around 3275. After breaking through, it may fall to the previous low of 3266-3245; the important pressure position is around 3308!
SELL: 3296near
SELL: 3308near
BUY: 3250near

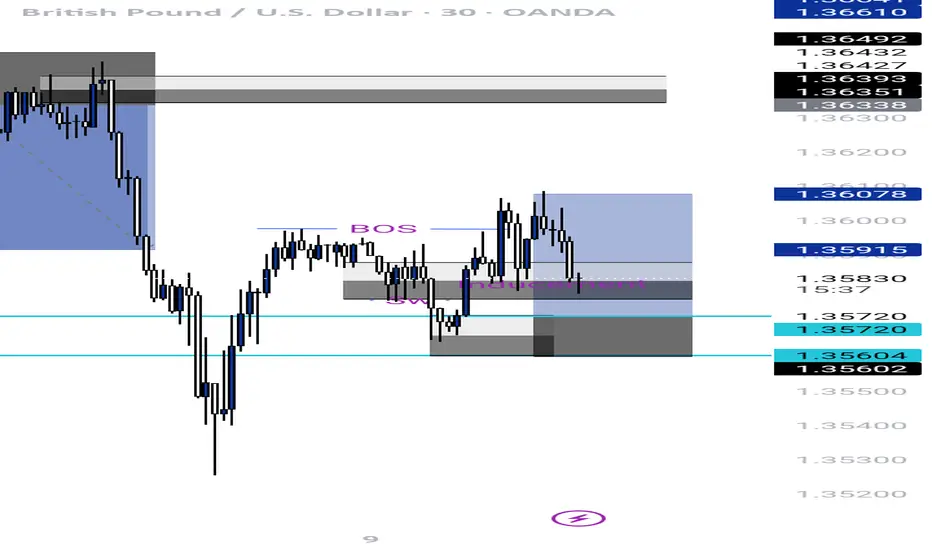
GBPUSD buy setup From my strategy system, the point I mark as my entry,is an order block poi,
From the sence that , price has swept liquidity, and bos and an inducement, so I look to enter from the order block, because the liquidity and the inducement has been mitigated so price next target is to sweep the order block then reverse. Let's go, risk management involved please, just my opinion I am sharing
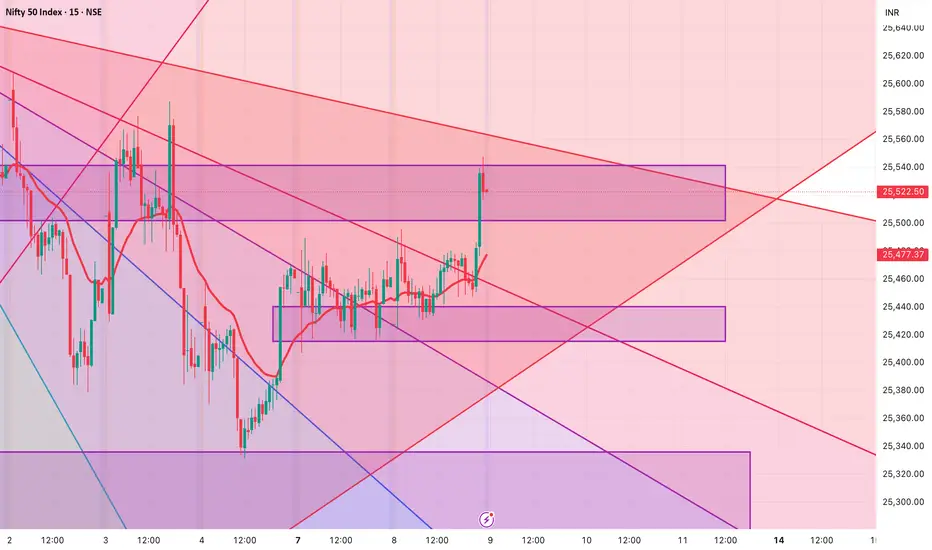
Levels for Nifty tomorrow - 09 July 2025Please watch out for levels in Nifty for 09 July 2025
1. Long once 25542/50 for target of 25580 and second target of 25610.
2. Short only after the strong support zone of 25415 is broken for target of 25370 and second target of 25336.
3. 25523-25440 are the no trade/ sideways zone. However, if a strong rejection candle is formed at either of the zones, they can be traded accordingly.
Please check the trendline (8/1) crossing above. Also monitor the volume in the Futures chart for aggressive targets.
SELL CONTINUATION Price has broken structure twice to the downside creating a protected high at the lower high( below 1.36600). Also price has created a nice looking order block, inducement that closed above a high! Further confirmation tells us that price is also now at the premium level of the swing leg, suggesting a good short set up. Now we wait for price to tap into the order block, a good change of character on the lower time frame will give a nice sell action to the external low!
TRADE CAREFULLY AND RISK WISELY

#FLOKI/USDT#FLOKI
The price is moving within a descending channel on the 1-hour frame and is expected to break and continue upward.
We have a trend to stabilize above the 100 moving average once again.
We have a downtrend on the RSI indicator, which supports the upward move by breaking it upward.
We have a support area at the lower limit of the channel at 0.00007790, acting as strong support from which the price can rebound.
Entry price: 0.00007875
First target: 0.00008000
Second target: 0.00008133
Third target: 0.00008300

Gold fell under pressure, and the watershed is 3321.
⭐️Gold Information:
During the Asian session on Wednesday, gold prices (XAU/USD) continued to be under pressure, falling below the $3,300 mark, hitting the lowest point in more than a week. The decline in gold prices comes as the market generally believes that the Federal Reserve (Fed) will maintain high interest rates for a longer period of time, especially as the market expects that tough U.S. tariffs may exacerbate inflation in the coming months.
Such expectations have pushed up U.S. Treasury yields and stabilized the U.S. dollar (USD) near a two-week high hit on Tuesday - a key resistance for the non-yielding precious metal, which continues to face downward pressure.
⭐️Personal comments:
Gold price fell below support, Dow Jones H1 pattern, gold price fell below 3300
⭐️Set gold price:
🔥Sell gold area: 3344-3446 SL 3351
TP1: $3335
TP2: $3320
TP3: $3302
🔥Buy gold area: $3256-$3254 SL $3249
TP1: $3268
TP2: $3280
TP3: $3298
⭐️Technical analysis:
Set reasonable sell orders based on technical indicators EMA 34, EMA89 and support and resistance areas.

EURUSD-SELL strategy Daily chart Line Brk (2)The pair is under pressure and I feel we may see 1.1535 test in the neat-term. The indicators show negativity and line break shows downward pressure.
Strategy SELL @ 1.1700-11735 and take profit near 1.1567 for now.

USDZAR-BUY strategy Daily chart GANNThe short-term shows some weakness, but some of the models I use, provide support for higher levels. The daily chart shows we may see a move back towards 18.0400 CLOUD area.
Strategy BUY @ 17.7350-17.7650 and take profit @ 18.0250 for now.


XAU/USD Analysis – Expecting Fibonacci Retracement to 0.618 I’m currently anticipating a short-term retracement in XAU/USD towards the 0.618 Fibonacci level around 3323, followed by a continuation of the bearish move targeting a Fair Value Gap (FVG) around 3272.
📌 Technical Confluence:
The market has recently shown a strong bearish impulse, and the current price action appears to be forming a corrective retracement.
The 0.618 retracement level aligns with a key resistance area around 3323, increasing the probability of a bearish reaction from this zone.
There’s a visible FVG left unfilled near 3272, which may act as a price magnet.
I’m also watching for a liquidity sweep above local highs, followed by bearish confirmation on the lower timeframes (e.g., 5min) to trigger a short entry.
📉 Trade Idea:
Looking for a sell entry near 3323 after confirmation (liquidity grab, bearish structure shift, etc.)
Target: 3272 FVG zone
Stop Loss: Just above recent highs or liquidity zone, depending on intraday structure

DAX: Target Is Up! Long!
My dear friends,
Today we will analyse DAX together☺️
The in-trend continuation seems likely as the current long-term trend appears to be strong, and price is holding above a key level of 24,193.11 So a bullish continuation seems plausible, targeting the next high. We should enter on confirmation, and place a stop-loss beyond the recent swing level.
❤️Sending you lots of Love and Hugs❤️

GOLD: Move Up Expected! Long!
My dear friends,
Today we will analyse GOLD together☺️
The market is at an inflection zone and price has now reached an area around 3,298.60 where previous reversals or breakouts have occurred.And a price reaction that we are seeing on multiple timeframes here could signal the next move up so we can enter on confirmation, and target the next key level of 3,312.65.Stop-loss is recommended beyond the inflection zone.
❤️Sending you lots of Love and Hugs❤️

SILVER: Local Bearish Bias! Short!
My dear friends,
Today we will analyse SILVER together☺️
The price is near a wide key level
and the pair is approaching a significant decision level of 36.435 Therefore, a strong bearish reaction here could determine the next move down.We will watch for a confirmation candle, and then target the next key level of 36.336..Recommend Stop-loss is beyond the current level.
❤️Sending you lots of Love and Hugs❤️

EURUSD: Absolute Price Collapse Ahead! Short!
My dear friends,
Today we will analyse EURUSD together☺️
The recent price action suggests a shift in mid-term momentum. A break below the current local range around 1.17083 will confirm the new direction downwards with the target being the next key level of 1.16863.and a reconvened placement of a stop-loss beyond the range.
❤️Sending you lots of Love and Hugs❤️

EURCHF SHORT DAILY FORECAST Q3 D8 W28 Y25EURCHF SHORT DAILY FORECAST Q3 D8 W28 Y25
Professional Risk Managers👋
Welcome back to another FRGNT chart update📈
Diving into some Forex setups using predominantly higher time frame order blocks alongside confirmation breaks of structure.
Let’s see what price action is telling us today! 👀
💡Here are some trade confluences📝
✅Daily Order block identified
✅4H Order Block identified
✅1H Order Block identified
🔑 Remember, to participate in trading comes always with a degree of risk, therefore as professional risk managers it remains vital that we stick to our risk management plan as well as our trading strategies.
📈The rest, we leave to the balance of probabilities.
💡Fail to plan. Plan to fail.
🏆It has always been that simple.
❤️Good luck with your trading journey, I shall see you at the very top.
🎯Trade consistent, FRGNT X

EURGBP SHORT DAILY FORECAST Q3 D8 W28 Y25EURGBP SHORT DAILY FORECAST Q3 D8 W28 Y25
Professional Risk Managers👋
Welcome back to another FRGNT chart update📈
Diving into some Forex setups using predominantly higher time frame order blocks alongside confirmation breaks of structure.
Let’s see what price action is telling us today! 👀
💡Here are some trade confluences📝
✅Daily Order block identified
✅4H Order Block identified
✅1H Order Block identified
🔑 Remember, to participate in trading comes always with a degree of risk, therefore as professional risk managers it remains vital that we stick to our risk management plan as well as our trading strategies.
📈The rest, we leave to the balance of probabilities.
💡Fail to plan. Plan to fail.
🏆It has always been that simple.
❤️Good luck with your trading journey, I shall see you at the very top.
🎯Trade consistent, FRGNT X

GBPCAD LONG FORECAST Q3 D8 W28 Y25GBPCAD LONG FORECAST Q3 D8 W28 Y25
Professional Risk Managers👋
Welcome back to another FRGNT chart update📈
Diving into some Forex setups using predominantly higher time frame order blocks alongside confirmation breaks of structure.
Let’s see what price action is telling us today! 👀
💡Here are some trade confluences📝
✅Daily Order block identified
✅4H Order Block identified
✅1H Order Block identified
🔑 Remember, to participate in trading comes always with a degree of risk, therefore as professional risk managers it remains vital that we stick to our risk management plan as well as our trading strategies.
📈The rest, we leave to the balance of probabilities.
💡Fail to plan. Plan to fail.
🏆It has always been that simple.
❤️Good luck with your trading journey, I shall see you at the very top.
🎯Trade consistent, FRGNT X

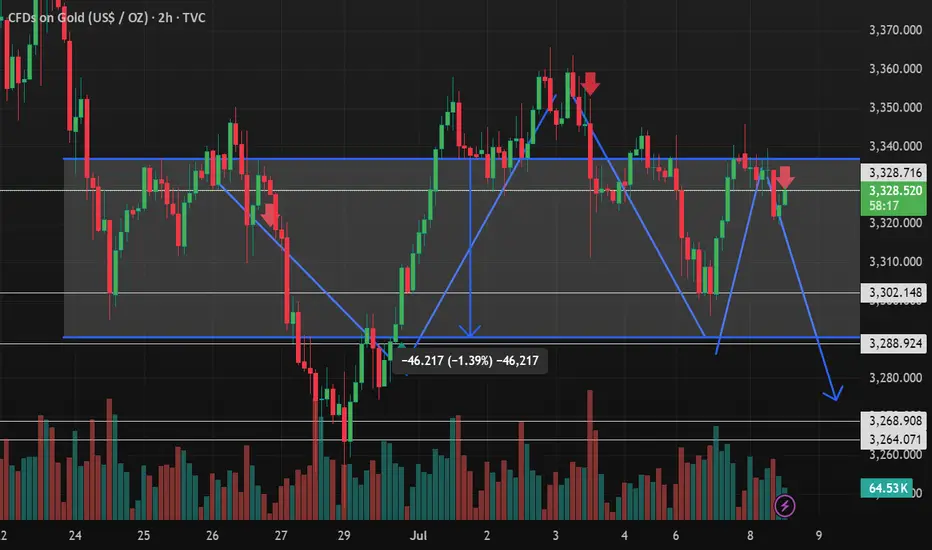
technical analysis chart for Gold (XAUUSD) on a 2-hour timefram technical analysis chart for Gold (XAUUSD) on a 2-hour timeframe using TradingView. Let's break it down and analyze the key insights:
---
📉 Overall Trend
Currently bearish with lower highs and lower lows.
Price is struggling to break above the resistance around $3,340–$3,345.
---
🔍 Key Observations
1. Sell Zone (Red Arrow Marks):
Multiple sell signals shown with red arrows where price rejected the upper resistance levels.
Most recent rejection happened just above $3,328, where price failed to break higher.
2. Support Levels:
Strong support identified around $3,298, tested multiple times.
Next support zone appears near $3,280, shown with a projected downward arrow.
3. Pattern Formation:
A Head and Shoulders pattern may be forming — a bearish reversal signal.
Alternatively, this also looks like a range or a bearish flag in a continuation of the prior downtrend.
4. Volume Analysis:
Noticeable increase in bearish volume on recent candles, supporting the downward movement.
Bullish volume appears weaker in comparison.
---
🔮 Possible Scenario (Bearish Bias)
If the price fails to reclaim and close above $3,328–$3,330, a drop to $3,298 is likely.
If $3,298 breaks with strong volume, next target could be around $3,280 or even lower as marked by the blue arrows.
Measured move from the top to the neckline supports this downside projection.
---
📌 Key Levels to Watch
Type Level
Resistance $3,328 – $3,345
Support $3,298.26
Target $3,280 – $3,264
Entry Signal Below $3,298 with volume
---
✅ Strategy Suggestion
Short Bias: Wait for a breakdown below $3,298 with strong volume confirmation.
Invalidation: If price closes and holds above $3,345, bearish setup fails.
Risk Management: Place stop-loss above $3,345, target $3,280–$3,264.
---
Would you like help setting up a trading plan, or converting this analysis into a Pine Script strategy?
Breakout Triangle // Gann 45° angleRigetti just broke out of the correction triangle. Also the two purple 45! gann angles hint toward an upshift. Pricetarget 1: ~16 USD // Pricetarget 2: ~24 usd // Stoploss just below 12 USD

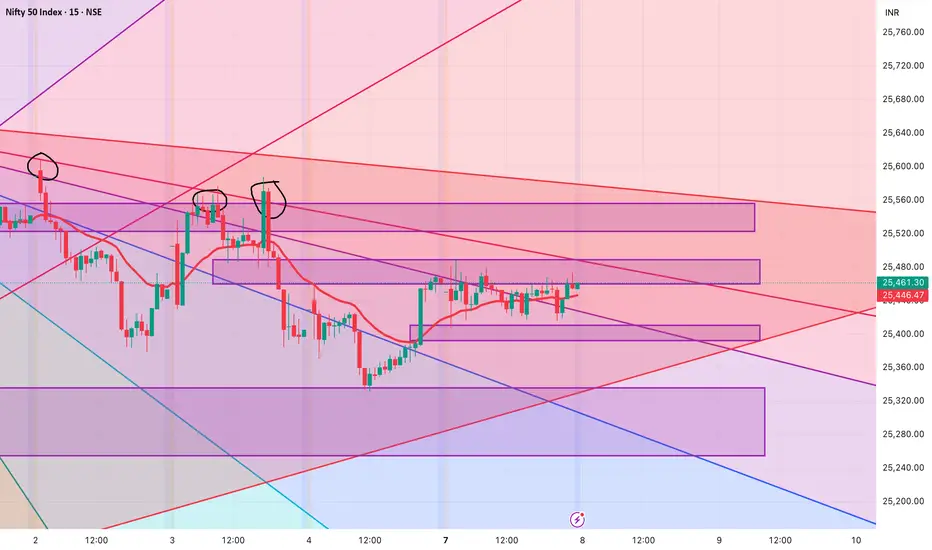
Levels for Nifty tomorrow - 08 July 2025
Please watch out for levels in Nifty for 08 July 2025
1. Long after 25490 for target of 25522 -25555.
2. Short after 25390 for target of 25337 and if this is broken with volume we can look for 25253.
3. 25490-25392 are the no trade/ sideways zone
Also we have see the rejection from the trendline above, so kindly watchout incase of gap-up