COIN- Cup and Handle FormationThere is more to this, but the basic formation is here. Other systems seem to also support the formation (such as Gann, and Harmonics).
There are a few 6 month candles overlaid in the entry to this that I was creating- illustrating the 6 month gains to form the cup. The handle portion did catch me off guard as we are typically use to seeing a cup form at the initial correction, but this one seems to have formed inside of the down move (very interesting).
Lets see how it works out. If true- its 50% gain on the bone here.
Gann

XAUUSD: Market strategy and analysis on June 24Gold technical analysis
Daily chart resistance 3400, support 3286
4-hour chart resistance 3345, support 3304
1-hour chart resistance 3335, support 3315
B2 bombing was carried out over the weekend, the scale of the war expanded, and the ceasefire was directly stopped on Monday. The news is changing at any time. Now the market risk aversion has subsided, and the gold price has fallen rapidly!
The 3400 mark has been under pressure for many times and failed to break through. With the news of the ceasefire agreement, the short-term correction pressure has increased.
Today, gold directly fell below the 3340 support. The loss here means that the shorts will further develop momentum downward. Next, gold will focus on the second highest point of the 1-hour line rebound 3357 as a defense point. If it continues to fall and test the 3300 integer mark, you can try to buy.
SELL:3340near
BUY:3300near

USDCHF LONG FORECAST Q2 W26 D24 Y25 14:00GMTUSDCHF LONG FORECAST Q2 W26 D24 Y25 1400GMT
Professional Risk Managers👋
Welcome back to another FRGNT chart update📈
Diving into some Forex setups using predominantly higher time frame order blocks alongside confirmation breaks of structure.
Let’s see what price action is telling us today!
💡Here are some trade confluences📝
✅Daily order block
✅15' order block
✅Intraday breaks of structure
✅4H Order block
🔑 Remember, to participate in trading comes always with a degree of risk, therefore as professional risk managers it remains vital that we stick to our risk management plan as well as our trading strategies.
📈The rest, we leave to the balance of probabilities.
💡Fail to plan. Plan to fail.
🏆It has always been that simple.
❤️Good luck with your trading journey, I shall see you at the very top.
🎯Trade consistent, FRGNT X

Market’s been slow, but #WIF is setting up beautifully.
Just bounced from the bottom of a falling wedge —
I still believe it’s heading to $4+ in this cycle.
📈 T1: $1.124
📈 T2: $2.676
🎯 T3: $4.135
Loading phase won’t last forever.

Technical Analysis of SOL/USDT (Weekly Chart)
The chart shows a Falling Wedge pattern – a typically bullish reversal formation.
A breakout to the upside from the wedge has occurred, signaling the potential start of an upward trend.
📉 Entry Zone (LONG HERE):
Clearly marked around the Fibonacci support levels:
0.618 (~130 USDT)
0.786 (~115 USDT)
This support zone is strong and ideal for long positions.
📊 Fibonacci Retracement Levels:
0.382 – First resistance
0.5 – Mid-level resistance
0.618 – Strong retracement support that price bounced from
🎯 Target Projections:
204.31 USDT – First target; a strong historical resistance.
229.01 USDT – Second target; a breakout above this would confirm bullish strength.
258.45 USDT – Final target if the bullish momentum continues.

AVAAIUSDT.P – Long Setup at Key Fibonacci Support (61.8–78.6%)AVAAIUSDT.P has pulled back into a strong Fibonacci retracement zone after a sharp bullish impulse. The current zone (61.8%–78.6%) aligns with previous price structure, offering a solid risk-to-reward setup for a long entry.
Monitoring MACD for confirmation of a bullish crossover or histogram shift. Targeting a move back toward the recent high near 0.03050.
#AVAAIUSDT #Bybit #CryptoTrading #FibonacciLevels #LongSetup #CopyTrading #MACD #TechnicalAnalysis #TradeWithConfidence

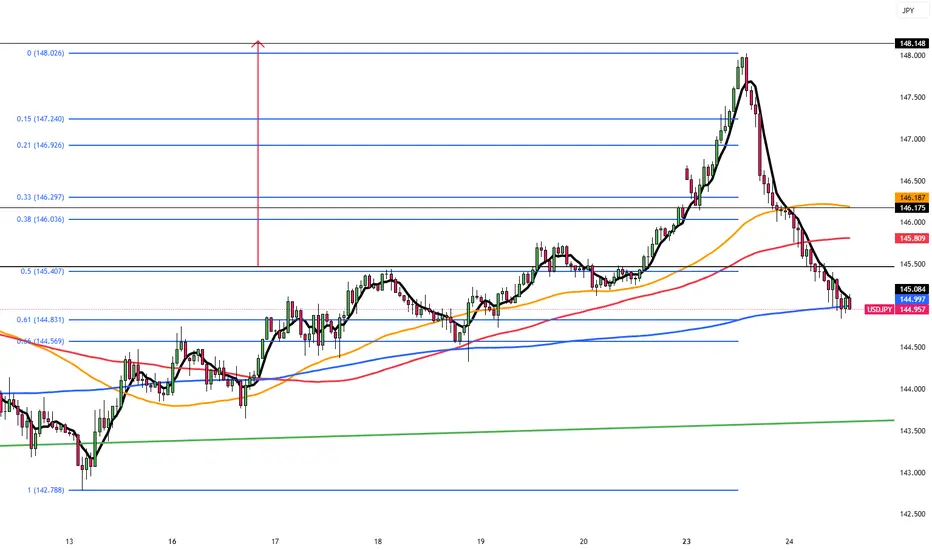
Yen Rebounds as Ceasefire Calms MarketsThe Japanese yen recovered to around 145.5 per dollar on Tuesday, gaining strength after the ceasefire announcement. Although Iran launched missiles at a US base in Qatar, causing no casualties, the gesture was largely seen as symbolic. Tehran’s decision not to target the Strait of Hormuz further eased fears of major disruptions.
The key resistance is at $146.20 while the major support is at $144.85.
Euraud sell alert Trading the trend , saw my break of structure and went down to 5m tf for my confirmation so I met it I am in for a sell let's go

Lion One Metals, Just in production 4000 oz/quarter SOLID 2.00Lion One Metals, Just in production 4000 oz/quarter SOLID 2.00
Solid target from 0.3 to 2 !

June 23 Bitcoin Bybit chart analysisHello
This is Bitcoin Guide.
If you "follow"
You can receive real-time movement paths and comment notifications on major sections.
If my analysis was helpful,
Please click the booster button at the bottom.
This is the Bitcoin 30-minute chart.
The Nasdaq seems to be rising without any problems,
but Bitcoin is under pressure from the MACD dead cross on the weekly chart as it has been adjusted strongly over the weekend.
Depending on the real-time situation, it seems advantageous to operate safely
short-term trading or both-way trading this week.
I created today's strategy based on the Nasdaq movement and the Tether dominance pattern.
*One-way long position strategy when the red finger moves
1. $100,587.9 long position entry section / hand drop when the purple support line is broken
2. $103,953.8 long position target price / Good 2nd target price thereafter
From the purple support line breakout, the weekly chart
candle low point created this week is broken, so it is better to maintain it without breaking out from the long position position.
If it breaks out, it can be pushed to the bottom -> 2nd section.
The 1st section marked in the middle
If it doesn't come down to the long entry point today
It is a vertical rise section
And the pink finger in the middle indicates the short-term target price -> additional long entry section
And the Gap8 section was created at the top due to last week's movement
I think it would be good to refer to it while trading.
Up to this point, I ask that you simply use my analysis for reference and use
I hope that you operate safely with principle trading and stop loss prices.
Thank you.

Diametric Pattern - Riding the current G-wave- Riding the G-wave - hoping it to tend to be nearly equal to A-wave
- 90* Gann acting as resistance
- 270* Gann as supports

Forex Market: Myth or Strategy? — Analysis by Valtrix GroupEvery year in June, forex traders pay close attention to historical price movements, hoping to identify recurring seasonal patterns. But does June really offer a strategic edge, or is it a marketing myth and an overrated idea?
At Valtrix Group, we view seasonality as a secondary but useful filter — especially during periods of low volatility and a lack of macroeconomic catalysts.
What Does History Tell Us?
Historical data on major currency pairs (EUR/USD, USD/JPY, GBP/USD) shows that June often exhibits:
A rise in volatility in the first half of the month — driven by inflation data releases (U.S., EU);
Moderate strengthening of the U.S. dollar, particularly between the FOMC meeting and the quarterly earnings season;
In some years — flat movements caused by low liquidity ahead of the summer holiday season.
However, long-term statistics are mixed. For example, from 2013 to 2023, EUR/USD rose in June in 6 out of 10 years and declined in 4, showing no strong directional bias.
Why Seasonality Doesn’t Always Work
The forex market is driven not only by technicals and statistics but also by macroeconomics, geopolitics, and monetary policy. When major events occur in June (Fed meetings, crises, elections), seasonal patterns can easily be disrupted.
Moreover, algorithmic trading and arbitrage strategies reduce the likelihood of consistent price movements repeating year after year.

Why ETH Is Regaining Investor Focus — Lexenvide OverviewAfter several months of relative stagnation, Ethereum (ETH) has returned to the spotlight for both institutional and retail investors. Since the beginning of June, ETH has strengthened by more than 15%, breaking through key resistance levels and showing signs of renewed momentum.
At Lexenvide, we view ETH’s rise not as a short-term speculation, but as the result of a combination of fundamental drivers, improved technical structure, and growing expectations around infrastructure upgrades.
What’s Driving Renewed Interest in ETH?
Approval of Ethereum ETF in the U.S.
The SEC’s decision to approve a spot Ethereum ETF (expected this summer) has been a key catalyst for renewed interest. Similar to the Bitcoin ETF, it opens the door for institutional capital — including pension and index funds — to enter the Ethereum ecosystem.
Rising Activity in DeFi and Staking
Following the Dencun upgrade in March, network fees have dropped, sparking renewed activity in DeFi protocols, particularly in L2 solutions like Arbitrum and Optimism. At the same time, staking volumes are rising: according to Beacon Chain data, the share of staked ETH is approaching 27%.
Strengthening Market Structure
Amid moderate volatility, ETH is increasingly being seen as the “second digital gold,” especially in the context of a shaky stock market. Token supply reduction via burning (EIP-1559) is also adding upward pressure on price.
AUDJPY SHORT FORECAST Q2 W26 D24 Y25AUDJPY SHORT FORECAST Q2 W26 D24 Y25
Professional Risk Managers👋
Welcome back to another FRGNT chart update📈
Diving into some Forex setups using predominantly higher time frame order blocks alongside confirmation breaks of structure.
Let’s see what price action is telling us today! 👀
💡Here are some trade confluences📝
✅Weekly Order Block Identified
✅Daily Order block identified
✅4H Order Block identified
✅15' Order block identified
🔑 Remember, to participate in trading comes always with a degree of risk, therefore as professional risk managers it remains vital that we stick to our risk management plan as well as our trading strategies.
📈The rest, we leave to the balance of probabilities.
💡Fail to plan. Plan to fail.
🏆It has always been that simple.
❤️Good luck with your trading journey, I shall see you at the very top.
🎯Trade consistent, FRGNT X

AUDUSD SHORT FORECAST Q2 W26 D24 Y25AUDUSD SHORT FORECAST Q2 W26 D24 Y25
Professional Risk Managers👋
Welcome back to another FRGNT chart update📈
Diving into some Forex setups using predominantly higher time frame order blocks alongside confirmation breaks of structure.
Let’s see what price action is telling us today!
💡Here are some trade confluences📝
✅Daily order block
✅1H Order block
✅Intraday breaks of structure
✅4H Order block
🔑 Remember, to participate in trading comes always with a degree of risk, therefore as professional risk managers it remains vital that we stick to our risk management plan as well as our trading strategies.
📈The rest, we leave to the balance of probabilities.
💡Fail to plan. Plan to fail.
🏆It has always been that simple.
❤️Good luck with your trading journey, I shall see you at the very top.
🎯Trade consistent, FRGNT X

GBPUSD SHORT FORECAST Q2 W26 D24 Y25GBPUSD SHORT FORECAST Q2 W26 D24 Y25
Professional Risk Managers👋
Welcome back to another FRGNT chart update📈
Diving into some Forex setups using predominantly higher time frame order blocks alongside confirmation breaks of structure.
Let’s see what price action is telling us today!
💡Here are some trade confluences📝
✅Daily order block
✅1H Order block
✅Intraday breaks of structure
✅4H Order block
🔑 Remember, to participate in trading comes always with a degree of risk, therefore as professional risk managers it remains vital that we stick to our risk management plan as well as our trading strategies.
📈The rest, we leave to the balance of probabilities.
💡Fail to plan. Plan to fail.
🏆It has always been that simple.
❤️Good luck with your trading journey, I shall see you at the very top.
🎯Trade consistent, FRGNT X

EURUSD SHORT FORECAST Q2 W26 D24 Y25EURUSD SHORT FORECAST Q2 W26 D24 Y25
Professional Risk Managers👋
Welcome back to another FRGNT chart update📈
Diving into some Forex setups using predominantly higher time frame order blocks alongside confirmation breaks of structure.
Let’s see what price action is telling us today!
💡Here are some trade confluences📝
✅Daily order block
✅15' order block
✅Intraday breaks of structure
✅4H Order block
🔑 Remember, to participate in trading comes always with a degree of risk, therefore as professional risk managers it remains vital that we stick to our risk management plan as well as our trading strategies.
📈The rest, we leave to the balance of probabilities.
💡Fail to plan. Plan to fail.
🏆It has always been that simple.
❤️Good luck with your trading journey, I shall see you at the very top.
🎯Trade consistent, FRGNT X

Important support level for gold price: 3305-3315Important support level for gold price: 3305-3315
Most people in the market were originally bullish. After all, the US sneak attack on Iran did cause tension, but the market unexpectedly weakened and fell.
Intraday trading:
The macro shock structure is shown in Figure 4h:
Focus on the fluctuations in the range of 3300-3400 US dollars.
From the hourly line observation: the gold price may currently enter the flag adjustment stage.
Short-term resistance is: 3368, followed by the high point of 3393, and the overall trend is still facing short-selling pressure.
Due to the recent large fluctuations in gold prices, market sentiment will not subside quickly.
It is necessary to pay attention to whether it can stand on the first key position of 3368 today.
After a short-term rapid decline, it is not advisable to directly chase short positions and increase positions, and it is necessary to wait and see appropriately.
Although yesterday's trading was difficult, the current market has sent a clear signal:
The callback is an opportunity to continue shorting!
Today's gold operation strategy recommends shorting at high levels and long at low levels.
Upper pressure range: 3368-3388;
Lower support range: 3330-3300;
If it falls below $3350, it may fall to $3300.
Low price long range: 3305-3315, stop loss range: 3300-3295
High price short range: 3368-3380, stop loss range: 3388-3395

EURUSD I Monthly CLS I KL -MOB I Model 1Hey, Market Warriors, here is another outlook on this instrument
If you’ve been following me, you already know every setup you see is built around a CLS Footprint, a Key Level, Liquidity and a specific execution model.
If you haven't followed me yet, start now.
My trading system is completely mechanical — designed to remove emotions, opinions, and impulsive decisions. No messy diagonal lines. No random drawings. Just clarity, structure, and execution.
🧩 What is CLS?
CLS is real smart money — the combined power of major investment banks and central banks moving over 6.5 trillion dollars a day. Understanding their operations is key to markets.
✅ Understanding the behavior of CLS allows you to position yourself with the giants during the market manipulations — leading to buying lows and selling highs - cleaner entries, clearer exits, and consistent profits.
📍 Model 1
is right after the manipulation of the CLS candle when CIOD occurs, and we are targeting 50% of the CLS range. H4 CLS ranges supported by HTF go straight to the opposing range.
"Adapt what is useful, reject what is useless, and add what is specifically your own."
— David Perk aka Dave FX Hunter ⚔️
👍 Hit like if you find this analysis helpful, and don't hesitate to comment with your opinions, charts or any questions.

BTC is breaking out of a falling channel 🚀
Bitcoin has pushed strongly off the lower boundary and is approaching the top of a descending parallel channel on the daily chart 📈
A confirmed breakout could lead to a continuation rally toward key upside targets ✈️
🎯 Targets:
1️⃣ $111,233.01
2️⃣ $114,942.31
3️⃣ $118,490.33

Euphoria in the air! But, will it get us there?
-liquidity pools at white lines
-triangle formation atop fast move up
-gan fan from recent move and one dating back to Nov '22 coincide
-lost support of 50ma on 12h tf
conclusion: before any significant move upward,
i think that bitcoin will first reclaim liquidity around
the 97,700-99,988k zone. if support lost there, next zone below would be ~90,225k. this could either be a deswelling of momentum into a further drop, or a compression event, indicative of a rapid, significant move, possibly beyond current ATH ranging up to 181,678 thousand dollars or there abouts.
Im building a position broken up into many parts to wait out this long grind we have ahead of us.

BTCUSD This setup assumes institutional players:
Induce retail breakout trades at highs
Spike price slightly above the zone (stop raid)
Then dump into downside imbalance/liquidity
We’re riding that wave, not chasing price.
DYOR.

Trump Coin Bullish Setup!Trump Coin is showing some promising signs, currently around $8.50. I see potential for it to reach $20. As always, make sure to use stop-loss orders and manage your risk carefully.
