XAUUSDHigh Reisk Trade Short Planned
SL
TP
EP
Risk managment defined (risk free trade means move SL To ENtry)
Gann

Bullish case forming but is it sustainableFollowing the Vumanchu Cipher B Divergence at the bottom of my chart: every golden dot has been followed by a pump to where the last drop happened. From there on we saw a drop to form a lower low and work our way through to the previous top.
This could likely be the move that brings us to that famous 3 400 level a lot of have been wanting to at least close to continue towards a downward trend and for bulls to form a stronger support around 3 333- 3 310.
The fan fib resistance 0 towards the bearish case has been put on the 2nd lower high on that 45 minutes timeframe to create a middle balance for shorter term analysis/scalping. Same thing for the fan fib showing rebound levels for the bulls has been targeted at the 2nd high of the same time frame.
The elliot waves showed on the chart are for potential price action speculations plays only please take it with a grain of salt. You may grab the chart and delete those if you wish.
I personally will be scaling my way in for a long position and will be expecting a drop from 3 385 ish and will be waiting for PA to re-analyze my bias.
Best of luck to all

NG1!: Target Is Up! Long!
My dear friends,
Today we will analyse NG1! together☺️
The price is near a wide key level
and the pair is approaching a significant decision level of 3.087 Therefore, a strong bullish reaction here could determine the next move up.We will watch for a confirmation candle, and then target the next key level of 3.107.Recommend Stop-loss is beyond the current level.
❤️Sending you lots of Love and Hugs❤️

NI225: Move Down Expected! Short!
My dear friends,
Today we will analyse NI225 together☺️
The recent price action suggests a shift in mid-term momentum. A break below the current local range around 41,456.23 will confirm the new direction downwards with the target being the next key level of 40,954.70 and a reconvened placement of a stop-loss beyond the range.
❤️Sending you lots of Love and Hugs❤️

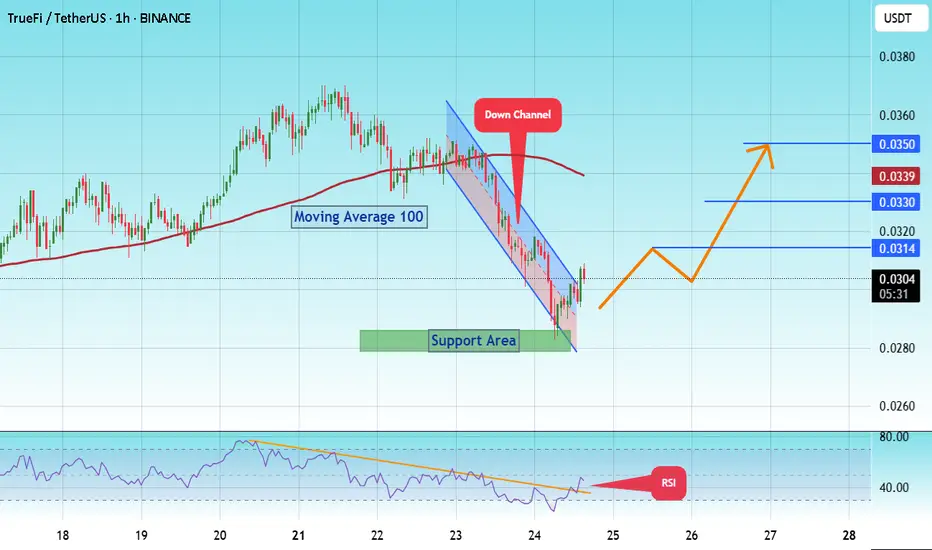
#TRU/USDT Low Risk vs High Rewards#TRU
The price is moving within a descending channel on the 1-hour frame and is expected to break and continue upward.
We have a trend to stabilize above the 100 moving average once again.
We have a downtrend on the RSI indicator that supports the upward break.
We have a support area at the lower limit of the channel at 0.0285, acting as strong support from which the price can rebound.
We have a major support area in green that pushed the price upward at 0.0280.
Entry price: 0.0300
First target: 0.0314
Second target: 0.0328
Third target: 0.0350
To manage risk, don't forget stop loss and capital management.
When you reach the first target, save some profits and then change the stop order to an entry order.
For inquiries, please comment.
Thank you.
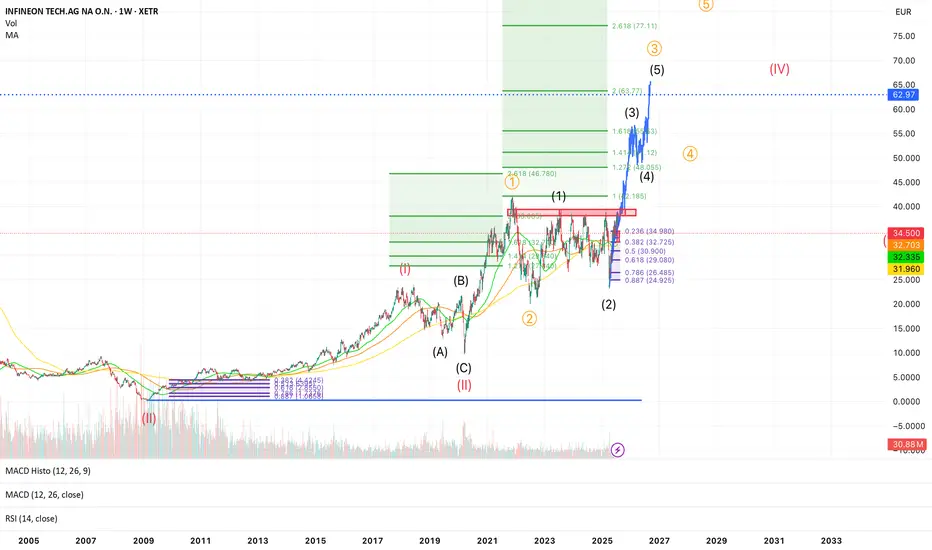
Infineon wave 3 to 62€ Gann-Methode🧠 Infineon (IFX.DE) - Massive Wave 3 in Progress 🚀 | Long-Term Elliott Wave Setup
Ticker: XETR:IFX
Exchange: XETRA 🇩🇪
Chart: Weekly (W1)
Technical Framework: Elliott Wave + Fibonacci + MA + RSI + MACD
🧩 Context:
Infineon has completed a massive corrective wave II (labelled in red) and is now in the early stages of a multi-year impulsive wave III. The price recently rejected at the 0.236 retracement (~35€) and is currently back-testing key moving averages. This zone could represent a wave (2) low of the internal (1)-(2)-(3)-(4)-(5) structure of orange wave ③.
🔎 Structure Breakdown:
✅ Wave (II) (in red) ended as a WXY-Flat-Correction, possibly in 2020
✅ Wave 1 and 2 of wave (III) are complete
✅ Current projection: we are in blue wave (3) of orange wave ③
📈 Fibonacci extensions suggest:
1.618x of wave (1) = ~53.83 €
2.0x = ~63.77 €
2.618x = ~77.11 € – ultimate long-term target for wave ③
🟦 Major resistance: 35–36 €, now acting as support
🟢 Key Moving Averages:
MA (32.7), MA (32.3), MA (31.96) are clustered — strong support zone
📊 Indicators:
MACD: Turning bullish, histogram just crossed above 0
RSI: Neutral (51), still lots of upside potential
Volume: Recent spike suggests accumulation during pullback
🔔 Key Levels:
Level Description
32.7 € Strong support (Fib 0.382 + MA)
39 € Fib 0.5 retracement
46.78 € 2.618x extension of orange wave ①
53.83 € Target: 1.618x of current wave (1)
63.77 € Major resistance / Wave (3) top?
77.11 € 2.618x extension of wave ③
🧠 Thesis:
If the recent low was wave (2), Infineon could be entering a parabolic wave (3) move with +50–100% upside potential over the next 12–18 months. The setup is supported by Elliott Wave structure, MA support, and volume confirmation.
⚠️ Risks:
Breakdown below ~30 € (0.5 Fib) would challenge this count
Macro events (e.g., chip cycle, geopolitics) may affect the timing
✅ Strategy:
I’m watching for confirmation of the local low around 32 €, and then adding during retracements. Targets are scaled into at 46 €, 54 €, and 63 €. Final wave (5) of ③ may push up to 77 €.
Tron Sets Nasdaq Debut After SRM Merger as TRX Overtakes ADATron Inc., the company behind the Tron blockchain and its native TRX token, is preparing for a landmark public listing on the Nasdaq, following its surprise merger with decentralized finance protocol Serum (SRM). The announcement sent shockwaves through the market, immediately catapulting TRX ahead of ADA to become the ninth-largest cryptocurrency by market capitalization.
The newly combined entity, operating under the name Tron Integrated Technologies, has filed its Form S-1 with the SEC, and aims to go public in Q4 2025—marking one of the first blockchain-native firms to emerge from a DeFi merger and enter public markets.
A Strategic DeFi Alliance
The deal with Serum is not just symbolic. It gives Tron deep liquidity infrastructure and decentralized exchange capabilities via Serum’s smart order routing and Solana-based engine. While the Solana connection raised eyebrows, Tron confirmed that a multi-chain expansion plan is in motion, with bridges being built across Ethereum, Solana, and BNB Chain.
“The merger with SRM accelerates our roadmap by three years,” said Tron CEO Marcus Lee. “This IPO isn’t just about capital—it's about positioning TRX as the digital fuel of a multi-chain financial internet.”
TRX Surges Amid Strategic Narrative
Following the merger news, TRX surged 22% over a five-day period, pushing its market cap to over $15.6 billion, surpassing Cardano (ADA) for the first time in over 18 months. Trading volume on centralized and decentralized exchanges spiked by over 60%, fueled by both retail speculation and whale accumulation.
According to data from Glassnode, over 84% of TRX supply is now held in long-term wallets, indicating a strong conviction among holders that the Nasdaq debut could further institutionalize the token.
Regulatory Spotlight and Market Implications
Tron’s Nasdaq listing is likely to put the project under closer regulatory scrutiny, especially given its ties to Asia-based user flows and complex tokenomics. However, sources within the SEC noted that the hybrid model—combining open-source protocol governance with a publicly traded corporate entity—could set a new precedent.
“This may be the template for the next generation of compliant crypto firms,” said Leah Thomason, regulatory analyst at Beacon Partners. “It’s essentially DeFi meets Wall Street.”
Conclusion
With the Nasdaq listing on the horizon, an ecosystem-level merger with SRM, and a strategic push toward interoperability, Tron is rewriting the playbook for token-backed companies. TRX’s leap into the top 10 is more than just a chart movement—it signals that capital markets may finally be ready for integrated blockchain operators.

Weekly Range for nifty (applicable till the expiry)This are mathematical calculation not based on important level of fib or support level that are derived by most of the Technical trader.
just trade the level with few point stop loss. for grabbing greater points.
please do check out sensex where few greater points are explained.

XAUUSD: Market Analysis and Strategy for July 25Gold technical analysis:
Daily chart resistance 3400, support 3300
4-hour chart resistance 3375, support 3342
1-hour chart resistance 3350, support 3333.
Gold, starting from 3438 this Wednesday, has fallen by nearly $100. It rebounded quickly after falling to 3351 yesterday. After sideways fluctuations in the Asian session, the current price is around 3343, and the key support below is around 3333. From a spatial point of view, this wave of adjustment is nearing its end. After waiting for the adjustment to be completed, the market will most likely return to an upward trend.
The short-term top and bottom resistance at the 1-hour level is around 3351. For intraday short-term operations, the current gold price is around 3343. Pay attention to the bearish trend near 3351. If it does not break near 3333, it will be bullish again!
SELL: 3350near
BUY: 3333near

GOLD: Strong Growth Ahead! Long!
My dear friends,
Today we will analyse GOLD together☺️
The market is at an inflection zone and price has now reached an area around 3,338.79 where previous reversals or breakouts have occurred.And a price reaction that we are seeing on multiple timeframes here could signal the next move up so we can enter on confirmation, and target the next key level of 3,351.09.Stop-loss is recommended beyond the inflection zone.
❤️Sending you lots of Love and Hugs❤️

SILVER: The Market Is Looking Down! Short!
My dear friends,
Today we will analyse SILVER together☺️
The recent price action suggests a shift in mid-term momentum. A break below the current local range around 38.780 will confirm the new direction downwards with the target being the next key level of 38.635.and a reconvened placement of a stop-loss beyond the range.
❤️Sending you lots of Love and Hugs❤️

Cutting-edge Tech, Outperforming Traditional Tools Until now my AI has been defying market odds
The forecasts work on all timeframes, short, medium or long range
My AI is outperforming traditional tools, in real time, thats right...with real time validation
The question is, will the crown remain intact or be dethroned??

Crude oil trading reminder: triple positive support
💡Message Strategy
After three consecutive days of sluggishness, both U.S. and Brent crude oil remained above the 100-day moving average on Thursday (July 24). U.S. crude oil is currently up 0.4%, trading around 65.46; Brent crude oil is currently up 0.1%, trading around US$68.67 per barrel. The three engines of trade negotiations, unexpected decline in inventories, and geopolitical games are ignited at the same time. Oil prices showed signs of stabilizing, allowing bulls to "smell" the long-awaited rebound opportunity.
1. The trade war breaks the ice: the US, Japan and Europe have reached a series of agreements to ignite market hopes.
2. Inventories plummeted by 3.2 million barrels! The balance of supply and demand suddenly tilted.
3. Geopolitical black swan: The war between Russia and Ukraine burns the energy supply chain
📊Technical aspects
The short-term (4H) trend of crude oil fluctuated upward slightly. The moving average system gradually formed a bullish arrangement, and the short-term objective trend direction was upward. In terms of momentum, the MACD indicator opened upward above the zero axis, and the bullish momentum was sufficient.
In terms of form, the oil price broke through the neckline, and the head and shoulders bottom reversal pattern was established. It is expected that after the intraday crude oil trend retests the neckline position, the probability of forming another upward rhythm is high.
💰Strategy Package
Long Position:65.50-66.50,SL:64.00,Target:67.75-68.00

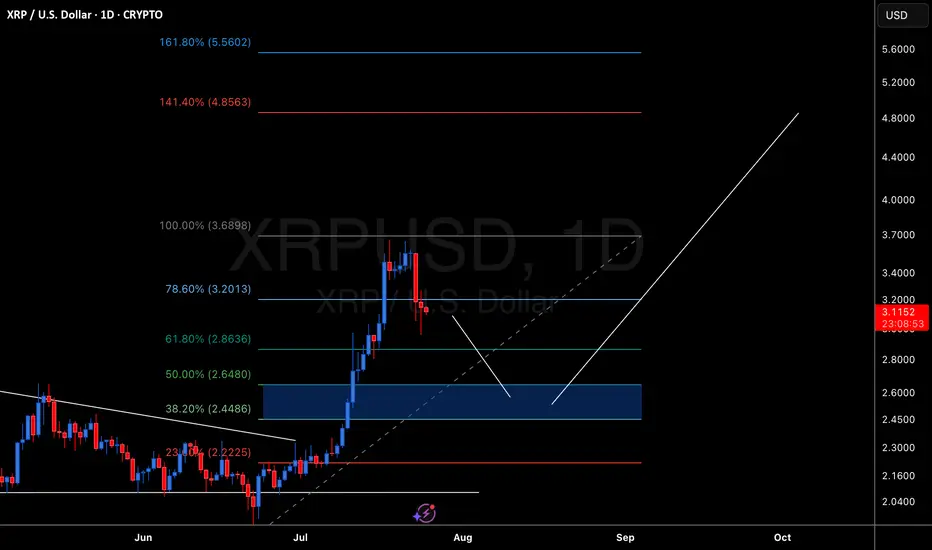
XRP Temporary Pull Back Followed Bu Move Up To $4.00XRP Created a new high. Looking for a pull back to the 50% retracement level. Followed by a move up to the 141 fib level of around $4.00
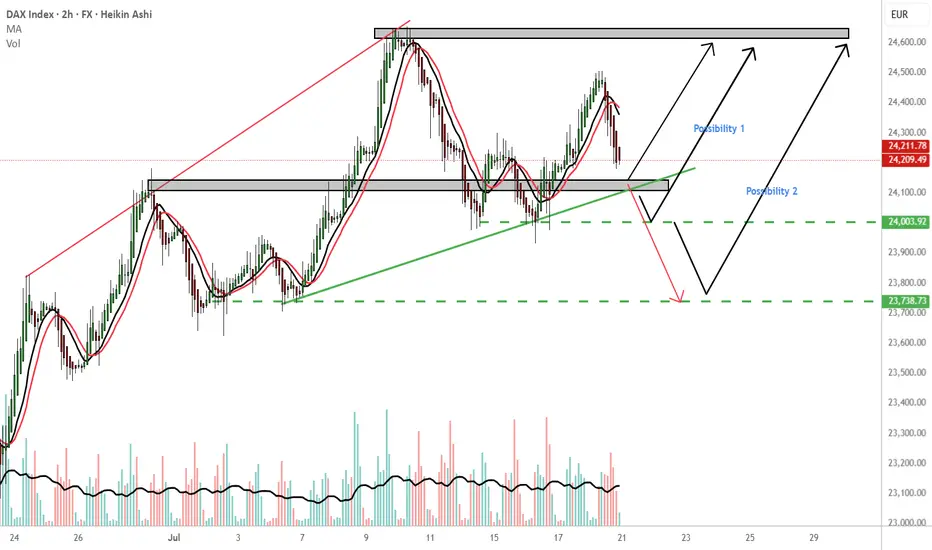
GER 30 endless possibilitiesMy most immediate outcome is reversal 24,140 price area. TP:24,600
Possibility 1: If Ger 30 holds the 24,000 price area i would consider a buy to 24,600.
Possibility 2: If Ger30 holds the 23,730 price area that would be another possibility for a buy. TP 24,600.
WCS: Worst case scenario, continuation downwards from the 24140 PL. Consider the red arrow. The 24,140 is a important price area please wait for confirmation
Please follow your trading plan.
THOUGHTS????

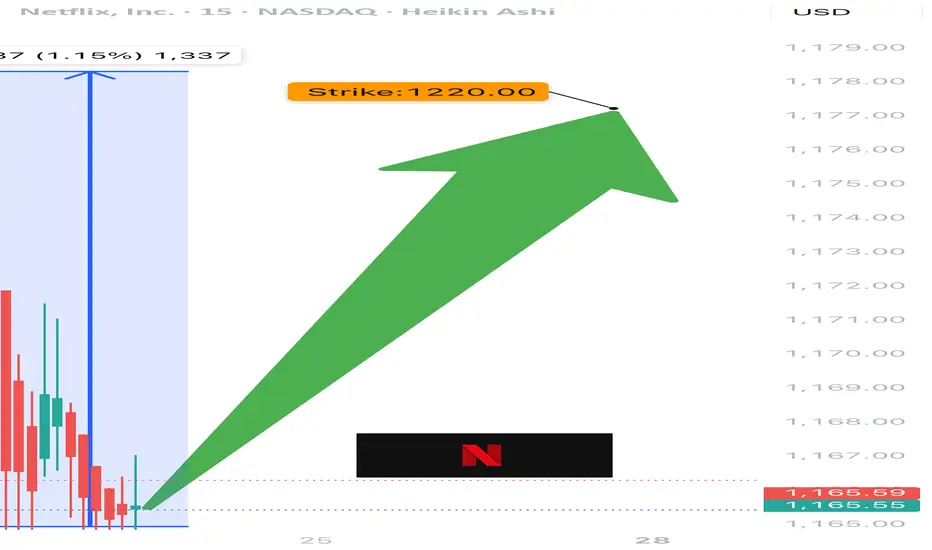
NFLX TRADE IDEA (07/24)
🚨 NFLX TRADE IDEA (07/24) 🚨
⚔️ Bulls vs. Bears… but calls are winning 🐂📈
🧠 Quick Breakdown:
• Call/Put Ratio: 1.27 → bullish edge
• RSI < 45 = 🔻oversold territory
• VIX favorable = room to run
• High gamma = big moves incoming ⚡️
• Expiry: TOMORROW = 🔥 time decay risk
💥 TRADE SETUP
🟢 Buy NFLX $1220 Call exp 7/25
💰 Entry: $0.50
🎯 Target: $0.90
🛑 Stop: $0.30
📈 Confidence: 65%
⚠️ Watch volatility closely. Fast exit = smart exit.
#NFLX #OptionsFlow #OptionsAlert #BullishPlay #DayTradeSetup #NetflixStock #TechOptions #UnusualOptionsActivity #TradingView #GammaSqueeze
#GTC/USDT Long Trade Plan#GTC
The price is moving within a descending channel on the 1-hour frame and is expected to break and continue upward.
We have a trend to stabilize above the 100 moving average once again.
We have a downtrend on the RSI indicator that supports the upward break.
We have a support area at the lower boundary of the channel at 0.282, acting as strong support from which the price can rebound.
We have a major support area in green that pushed the price upward at 0.275.
Entry price: 0.293
First target: 0.303
Second target: 0.317
Third target: 0.332
To manage risk, don't forget stop loss and capital management.
When you reach the first target, save some profits and then change the stop order to an entry order.
For inquiries, please comment.
Thank you.

The combination of the Leo New Moon and the Gann Square support Astrologically, we have two important events, the first is the new moon in Leo, which will cause a new movement in the market and give new life to the market. The second is the opposition of the Sun and Pluto, which caused a power struggle between buyers and sellers and at some point there were several stop hunts, but now it seems that the price above 118 thousand is stabilizing and could start a new rally upwards.

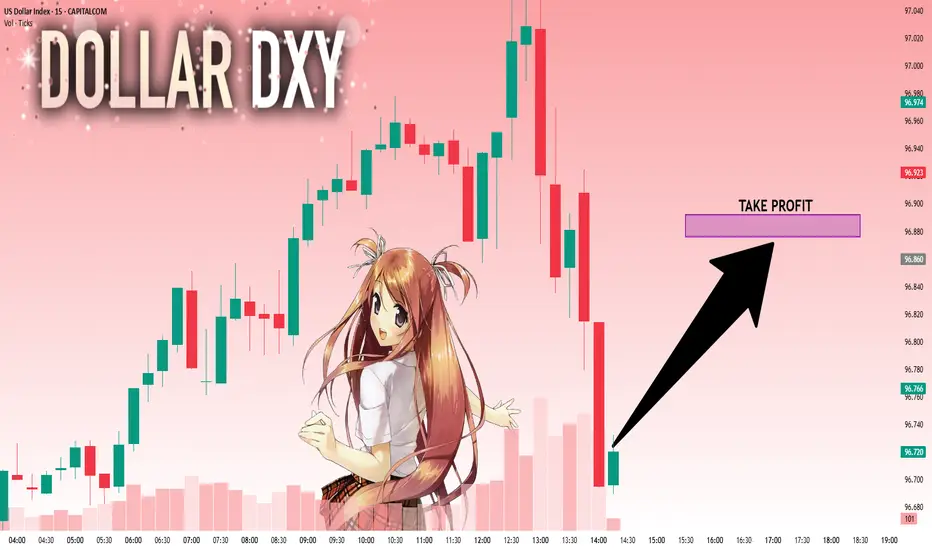
DXY: Strong Bullish Sentiment! Long!
My dear friends,
Today we will analyse DXY together☺️
The in-trend continuation seems likely as the current long-term trend appears to be strong, and price is holding above a key level of 96.722 So a bullish continuation seems plausible, targeting the next high. We should enter on confirmation, and place a stop-loss beyond the recent swing level.
❤️Sending you lots of Love and Hugs❤️
SILVER: Bulls Are Winning! Long!
My dear friends,
Today we will analyse SILVER together☺️
The market is at an inflection zone and price has now reached an area around 39.025 where previous reversals or breakouts have occurred.And a price reaction that we are seeing on multiple timeframes here could signal the next move up so we can enter on confirmation, and target the next key level of 39.148.Stop-loss is recommended beyond the inflection zone.
❤️Sending you lots of Love and Hugs❤️

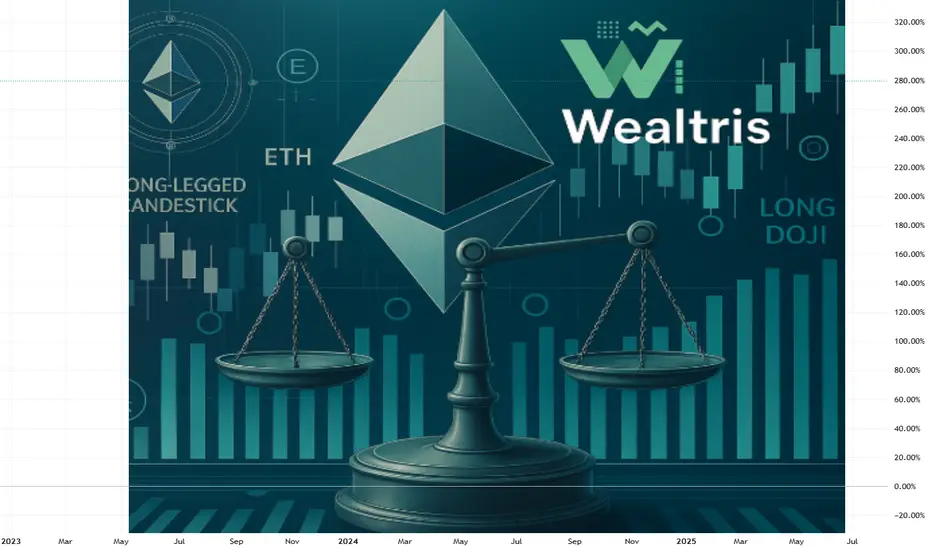
Wealtris: Why Ethereum & Altcoins Are Down — And How We ProfitCrypto markets have corrected sharply in recent days, with Ethereum and altcoins posting significant losses. The sell-off was triggered by a combination of macroeconomic concerns and overheated altcoin valuations—but for Wealtris, such moves represent strategic opportunities, not threats.
The core driver of the downturn was the U.S. Federal Reserve’s renewed hawkish tone, suggesting interest rates may remain elevated longer than expected. This spooked global markets and hit risk assets hardest, including crypto. Ethereum dipped below $2,000, prompting further technical selling across DeFi, Layer 2s, and NFT-related tokens.
While panic selling defined the broader market, Wealtris responded with active capital rotation, reallocating into oversold yet fundamentally strong assets. We hedge market risk using ETH derivatives, enter stable-yield protocols to preserve capital, and deploy liquidity into strategic assets during price discounts.
Importantly, Ethereum’s long-term value proposition remains intact. The network still holds over $60B in DeFi TVL, staking participation continues to grow, and Ethereum’s development roadmap—especially in zero-knowledge rollups and Layer 2 scaling—is advancing rapidly. Temporary volatility does not change the structural thesis.
For Wealtris clients, this means we remain active during downturns. While others retreat, we leverage volatility for strategic entries and generate returns even in sideways or bearish conditions.
Our approach combines real-time data, fundamental conviction, and professional execution. Through personalized portfolios and macro-responsive strategies, we help clients avoid emotional decisions—and turn fear into financial advantage.
Today’s correction is tomorrow’s opportunity. With Wealtris by your side, your capital is positioned not only to weather the storm—but to grow from it.
Wealtris: Ethereum Demand Surges 32x — Price Set to Explode?According to a recent market analysis by Bitwise, Ethereum’s demand now exceeds supply by 32 times—a rare market condition that could lead to a major price breakout. Institutional interest, combined with Ethereum’s deflationary structure, is creating a perfect storm for growth.
At Wealtris, we treat this not just as market news, but as a strategic window to help our investors profit from a fundamentally bullish setup.
The imbalance is driven by several forces: over 27 million ETH are locked in staking, taking supply out of circulation; the upcoming wave of Ethereum spot ETFs is attracting pre-approval accumulation; and Ethereum’s fee-burning mechanism continues to deflate the token’s total supply. Simultaneously, its role as the backbone of DeFi, NFT infrastructure, and Layer 2 chains keeps demand elevated.
While traders speculate, institutions prepare. Whales and funds are quietly accumulating ETH in anticipation of regulatory clarity and ETF launches. Bitwise compares this setup to Bitcoin’s trajectory before its 2020 bull run, when a similar supply crunch triggered explosive gains.
Wealtris is already positioned for this moment. Our investment strategies offer smart exposure to Ethereum via staking platforms, ETH-indexed instruments, and Layer 2 ecosystem tokens. We provide our clients with risk-managed access to the Ethereum upside—without the need to self-manage wallets or guess market timing.
In addition, we monitor on-chain data and ETF progress in real time, adjusting exposure as signals shift. Our hybrid strategy—balancing yield generation and price exposure—helps clients benefit from both sides of the Ethereum equation.
For forward-looking investors, the 32:1 demand ratio isn’t just an interesting metric—it’s a signal. Wealtris uses that signal to generate structured growth through precise capital allocation and macro-responsive rebalancing.
With regulatory developments, staking innovation, and ETF momentum building, Ethereum appears poised for an institutional era. At Wealtris, we ensure our clients are prepared—early, efficiently, and profitably.