EURUSD: Local Bullish Bias! Long!
My dear friends,
Today we will analyse EURUSD together☺️
The recent price action suggests a shift in mid-term momentum. A break above the current local range around 1.14158 will confirm the new direction upwards with the target being the next key level of 1.14327 and a reconvened placement of a stop-loss beyond the range.
❤️Sending you lots of Love and Hugs❤️
Gann

SILVER: Absolute Price Collapse Ahead! Short!
My dear friends,
Today we will analyse SILVER together☺️
The in-trend continuation seems likely as the current long-term trend appears to be strong, and price is holding below a key level of 36.640 So a bearish continuation seems plausible, targeting the next low. We should enter on confirmation, and place a stop-loss beyond the recent swing level.
❤️Sending you lots of Love and Hugs❤️

#OP/USDT#OP
The price is moving within a descending channel on the 1-hour frame and is expected to break and continue upward.
We have a trend to stabilize above the 100 moving average once again.
We have a downtrend on the RSI indicator that supports the upward move with a breakout.
We have a support area at the lower limit of the channel at 0.600, acting as strong support from which the price can rebound.
Entry price: 0.616
First target: 0.630
Second target: 0.641
Third target: 0.658

#ONE/USDT#ONE
The price is moving within a descending channel on the 1-hour frame and is expected to break and continue upward.
We have a trend to stabilize above the 100 moving average once again.
We have a downtrend on the RSI indicator that supports the upward move with a breakout.
We have a support area at the lower limit of the channel at 0.01147, acting as strong support from which the price can rebound.
Entry price: 0.01183
First target: 0.01210
Second target: 0.01236
Third target: 0.01268

#DOGE/USDT#DOGE
The price is moving within a descending channel on the 1-hour frame and is expected to break and continue upward.
We have a trend to stabilize above the 100 moving average once again.
We have a downtrend on the RSI indicator, which supports the upward move by breaking it upward.
We have a support area at the lower limit of the channel at 0.1800, acting as strong support from which the price can rebound.
Entry price: 0.1838
First target: 0.1886
Second target: 0.1928
Third target: 0.1972


US30 This trade is an A+ setup from abnormal context to normal context. The price took BSL on HTF and failed to create FVG on daily as a result of the lack of creating FVG. After that, in the 4H, the price closed below -OB. Now we are short; we just need to engage.

Gold hits 3335 in the US market and shorts
⭐️Gold information:
Looking back at last week's trend, after hitting a high on Monday, gold prices fluctuated in a range from Tuesday to Thursday, and closed with a sharp drop on Friday, forming an M-top pattern from a technical perspective.
This week, the market focus is on the high-level trade negotiations between China and the United States held in London. The market expects that the negotiations will proceed smoothly, and this optimism is bearish for gold. Based on the comprehensive technical and fundamental analysis, the gold price is still bearish today. It is recommended to pay attention to the short-selling opportunities in the rebound range of 3330-3340 US dollars.
⭐️Set gold price:
🔥Sell gold area: 3330-3340 SL 3345
TP1: $3320
TP2: $3310
TP3: $3295

The Hidden Signals in AG: A Silver Lining in Technical Patterns?Sometimes the market whispers before it roars. If you're watching First Majestic Silver (AG), those whispers just became a chant. In this post, I break down the technical patterns, potential numerology synchronicities, and trader psychology that could signal something big brewing for AG. Whether you're a skeptic or a believer, the confluence here is too compelling to ignore.
1. Descending Triangle (Weekly Chart)
Let's start with the macro structure: a descending triangle stretching all the way from Feb 1, 2021 to April 23, 2025. This isn’t just any triangle. Its base lines up perfectly with today’s breakout candle low, forming a multi-year support zone around the $5.90 - $6.00 range.
In technical analysis, descending triangles often resolve in the direction of the trend preceding their formation. Given that AG was in a downtrend from 2021 highs, this bullish breakout now marks a significant shift in sentiment and market dynamics.
2. Hourly Chart: Inverse Head and Shoulders
Zoom in to the hourly chart and we get a classic reversal pattern: Inverse Head and Shoulders.
Left Shoulder: April 12 low
Head: April 16 low
Right Shoulder: April 19 low
Neckline: $6.38 — previously tested and rejected
Today’s breakout through this neckline is textbook. If this plays out:
Measured Move Target: ~$8.00
Why $8? It’s the level where AG failed to break out on Oct 29, 2023, making it a key resistance and psychological target.
3. Cloned Triangle Geometry (Gann Vibes)
Here’s where it gets interesting. Clone the triangle and flip it vertically:
The tip touches both the April 4, 2011 all-time high and the March 16, 2020 COVID pivot low.
This implies a natural "mirror" or cycle echo—like Gann’s time-price equivalence coming into play.
Coincidence? Maybe. But technical setups with this much harmony don’t appear every day.
4. Numerology and Time Symmetry
I know this part might sound woo-woo, but bear with me:
Feb 1, 2021 to April 23, 2025 = 1,177 days, or just over 3.22 years
AG’s breakout candle occurred on April 24
April 4, 2011 = 4/4/11 → 4 + 4 + 1 + 1 = 10
March 16, 2020 = 3 + 1 + 6 + 2 + 0 + 2 + 0 = 14
Total = 24 → Today’s date again: April 24
Even the closing price of $6.22 gives us 6+2+2 = 10, echoing the 2011 ATH numerology.
Take it with a grain of salt, but these repeating patterns may hint at cyclical alignment.
5. Volume Confirmation
The breakout came with a surge in volume, confirming the move and reducing the likelihood of a fake-out. Coupled with bullish RSI divergence, this gives the technical thesis real legs.
6. Macro Context: Silver vs Gold
While gold consolidates, silver is trying to play catch-up. This rotation into high-beta silver names makes sense and AG, being a retail favorite and highly shorted at times, is perfectly positioned for explosive upside.
7. Options Play: December 2026 Calls
For long-term traders, LEAPS (Long-Term Equity Anticipation Securities) could be the way to play this:
December 2026 Calls
Strike Range: $7, $8.50, $10
Low premium, high convexity potential
Conclusion: Is This the Signal or Just Noise?
You don’t have to be a believer in numerology or market mysticism to appreciate the convergence of:
Triangle breakout
Volume surge
Inverse head-and-shoulders
Price symmetry
Historical pivot touchpoints
All signs point toward a potential trend reversal for AG. At the very least, this setup offers a high reward-to-risk swing opportunity. At best? You might just be witnessing the start of a major silver bull move.
What’s Your Take?
Do you see the same signals or think this is just coincidental noise?
Joel | The Accidental Retiree
"Retired. Sort of. But still trading like I mean it."

XAUUSD: Analysis and Strategy for June 9Gold technical analysis
Daily chart resistance 3400, support 3270
Four-hour chart resistance 3340, support 3290
One-hour chart resistance 3330, support 3305.
NFP data suppresses expectations of rate cuts, and the technical 4H/1H chart short positions suppress the rebound space. News and technical aspects simultaneously push gold down. In the short term, gold prices are running below the previous top and bottom conversion position of 3332. The US market focuses on the 3330 long-short dividing line. If it stands firm at 3330, you can follow up and buy, with a target of 3350; if it falls below 3290, continue to chase shorts to 3260.
Focus on today's China/US trade negotiations on the news: If there is no breakthrough in the London talks, risk aversion may drive gold to continue to rebound.
SELL: 3330near SL: 3335
BUY: 3295near SL: 3290

Bitcoin B-Wave Trap? Major C-Wave Down Correction Incoming!Bitcoin’s recent bounce has all the signs of a classic B-wave in an ABC corrective structure. After the impulsive A-wave down from the highs, this current rally appears more like a corrective relief move rather than the start of a new bullish impulse. Volume remains weak and the structure looks choppy — not the kind of strength you’d expect from a sustainable uptrend.
I believe we are now completing the B-wave, luring in late bulls before the real drop — the C-wave — begins. This next leg down could be sharp and painful, targeting key support zones and possibly wiping out the complacency that’s built up in the market.
🧠 Watch for signs of exhaustion in this rally.
📉 Potential C-wave targets: 98k 97k
⏳ Timing and structure suggest we’re close to the turning point.
Stay cautious. This could be the calm before the real storm.
---

USDZAR-SELL strategy 3 hourly chart GANNThe pair has not been doing much last few sessions, but certainly it has weakness embedded into the price action.
Strategy SELL @ 17.7350 - 17.7650 and take profit near 17.6175 for now.

Nifty Gave Breakaway Gap Strong Bullish SignalWhat is Breakaway GAP?
A breakaway gap refers to the situation in the market where there is a strong price movement that crosses support or resistance. Breakaway gaps are formed after substantial periods of consolidation of prices in the market. It signifies a break from the previous trading range or pattern, and it suggests that a new trend or direction is emerging.
Nifty was trading in a range for 5 days and today 6/09/2025 it gap up and sustained above 25000 crucial level, the importance of break-away gap is that it's very strong sign of bullishness in market this also strong support too so if nifty come to retrace it would become support around 25000 level,
if nifty break today opening rang then it's very likely that it will go further so there are possibly Two entry Sign for Long: - first, OR breakout, second: -retracement on 15 Min chart near 20 Ema -50 Ema. Thats My opinion

TSLA-SELL strategy 3D Reg. channelThe share has retraced a bit and restarted its decline. Considering the technical picture of negative impacts and the ongoing statements between the two parties, the case is stronger for a much lower share price. I feel we may see $ 230 or lower breaking below channel support.
Strategy SELL @ $ 290-310 and take profit near $ 195 for now.

Buy trade on EURUSD Ok. From my strategy stand point, I see a potential buy on EU, reason been that price broke out of my trend line and gives me an abc setup , then I locate my poi, which I s my entry point, so i am in for a buy

#ETH/USDT#ETH
The price is moving within a descending channel on the 1-hour frame and is expected to break and continue upward.
We have a trend to stabilize above the 100 moving average once again.
We have a downtrend on the RSI indicator that supports the upward move with a breakout.
We have a support area at the lower limit of the channel at 2429, acting as strong support from which the price can rebound.
Entry price: 2535
First target: 2564
Second target: 2598
Third target: 2647

#ETH/USDT#ETH
The price is moving within a descending channel on the 1-hour frame, adhering well to it, and is heading for a strong breakout and retest.
We are seeing a rebound from the lower boundary of the descending channel, which is support at 2460.
We have a downtrend on the RSI indicator that is about to be broken and retested, supporting the upward trend.
We are looking for stability above the 100 moving average.
Entry price: 2506
First target: 2550
Second target: 2600
Third target: 2656

9 june Nifty50 brekout and Breakdown leval
🔵 Call (CE) Buy Levels:
24,768 – Above 10m hold CE by Risky Zone
25,122 –Above 10m hold CE Zone
25,290 – Above 10m hold CE by Zone
25,490 – Above 10m closing, short covering possible
🔴 Put (PE) Buy Levels:
25,290 – Below 10m PE by Risky Zone
25,490 – Below 10m PE by Safe Zone
24,768 – Below 10m hold PE by Zone
🟢 Other Key Zones:
24,530 – CE by Safe Zone
➤ Below this: Unwinding Possible
25,122 – Above: Positive Trade View
➤ Below: Negative Trade View

BTCUSD: Will Go Up! Long!
My dear friends,
Today we will analyse BTCUSD together☺️
The market is at an inflection zone and price has now reached an area around 105,746.43 where previous reversals or breakouts have occurred.And a price reaction that we are seeing on multiple timeframes here could signal the next move up so we can enter on confirmation, and target the next key level of 106,033.06.Stop-loss is recommended beyond the inflection zone.
❤️Sending you lots of Love and Hugs❤️

ETHUSD: The Market Is Looking Down! Short!
My dear friends,
Today we will analyse ETHUSD together☺️
The price is near a wide key level
and the pair is approaching a significant decision level of 2,512.0 Therefore, a strong bearish reaction here could determine the next move down.We will watch for a confirmation candle, and then target the next key level of 2,501.7..Recommend Stop-loss is beyond the current level.
❤️Sending you lots of Love and Hugs❤️

BTC Elliott wave analysis 6/8/2025 In my view, we are currently entering an A-B-C corrective wave, which is part of wave (4) and will complete wave (iv).
The bullish Crab harmonic pattern suggests that wave Ⓐ of (4) should bottom around 95,600–96,000. Following that, the Gann fan indicates that wave Ⓑ could rise to the 100,000–101,000 range, which also aligns with a key resistance zone.
For wave Ⓒ, the Gann fan suggests a downward move to around 94,000–92,000, a zone that corresponds to strong support.
Once wave (4) completes, the market should be positioned to begin wave (5), which will finalize the larger wave ⑤.
A key validation level to watch is 84,000. If the price drops below this level, the count would be invalidated, as wave (4) cannot fall below the low of wave (2).

AUDCHF short movePrice raised to our supply zone reacted bearish and hence i expect price to continue pushing downward.

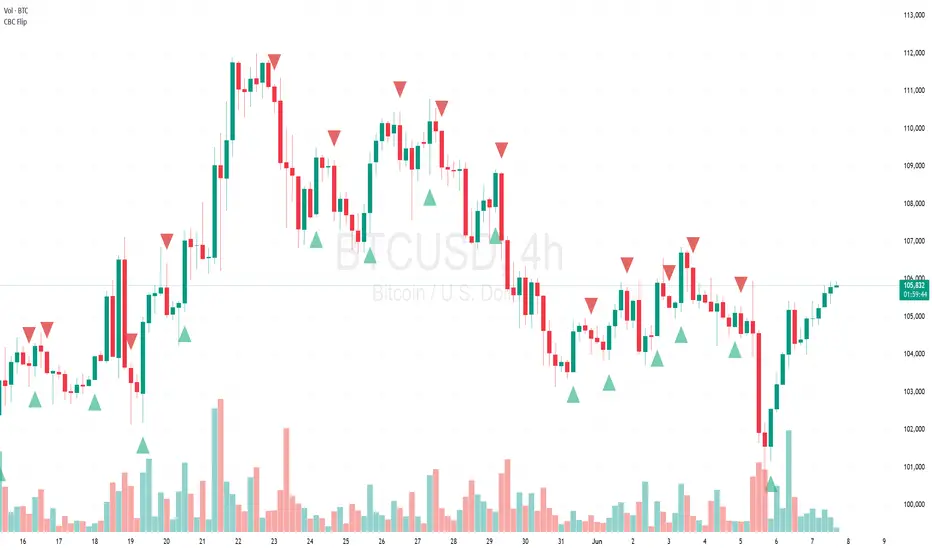
BTC/USD 4H Analysis: CBC Flip Strategy Long OpportunitiesThe following analysis is based on the BTC/USD 4-hour chart, utilizing the CBC Flip Strategy indicator . As of the latest data, the price has experienced significant volatility, with a current level around 105,946 USD, reflecting a 0.94% increase over the observed period. Key pivot points are noted at 103,888 (H4), 104,304 (L3), 107,127 (C3), and 107,307 (Vol 104.09), providing critical support and resistance levels.
The chart highlights multiple long entry opportunities, with notable setups including:
A long entry at approximately 104,000 USD with a TP/SL at 104,319 and a target of 104,546.
Another long setup near 105,000 USD with TP/SL at 105,127 and a target of 105,307.
Recent price action shows a recovery from a low of 103,000 USD, with green candlesticks indicating bullish momentum as of June 7, 2025, 17:52 UTC-4.
The CBC Flip Strategy, set with a 2% risk parameter, suggests disciplined trade management. Volume analysis at the bottom indicates increased activity during upward movements, supporting the validity of these long signals. Traders should monitor for a potential retest of the 104,304 support level, with a break above 107,127 potentially confirming a stronger bullish trend.
Disclaimer: This analysis is for educational purposes only and not financial advice. Trading involves substantial risk, and past performance is not indicative of future results. Conduct your own research and consult a financial advisor before making trading decisions.