$ZM Swing Setup – Fib Expansion + Recovery Arc🔍 NASDAQ:ZM Swing Setup – Fib Expansion + Recovery Arc
Zoom is entering a Fibonacci golden arc setup, bouncing off key support ($75.60) and aiming for a multi-leg move back toward structural targets.
Trade Thesis: A successful reclaim of $85–88 range can propel NASDAQ:ZM to $105–109 with a final fib target of $122 if volume confirms.
Risk: Break below $72 invalidates the recovery arc.
🧠 WaverVanir DSS Score: 7.4/10
📌 Targets:
TP1: $85.00 (safe swing exit)
TP2: $96.24 (measured move)
TP3: $108.99–$122.53 (macro extension targets)
⚠️ SL: $72.30 | RR: 3.5:1 | Timeline: 30–60 days
#Zoom #ZM #Fibonacci #WaverVanir #Options #SwingTrade #AIQuant #TradingView
🔍 Chart Overview
Ticker: ZM (Zoom Video Communications, Inc.)
Timeframe: Daily
Chart Tools: Fibonacci retracement & extension levels, projected Elliott-style wave structure
📊 Current Price
Current Price: $77.57
Key Support:
$75.60 → Previous pivot low (likely acting as short-term support)
$72.30 → Golden Pocket zone (high probability bounce area)
Key Resistance Zones:
$85.00 → 1.0 Fib retracement (former high)
$88.35 → 61.8% retracement of previous drop
$96.24 → Full 100% retracement
$105.78 → 1.272 extension (strong resistance)
$109.01 → 1.618 Fib extension
🧠 Technical Structure & Path Forecast
A potential ABC impulse wave is drawn in red:
Leg A → Target ~$92–96 range (50–100% retracement zone)
Pullback (leg B) → ~$88–90 support retest
Leg C rally → Major resistance at $108.99, possibly extending to $116.91 or $122.53 in a blow-off top
Confluence Targets:
$105.78 (1.272 extension) aligns with a major Fib cluster and resistance zone
$109.01 (1.618 extension) also aligns with previous structural highs
Final target ~$122.53 (2.272 extension) is ambitious but possible under bullish macro conditions
⚠️ Risk Management
Stop-Loss (short-term): $72.30 (loss of this level invalidates the bullish thesis short-term)
Entry Zones:
Swing long: $75.60–$77.50 (ideal accumulation range)
Momentum entry: above $85.00 (break of structure)
Downside Risks:
Break below $72.30 opens the path to $67.00 and possibly lower
📈 Probabilities (Based on WaverVanir DSS)
Target Level Type Probability
$85.00 Local resistance 80%
$96.24 Measured move 100% 68%
$105.78 1.272 Fib extension 55%
$109.01 1.618 Fib extension 45%
$122.53 2.272 Fib extension 25%
Gann

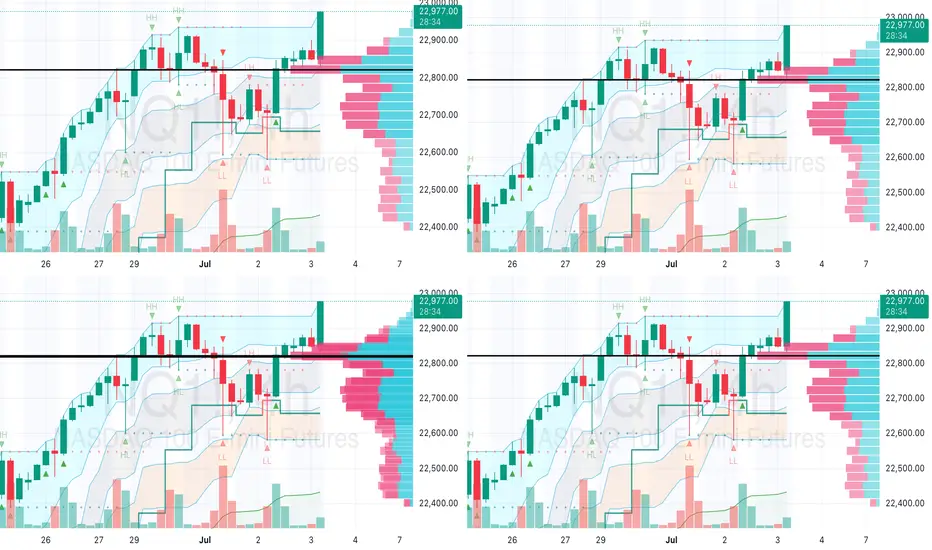
NQ Futures Explosive Breakout! Will It Hit 23,400? 1. Market Context
Timeframe: Daily chart from June 26 to July 4, 2025, with data current as of 09:29 AM EDT, July 3, 2025.
Trend: The price has been in an uptrend, breaking above 22,600.00 and approaching resistance near 22,915.00-23,000.00, consistent with recent bullish momentum in NQ futures (TradingView, CME Group).
2. Key Levels
Support: Immediate support at 22,600.00-22,700.00, where moving averages and prior consolidation align. A deeper support lies around 22,400.00 (lower trendline).
Resistance: Key resistance at 22,915.00, with a potential target at 23,000.00. A break above could aim for 23,200.00-23,400.00 (Fibonacci levels from web sources).
Stop Loss: Place below support (e.g., 22,580.00) to protect against a reversal.
Take Profit: Target 23,000.00 initially, with an extended goal at 23,400.00 if momentum holds.
3. Technical Indicators
Candlestick Patterns: Green candles near 22,915.00 suggest buying pressure, but red candles and dojis indicate potential indecision or rejection at resistance.
Volume: At 31.54K, volume is moderate. A spike on a breakout would confirm strength; a decline might signal exhaustion.
Moving Averages: The chart shows multiple MAs (e.g., 50-day, 200-day). Price above these supports the uptrend; a cross below could signal a shift.
4. Trade Plan
Entry: Enter long near 22,900.00 if consolidation holds, or on a breakout above 22,915.00 with volume confirmation.
Risk-Reward Ratio: Aim for 1:2 (e.g., risk 20 points to gain 40 points toward 23,000.00, or 400 points toward 23,400.00).
Position Sizing: Base on your account size and 1-2% risk per trade, considering NQ’s $20 multiplier per point.
Exit Strategy: Take partial profits at 23,000.00 and trail the rest, or exit fully if resistance holds.
5. Risk Management
Volatility: NQ’s recent range (22,400.00-22,915.00) suggests moderate volatility. Use tight stops due to potential news-driven moves.
News/Event Risk: Monitor Fed statements or tech earnings (key NQ drivers per CME Group) scheduled around July 3-4, 2025.
6. Scenario Analysis
Bullish Case: A break above 22,915.00 with strong volume could push NQ to 23,200.00-23,400.00, aligning with Fibonacci targets (TradingView).
Bearish Case: Rejection at 22,915.00 with a red candle might drop to 22,600.00-22,700.00. Cut losses if support fails.
#GALA/USDT Gala bull run possible ?
#GALA
The price is moving within a descending channel on the 1-hour frame, adhering well to it, and is on its way to breaking it strongly upwards and retesting it.
We have a bounce from the lower boundary of the descending channel, this support at 0.0600.
We have a downtrend on the RSI indicator that is about to break and retest, supporting the upward move.
There is a key support area in green at 0.01312, which represents a strong basis for the upward move.
Don't forget one simple thing: ease and capital.
When you reach the first target, save some money and then change your stop-loss order to an entry order.
For inquiries, please leave a comment.
We have a trend of stability above the Moving Average 100.
Entry price: 0.01360
First target: 0.01412
Second target: 0.01450
Third target: 0.01500
Don't forget one simple thing: ease and capital.
When you reach the first target, save some money and then change your stop-loss order to an entry order.
For inquiries, please leave a comment.
Thank you.

#DYM Dymension's Falling Wedge#DYM
The price is moving within a descending channel on the 1-hour frame, adhering well to it, and is on its way to breaking it strongly upwards and retesting it.
We have a bounce from the lower boundary of the descending channel. This support is at 0.2130.
We have a downtrend on the RSI indicator that is about to break and retest, supporting the upside.
There is a major support area in green at 0.2100, which represents a strong basis for the upside.
Don't forget a simple thing: ease and capital.
When you reach the first target, save some money and then change your stop-loss order to an entry order.
For inquiries, please leave a comment.
We have a trend to hold above the 100 Moving Average.
Entry price: 0.2220
First target: 0.2276
Second target: 0.2340
Third target: 0.2427
Don't forget a simple thing: ease and capital.
When you reach the first target, save some money and then change your stop-loss order to an entry order.
For inquiries, please leave a comment.
Thank you.

#PEOPLE Breakout in Action!#PEOPLE
The price is moving within a descending channel on the 1-hour frame, adhering well to it, and is poised to break it strongly upwards and retest it.
We have a bounce from the lower boundary of the descending channel. This support is at 0.01717.
We have a downtrend on the RSI indicator that is about to break and retest, supporting the upward move.
There is a key support area (in green) at 0.01650, which represents a strong basis for the upward move.
Don't forget one simple thing: ease and capital.
When you reach the first target, save some money and then change your stop-loss order to an entry order.
For inquiries, please leave a comment.
We have a trend of stability above the Moving Average 100.
Entry price: 0.01764
First target: 0.01807
Second target: 0.01855
Third target: 0.01916
Don't forget one simple thing: ease and capital.
When you reach the first target, save some money and then change your stop-loss order to an entry order.
For inquiries, please leave a comment.
Thank you.

DXY: Next Move Is Down! Short!
My dear friends,
Today we will analyse DXY together☺️
The market is at an inflection zone and price has now reached an area around 96.362 where previous reversals or breakouts have occurred.And a price reaction that we are seeing on multiple timeframes here could signal the next move down so we can enter on confirmation, and target the next key level of 96.319..Stop-loss is recommended beyond the inflection zone.
❤️Sending you lots of Love and Hugs❤️

GOLD: Target Is Up! Long!
My dear friends,
Today we will analyse GOLD together☺️
The price is near a wide key level
and the pair is approaching a significant decision level of 3,347.31 Therefore, a strong bullish reaction here could determine the next move up.We will watch for a confirmation candle, and then target the next key level of 3,353,67.Recommend Stop-loss is beyond the current level.
❤️Sending you lots of Love and Hugs❤️

EURUSD: Move Up Expected! Long!
My dear friends,
Today we will analyse EURUSD together☺️
The recent price action suggests a shift in mid-term momentum. A break above the current local range around 1.17930v will confirm the new direction upwards with the target being the next key level of 1.17985 and a reconvened placement of a stop-loss beyond the range.
❤️Sending you lots of Love and Hugs❤️

SILVER: Local Bearish Bias! Short!
My dear friends,
Today we will analyse SILVER together☺️
The in-trend continuation seems likely as the current long-term trend appears to be strong, and price is holding below a key level of 36.897 So a bearish continuation seems plausible, targeting the next low. We should enter on confirmation, and place a stop-loss beyond the recent swing level.
❤️Sending you lots of Love and Hugs❤️

July 1 Bitcoin Bybit chart analysis
Hello
This is Bitcoin Guide.
If you "follow"
You can receive real-time movement paths and comment notifications on major sections.
If my analysis was helpful,
Please click the booster button at the bottom.
Here is the Bitcoin 30-minute chart.
Shortly later at 10:30 PM and 11:00 PM, there will be a NASDAQ index announcement.
On the left, with a purple finger,
I connected the long position entry point of $106,775.9, which I entered yesterday, to today's strategy.
Since the rebound was not strong yesterday,
the 12-hour chart -> daily chart MACD dead cross is currently under pressure.
Depending on the situation, it can drop strongly to the 3rd section at the bottom,
and since there may be some people who are maintaining long positions yesterday,
I will explain in detail the operating method such as the loss cut price,
so please check it carefully.
*When the blue finger moves,
Bidirectional neutral
Short->Long switching strategy
1. 107,300.3 dollars short position entry section / stop loss price when orange resistance line is broken
2. 106,222.2 dollars long position switching / stop loss price when section 2 is touched
3. Top section long position 1st target -> Good 2nd target
It is important until 9 o'clock when the 12-hour candle is created.
After 9 o'clock, the blue finger 106,222.2 dollars at the bottom
Becomes the main support line
If it comes down from the current position, section 2
The main support line is divided.
In terms of the pattern, it is section 6+12.
If section 2 is touched right away,
There is a high possibility of a strong drop today,
So you should be careful.
- Those who are maintaining a long position
If you touch the 2nd section before 9 PM without touching the short position entry point at the top
You should operate at a loss cut price.
I think it would be good to adjust it according to leverage.
If it falls after touching the 1st section at the top
It becomes a vertical decline condition.
From the bottom, from the 3rd
Maximum Bollinger Band daily chart support line section
Please note that it can be pushed up to 100,685.5 dollars.
I have never changed my perspective suddenly or irresponsibly after leaving an analysis article.
I did my best until the end today.
Please use my analysis article so far only for reference and use
I hope you operate safely with principle trading and loss cut prices.
Thank you.

Gold Supported by Trade HopesGold traded around $3,360 per ounce on Thursday, supported by news of a US-Vietnam trade deal and ongoing dollar weakness.
The deal, which eases some tariffs on Vietnamese goods, increased hopes for further bilateral agreements. Meanwhile, softer US labor data, ADP figures showed the first payrolls drop in over two years, strengthened the case for Fed easing.
Tensions in the Middle East, with Iran halting cooperation with the UN nuclear agency, added a touch of geopolitical risk.
Resistance is at $3,395, while support holds at $3,330.

XAUUSD: Market analysis and strategy on July 3Gold technical analysis
Daily chart resistance level 3400, support level 3300
4-hour chart resistance level 3382, support level 3327
1-hour chart resistance level 3364, support level 3341
After bottoming out, the lowest point of yesterday's correction, 3327, has become an important support. Today's gold is still a strategy of buying at a low level. This idea can be maintained before the release of NFP employment data. Tomorrow, the US Independence Day will be closed for one day. The NFP data will be released in advance today, and the trading market will be closed in advance.
Judging from the current market trend, today it broke through the previous high of 3357. Today's Asian session slightly rose to 3365 and then quickly fell back to 3341. The low point of the Asian session retracement of 3341 is a small support. The second is the low point of 3333 in the US session yesterday. The support point of 3333/41 can be bought when the European session falls back. The possibility of a unilateral rise in the high point of today before the NFP data is small. I expect it to fluctuate and wait patiently for a pullback to buy. Today's NY market risk is relatively high. Please try to avoid trading during news time!
Buy: 3341near
Buy: 3333near

BTC COMING UP"I believe the price might face a rejection at these levels. I plan to continue my buys from the Fair Value Gap (FVG) zone marked with a dashed line below. Wishing everyone successful trades!

Short outlook on SilverLooking forward for the market to clear the liquidity on BSL , then sell " INTRADAY '
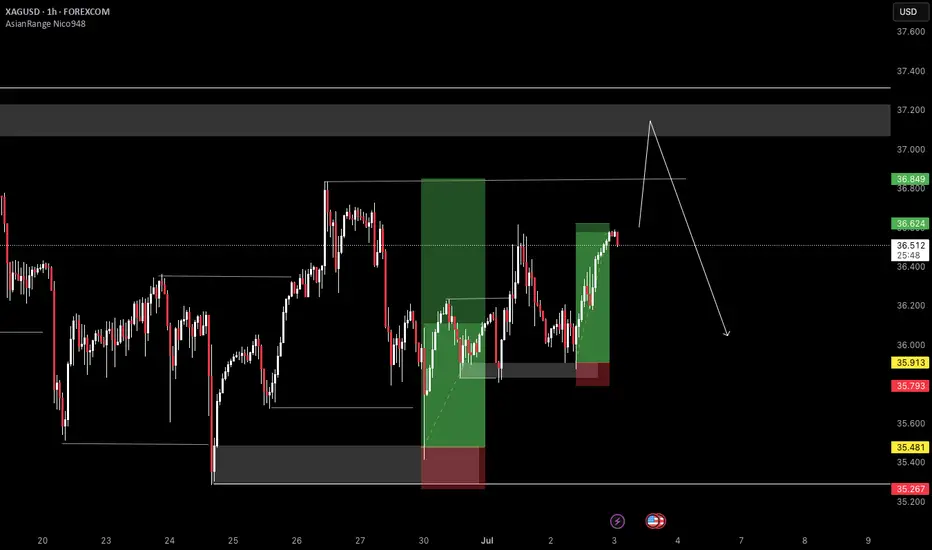
XAUUSDOn the Daily timeframe, I expect XAUUSD to move toward at least the 3500 level. The overall structure remains bullish, and the momentum suggests further upside potential.
On the H4 timeframe, the price has broken out of the bullish flag, closed above it, and has already retested the breakout zone. This confirms the breakout and supports the bullish continuation bias.

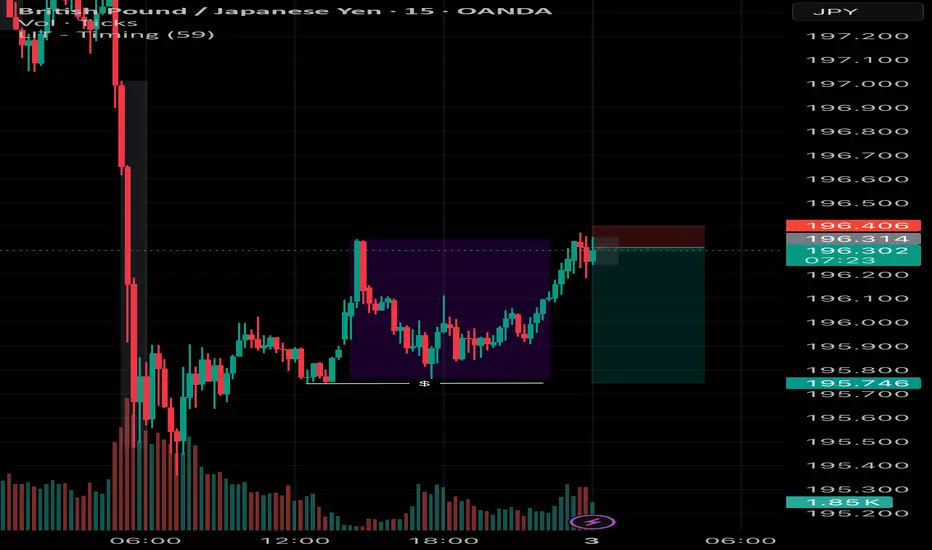
USDJPY is showing an historical patternThe USDJPY is forming a head and shoulders pattern and has a very clear support line at 140.
If the price goes below this line, we could see a big drop in the pair, with the first easy target at 130 and a second, more difficult target at 120. The risk is very low, and also, currency pairs allow you to use leverage to earn much higher profits.

Dogecoin! time for a big move?Hello traders. A small update on the current situation.
The price has been in consolidation since March, and its triangle is ending, I am counting on a powerful breakout in the next 3 weeks. On the other hand, if the price does not stay above 0.16 cents in the next week, the price may dive to the limits of strong support at 0.12 cents. Below we have a master slide to the limits of 0.06 cents, but I am not counting on it! I am counting on your careful observations and advice.
Best regards

DAX: Strong Growth Ahead! Long!
My dear friends,
Today we will analyse DAX together☺️
The market is at an inflection zone and price has now reached an area around 23,758.99 where previous reversals or breakouts have occurred.And a price reaction that we are seeing on multiple timeframes here could signal the next move up so we can enter on confirmation, and target the next key level of 23,821.90.Stop-loss is recommended beyond the inflection zone.
❤️Sending you lots of Love and Hugs❤️

How much higher for Platinum futures In this video I look at the current price of platinum on a higher tf and forecast where I believe the cool down to this rally might begin.
Using tools like the fib extension, volume profile and speed fan we are able to highlight a major reaction zone ahead at $1600 region .
Set alerts at these key levels for what might prove to be a solid short entry or a rejection , retest and claim for higher levels like the 1.618 ext .

SILVER: Will Go Up! Long!
My dear friends,
Today we will analyse SILVER together☺️
The price is near a wide key level
and the pair is approaching a significant decision level of 36.440 Therefore, a strong bullish reaction here could determine the next move up.We will watch for a confirmation candle, and then target the next key level of 36.607.Recommend Stop-loss is beyond the current level.
❤️Sending you lots of Love and Hugs❤️

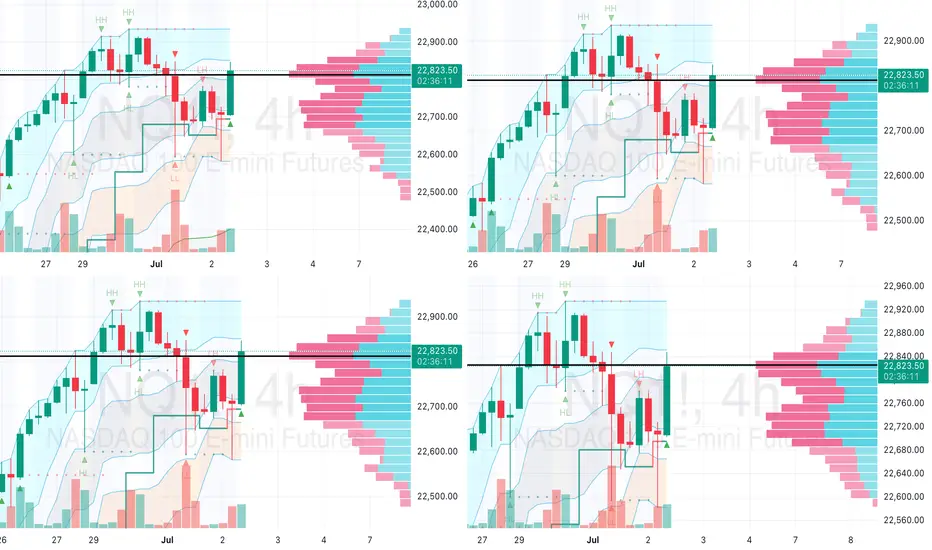
NQ (NASDAQ 100 E-Mini Futures) Market AnalysisKey Observations
The NQ is currently trading at 22,706.50, with a high of 22,847.50 and a low of 22,702.75, based on the 4-hour chart provided, timestamped at 11:22:26 UTC (7:22:26 AM EDT).
The price has pulled back from a recent high of 22,829.00 (recorded at 02:37:34) and is testing support near 22,700–22,720.
The market shows a short-term consolidation after a strong upward move, with potential for further direction depending on upcoming economic data.
Technical Analysis
Price Action: The chart displays a series of higher highs and higher lows since late June, indicating an overall uptrend. However, the recent red candles and rejection at 22,829.00 suggest a possible short-term reversal or pause. The current level of 22,706.50 is near a support zone marked by previous consolidation.
Volume Profile: The right-hand volume profile highlights high volume nodes (HVNs) between 22,700 and 22,829, with the point of control (POC) around 22,829.00. The pink bars (selling volume) dominate above 22,829, indicating strong resistance, while teal bars (buying volume) are concentrated around 22,700–22,720, suggesting a support area.
Support and Resistance:
Support: 22,700–22,720 (current level and volume-based support), with deeper support at 22,600–22,650 if the price breaks lower.
Resistance: 22,829.00 (recent high and POC), with a psychological barrier at 23,000 if bullish momentum resumes.
Indicators: The Market Profile (e.g., HH, HL, LH, LL) shows a value area narrowing near 22,700–22,829, indicating indecision. The presence of multiple timeframes (4-hour) suggests this is a key level for swing traders.
Market Context
The pullback aligns with recent economic data, including the June 2025 ADP employment report (released July 02), which reported a loss of 33,000 jobs, below the expected 100,000. This could signal economic slowdown, impacting tech-heavy indices like the NASDAQ 100.
Negative sentiment around Tesla, a significant NQ component, due to an Elon Musk-Donald Trump incident, may be contributing to the pressure.
The Nonfarm Payrolls report on July 03, 2025, is a critical upcoming event. A weaker result (forecasted at 110,000 jobs) could exacerbate selling, while a strong report might support a recovery.
Scenarios
Bullish Case: If the price holds above 22,700 and breaks 22,829 with increased buying volume, it could target 23,000. Look for a strong bullish candle to confirm.
Bearish Case: A break below 22,700 could see the price drop to 22,600–22,650, with further downside possible if selling intensifies.
Volatility: Expect increased volatility ahead of the Nonfarm Payrolls data, given its potential to sway market direction.
EURUSD: The Market Is Looking Down! Short!
My dear friends,
Today we will analyse EURUSD together☺️
The recent price action suggests a shift in mid-term momentum. A break below the current local range around 1.17808 will confirm the new direction downwards with the target being the next key level of 1.17671.and a reconvened placement of a stop-loss beyond the range.
❤️Sending you lots of Love and Hugs❤️
