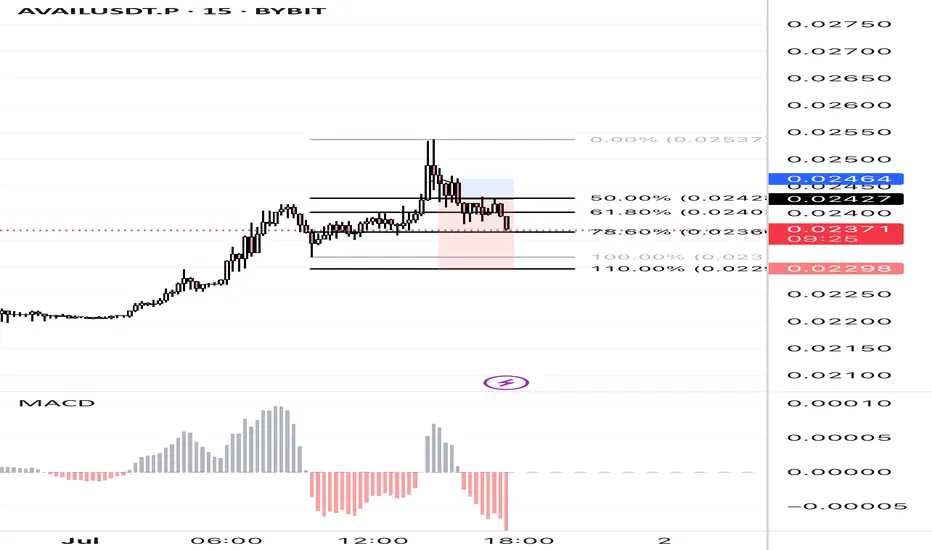
AVAILUSDT.P – Golden Zone Long Setup (Fib 61.8%–78.6% Reaction After a strong impulsive move, AVAILUSDT.P is retracing into the golden Fibonacci zone between 61.8% and 78.6%. Price action shows hesitation near 0.02360, suggesting potential support.
Watching closely for bullish confirmation to go long, with targets back toward the 0.02537 swing high. MACD weakening bearish momentum may align with entry confirmation.
#AVAILUSDT #BybitTrading #FibStrategy #CryptoLong #GoldenZone #FibonacciLevels #MACD #CopyTrading
Gann
GBPJPY SHORT DAILY FORECAST Q3 D1 W27 Y25GBPJPY SHORT DAILY FORECAST Q3 D1 W27 Y25
Professional Risk Managers👋
Welcome back to another FRGNT chart update📈
Diving into some Forex setups using predominantly higher time frame order blocks alongside confirmation breaks of structure.
Let’s see what price action is telling us today! 👀
💡Here are some trade confluences📝
✅Daily Order block identified
✅4H Order Block identified
✅1H Order Block identified
🔑 Remember, to participate in trading comes always with a degree of risk, therefore as professional risk managers it remains vital that we stick to our risk management plan as well as our trading strategies.
📈The rest, we leave to the balance of probabilities.
💡Fail to plan. Plan to fail.
🏆It has always been that simple.
❤️Good luck with your trading journey, I shall see you at the very top.
🎯Trade consistent, FRGNT X

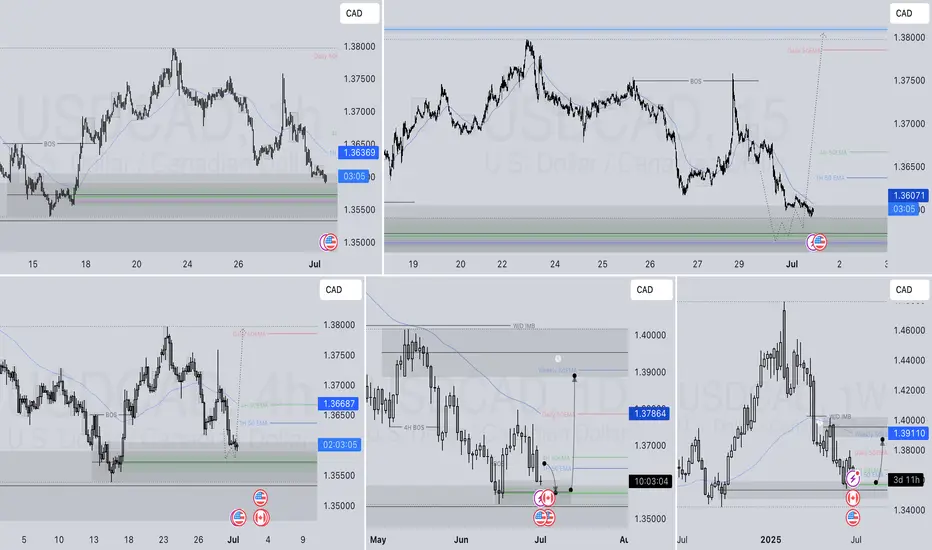
USDCAD LONG DAILY FORECAST Q3 D1 W27 Y25USDCAD LONG DAILY FORECAST Q3 D1 W27 Y25
IS USDCAD FINALLY READY TO LONG !
Professional Risk Managers👋
Welcome back to another FRGNT chart update📈
Diving into some Forex setups using predominantly higher time frame order blocks alongside confirmation breaks of structure.
Let’s see what price action is telling us today! 👀
💡Here are some trade confluences📝
✅Daily Order block identified
✅4H Order Block identified
✅1H Order Block identified
🔑 Remember, to participate in trading comes always with a degree of risk, therefore as professional risk managers it remains vital that we stick to our risk management plan as well as our trading strategies.
📈The rest, we leave to the balance of probabilities.
💡Fail to plan. Plan to fail.
🏆It has always been that simple.
❤️Good luck with your trading journey, I shall see you at the very top.
🎯Trade consistent, FRGNT X
AUDJPY SHORT FORECAST Q3 W27 D1 Y25AUDJPY SHORT FORECAST Q3 W27 D1 Y25
Professional Risk Managers👋
Welcome back to another FRGNT chart update📈
Diving into some Forex setups using predominantly higher time frame order blocks alongside confirmation breaks of structure.
Let’s see what price action is telling us today! 👀
💡Here are some trade confluences📝
✅Weekly Order Block Identified
✅Daily Order block identified
✅4H Order Block identified
✅15' Order block identified
🔑 Remember, to participate in trading comes always with a degree of risk, therefore as professional risk managers it remains vital that we stick to our risk management plan as well as our trading strategies.
📈The rest, we leave to the balance of probabilities.
💡Fail to plan. Plan to fail.
🏆It has always been that simple.
❤️Good luck with your trading journey, I shall see you at the very top.
🎯Trade consistent, FRGNT X

EURJPY SHORT DAILY FORECAST Q3 D1 W27 Y25EURJPY SHORT DAILY FORECAST Q3 D1 W27 Y25
Professional Risk Managers👋
Welcome back to another FRGNT chart update📈
Diving into some Forex setups using predominantly higher time frame order blocks alongside confirmation breaks of structure.
Let’s see what price action is telling us today! 👀
💡Here are some trade confluences📝
✅Daily Order block identified
✅4H Order Block identified
✅1H Order Block identified
🔑 Remember, to participate in trading comes always with a degree of risk, therefore as professional risk managers it remains vital that we stick to our risk management plan as well as our trading strategies.
📈The rest, we leave to the balance of probabilities.
💡Fail to plan. Plan to fail.
🏆It has always been that simple.
❤️Good luck with your trading journey, I shall see you at the very top.
🎯Trade consistent, FRGNT X


June 30 Bitcoin Bybit chart analysisHello
This is Bitcoin Guide.
If you "follow"
You can receive real-time movement paths and comment notifications on major sections.
If my analysis was helpful,
Please click the booster button at the bottom.
This is the Bitcoin 30-minute chart.
There is no separate indicator announcement today.
The weekly and daily charts are being adjusted at the same time as they are created.
The strategy was carried out based on the Nasdaq pattern and the Tether dominance pattern.
The long position entry section on the 25th, $106,746, was connected as is.
*When the blue finger moves,
It is a two-way neutral
short->long switching or long waiting strategy.
1. $108,138.1 short position entry section / stop loss price when orange resistance line is broken
2. $107,507.9 long position switching / stop loss price when green support line is broken
3. $108,507.9 long position 1st target -> Good 2nd target price
You can also use the long position re-entry indicated in the middle.
If it comes down right away without touching the short entry section at the top,
it is a long waiting strategy at the gap section of 107,102.7 dollars,
and the stop loss price is the same.
And, if it succeeds in rebounding within the purple support line today,
the reason it is safe from a long position is
because the low point of the weekly and daily candles created this week is maintained without additional deviation.
Please note that the 1st section at the bottom is a sideways market / the 2nd section is open up to the bottom.
Please use my analysis article so far only for reference and use,
and I hope you operate safely with the principle trading and stop loss price.
Thank you.

#PORTALUSDT NEXT MOVE ?#PORTAL
The price is moving within a descending channel on the 1-hour frame and is expected to break and continue upward.
We have a trend to stabilize above the 100 moving average once again.
We have a downtrend on the RSI indicator that supports the upward break.
We have a support area at the lower boundary of the channel at 0.0284, acting as strong support from which the price can rebound.
We have a major support area in green that pushed the price upward at 0.02750.
Entry price: 0.0288.
First target: 0.0297.
Second target: 0.0310.
Third target: 0.0325.
To manage risk, don't forget stop loss and capital management.
When you reach the first target, save some profits and then change the stop order to an entry order.
For inquiries, please comment.
Thank you.

USDZAR-NEUTRAL SELL strategy 3 hourly chart Reg. ChannelI am cautiously SELL since the trend is not strong, but likely it feels seeing lower levels. We need to retest 17.60s - 17.55s before it may become oversold short-term. GOD is firmer and this helps to support this theory for now.
Strategy SELL @ 17.7500-17.7850 and take profit near 17.6000.

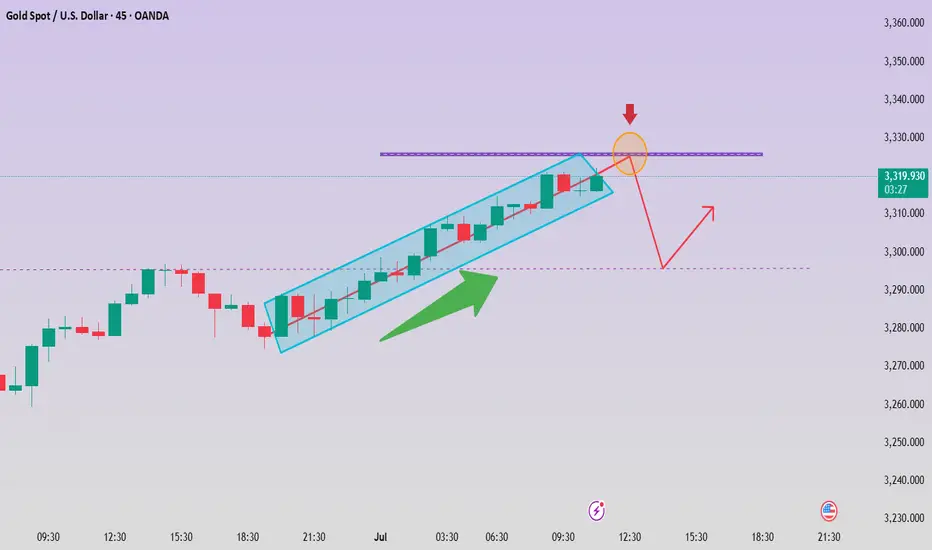
This is the reason why gold suddenly "changed its face"!
📣 Gold News
Spot gold closed up $28.59, or 0.87%, at $3,302.71 per ounce on Monday. Gold prices fell to around $3,246 per ounce in early Asian trading, the lowest level since May 29.
At 21:30 Beijing time on Tuesday, Federal Reserve Chairman Powell, European Central Bank President Lagarde, Bank of England Governor Bailey, Bank of Japan Governor Kazuo Ueda, and Bank of Korea Governor Lee Chang-yong will hold a group meeting.
Last Tuesday and Wednesday, Federal Reserve Chairman Powell attended a congressional hearing and said that the Fed needs more time to observe whether tariffs make inflation rise higher before considering cutting interest rates.
Powell said in his congressional testimony that he and most Fed officials expect inflation to start to pick up soon, and the Fed is not in a hurry to cut interest rates before that.
Powell said: "At present, we have good conditions to wait and further understand the possible development path of the economy before considering whether to adjust the policy stance." Yesterday, gold opened at $3381.6 and quickly fell back, reaching a low of $3248.8, then rebounded, rebounded in the early trading and touched $3270 and fell again, gold fell back, reaching a low of $3259.4, then gold did not continue to fall, and rebounded. Gold continued to rebound in the European and American markets, with the highest rebound in the US market reaching $3309.4, and finally closed at $3002.9 in the late trading. The monthly line closed with a long upper shadow line and a shooting star pattern. After such a pattern ended, today's gold rebounded high, and the upper resistance focused on the $3326 line. The rebound relied on the resistance below here to short, and the lower side looked at the $3295 line.
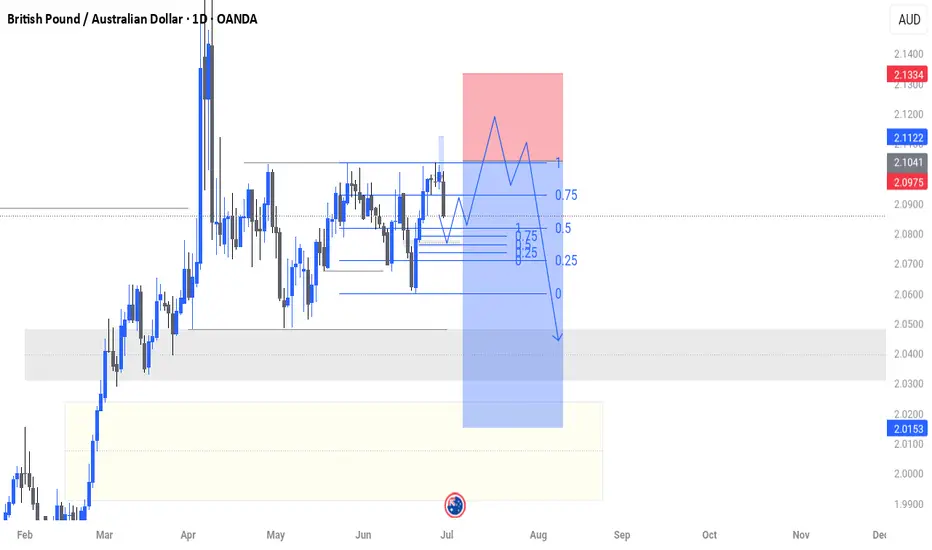
GBP AUD bearishGBP AUD has a buy side liquidity above the equal highs, which is the DOL to pull liquidity high and most probably create high of the week, before the bearish move.
XAUUSD: Market analysis and strategy on June 30Gold technical analysis
Daily chart resistance 3350, support 3225
4-hour chart resistance 3310, support 3245
1-hour chart resistance 3295, support 3260
From the 4-hour level, after gold fell to 3255 last Friday, the real candlestick chart was difficult to continue to fall, suggesting that the downward momentum has slowed down. It is necessary to pay attention to the possibility of double bottom support at 3245. At the same time, this is also the 0.618 support level of the golden section of the 3120-3452 band. With the MACD showing signs of bottom divergence, short-term operations are bearish, but the probability of rebound is also very high. The short-term support position below the market is near 3281, and the break will look at 3260-3247; the important pressure position is near 3295; the break will look at 3309-3313!
BUY: 3281near
BUY: 3260near
BUY: 3245near

GBPUSD AnalaysisGBPUSD Analaysis on 4H frame According to my own analysis strategy
Selling Zones :
1.35150 - 1.35300
1.35530 - 1.35720
buying zones
1.33427 - 1.33080
GOLD Analysis 23/6/2025Based on gold analysis using digital analysis, gold is rising to target the 3377-3387 zone,
then rebound and then target the 3410-3426 zone .
Next week's gold trend analysis strategy:Next week's gold trend analysis strategy:
1. News interpretation: Fed policy and market sentiment dominate the direction
✦ Review of key factors:
The situation in the Middle East has eased
The safe-haven demand for gold has declined, which is bearish for gold prices.
Fed Focus: PCE Price Index
If PCE data rises → Strengthen interest rate hike expectations → Gold prices are under pressure
If personal spending is weak → Interest rate hike expectations slow down → Favorable gold price rebound
Investors' wait-and-see sentiment heats up
→ There is no panic selling in the market, and it tends to fluctuate downward rather than plummet.
2. Technical analysis: Bearish dominance, pay attention to key support areas
Daily structure:
The bearish trend is clear, and the moving average system turns downward;
The price is running near the lower track of the Bollinger band, and there is a suspicion of short-term oversold;
The 3280-3295 area constitutes a pressure zone, which has not been broken after multiple tests.
Key points at the 4-hour level:
A step-down channel is clearly formed;
Support levels gradually move downward, a typical bearish pattern;
Lower support: 3270 → 3263 → 3250-3245
Upper pressure: 3280 → 3300 → 3310
III. Gold trend forecast for next week
📉 Main trend: bearish, short-term or bottoming out
If it falls to the 3245-3250 area, a short-term technical rebound can be expected;
After the rebound, it may be blocked again in the 3280-3295 range, suitable for short selling;
Unless it strongly recovers above 3310, it will be difficult to reverse the downward trend.
IV. Operation strategy suggestions (core)
Sell on highs 3285 - 3295 Stop loss 3310 Target 3255 / 3245 Layout short orders near resistance
Trend bottom-picking 3245 - 3250 Stop loss 3238 Target 3275 / 3280 Oversold rebound expected, try to buy long with a light position
Aggressive short selling near 3310 Stop loss above 3336 Target 3280 / 3263 Top and bottom conversion resistance level, if the test is not broken, short
V. Summary and Outlook
✅ Conclusion: Next week, the trend of gold will still be "high-short as the main and low-long as the auxiliary", focusing on the game between 3250 support and 3295 pressure level.
Gold has not yet broken out of the short structure, and the inertial decline after breaking 3295 will continue. It is recommended that traders avoid chasing ups and downs, strictly implement stop losses, and remain flexible.

DXY: Local Bullish Bias! Long!
My dear friends,
Today we will analyse DXY together☺️
The market is at an inflection zone and price has now reached an area around 96.706 where previous reversals or breakouts have occurred.And a price reaction that we are seeing on multiple timeframes here could signal the next move up so we can enter on confirmation, and target the next key level of 96.819.Stop-loss is recommended beyond the inflection zone.
❤️Sending you lots of Love and Hugs❤️

June 25 Bitcoin Bybit chart analysisHello
This is Bitcoin Guide.
If you "follow"
You can receive real-time movement paths and comment notifications on major sections.
If my analysis was helpful,
Please click the booster button at the bottom.
This is the Bitcoin 30-minute chart.
Nasdaq indicators will be announced at 11 o'clock shortly.
Nasdaq is rising vertically + renewing its all-time high.
Accordingly, I ignored the weekly MACD dead cross and
proposed the strategy for the pattern by substituting Tether dominance.
Although it is not visible on the screen,
I created today's strategy with the condition of maintaining the long position of $100,587.9 that was confirmed on the 23rd.
* One-way long position strategy when the red finger moves
1. $106,746 long position entry section / When the purple support line is broken
or when section 2 is touched, stop loss price
2. $108,66 long position 1st target -> Good 2nd -> Great 3rd target price
When section 1 at the top touches, it can be connected to an upward trend,
and section 2 is a sideways market.
At the very bottom and the very top,
I have indicated the maximum possible trend until tomorrow afternoon.
Up to this point, I ask that you simply use my analysis for reference and use only
I hope that you will operate safely with the principle of trading and stop loss.
Thank you.

SILVER: Strong Growth Ahead! Long!
My dear friends,
Today we will analyse SILVER together☺️
The price is near a wide key level
and the pair is approaching a significant decision level of 36.170 Therefore, a strong bullish reaction here could determine the next move up.We will watch for a confirmation candle, and then target the next key level of 36.429.Recommend Stop-loss is beyond the current level.
❤️Sending you lots of Love and Hugs❤️

USDCAD LONG DAILY FORECAST Q3 D30 W27 Y25USDCAD LONG DAILY FORECAST Q3 D30 W27 Y25
Professional Risk Managers👋
Welcome back to another FRGNT chart update📈
Diving into some Forex setups using predominantly higher time frame order blocks alongside confirmation breaks of structure.
Let’s see what price action is telling us today! 👀
💡Here are some trade confluences📝
✅Daily Order block identified
✅4H Order Block identified
✅1H Order Block identified
🔑 Remember, to participate in trading comes always with a degree of risk, therefore as professional risk managers it remains vital that we stick to our risk management plan as well as our trading strategies.
📈The rest, we leave to the balance of probabilities.
💡Fail to plan. Plan to fail.
🏆It has always been that simple.
❤️Good luck with your trading journey, I shall see you at the very top.
🎯Trade consistent, FRGNT X

EURUSD: Will Go Down! Short!
My dear friends,
Today we will analyse EURUSD together☺️
The recent price action suggests a shift in mid-term momentum. A break below the current local range around 1.17225 will confirm the new direction downwards with the target being the next key level of 1.17114.and a reconvened placement of a stop-loss beyond the range.
❤️Sending you lots of Love and Hugs❤️

GOLD: The Market Is Looking Down! Short!
My dear friends,
Today we will analyse GOLD together☺️
The in-trend continuation seems likely as the current long-term trend appears to be strong, and price is holding below a key level of 3,295.36 So a bearish continuation seems plausible, targeting the next low. We should enter on confirmation, and place a stop-loss beyond the recent swing level.
❤️Sending you lots of Love and Hugs❤️
