Nifty 50 Hourly Chart Update 📊 Nifty 50 Hourly Chart Update 📊
Nifty’s leap hits 25,600 🚀
But signs of a short-term pause are showing up… ⚠️
🔹 RSI at 75 🔼
🔹 ATR dropping 📉
🔹 Price at Pitchfork & Gann Square resistance 🎯
📉 A mild reversal may be on the cards before the next move.
⏳ A better entry opportunity might come in the next few days. Stay patient, stay sharp! ⚔️📅
Gann

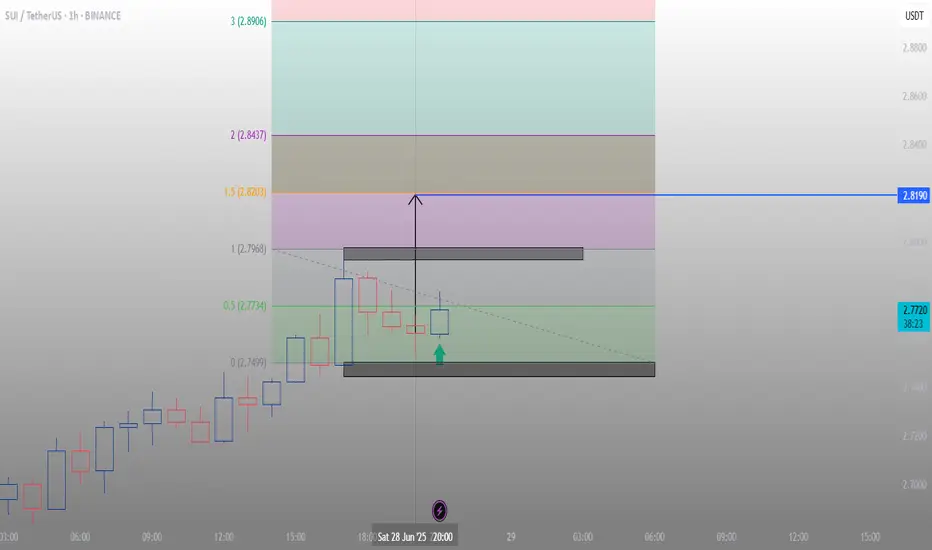
sui usdt tradeBased on the time analysis and the blocks created, I believe the target shown in the image is the next price target.
Cant Stop Wont Stop GameStopLast Weekly Golden Cross was January 25th, 2021.
We are now coming very close to our next Weekly Golden Cross 4 years later.
Fast MA on the Rainbow Ribbon has crossed over the Slow MA.
OBV has spiked and been building up in the same manner.
Stochastic-RSI is almost at ultra oversold & is generally a very safe indicator that the bottom is in.
IV is dangerously low & ready to break out hard.
Just like 4 years ago.
💎🤘🚀
xoxo - Bathsalt

EURGBP WEEKLY HIGHER TIME FRAME FORECAST Q3 W27 Y25EURGBP WEEKLY HIGHER TIME FRAME FORECAST Q3 W27 Y25
Professional Risk Managers👋
Welcome back to another FRGNT chart update📈
Diving into some Forex setups using predominantly higher time frame order blocks alongside confirmation breaks of structure.
Let’s see what price action is telling us today! 👀
💡Here are some trade confluences📝
✅Weekly 50EMA Rejection
✅Daily Order block identified
✅4H Order Block identified
🔑 Remember, to participate in trading comes always with a degree of risk, therefore as professional risk managers it remains vital that we stick to our risk management plan as well as our trading strategies.
📈The rest, we leave to the balance of probabilities.
💡Fail to plan. Plan to fail.
🏆It has always been that simple.
❤️Good luck with your trading journey, I shall see you at the very top.
🎯Trade consistent, FRGNT X

BTCUSD TRADE SETUP 📈 **Bitcoin (BTC/USD) 1H Chart Analysis — June 28, 2025**
🔍 **Pattern Identified: Bullish Flag Breakout**
🧠 **1. Market Context**
* This is the **1-hour chart** of **BTC/USD** on Binance.
* Price recently formed a **bullish flag pattern**, which is a **continuation pattern** signaling a potential breakout in the **direction of the previous trend (upward)**.
🔧 **2. Technical Breakdown**
🔹 **Trend Before the Flag**
* Price had a strong **impulsive move up** from \~105,000 to \~107,800.
* That was followed by a **consolidation phase** forming a downward sloping **channel** (blue parallel lines), creating the **flag**.
🔹 **Flag Channel**
* Price oscillated inside this flag for nearly 2 days (June 26–28).
* The **channel** is clearly defined, and price **respected both upper and lower bounds** during the consolidation.
🚀 **3. Breakout Confirmation**
* Price has now **broken out of the upper boundary** of the flag.
* A clean **break and candle close** above the trendline suggests **bullish momentum** is returning.
* This breakout is occurring around the **107,400–107,800** zone, which is also a **key structure level** acting as local resistance.
---
🎯 **4. Trade Setup**
✅ **Entry:**
* Around **107,400–107,800**, post-confirmation of the breakout.
❌ **Stop-Loss (SL):**
* Placed just below the **flag support / demand zone**, around **106,800**.
* This protects against a fake breakout or pullback into the flag.
🎯 **Target (TP):**
* Projected at **110,000**, which is aligned with the height of the initial flagpole projected from the breakout point.
* This also represents a psychological round number and a previous resistance level.
---
📊 **Risk-Reward Ratio (RRR)**
* **RRR = \~3:1**
* For every \$1 risked, the potential reward is \$3 — **excellent reward structure**.
---
📌 **Key Insights for the Traders**
* This is a **classic bullish flag breakout** play—very reliable in trending markets.
* **Volume confirmation** (not shown in chart but should be checked live) is important — higher volume during breakout gives stronger conviction.
* Watch for a possible **retest of the breakout level** (around 107,800) before the next move up.

USOIL: Next Move Is Up! Long!
My dear friends,
Today we will analyse USOIL together☺️
The recent price action suggests a shift in mid-term momentum. A break above the current local range around 65.100 will confirm the new direction upwards with the target being the next key level of 65.468 and a reconvened placement of a stop-loss beyond the range.
❤️Sending you lots of Love and Hugs❤️

NG1!: Target Is Down! Short!
My dear friends,
Today we will analyse NG1! together☺️
The in-trend continuation seems likely as the current long-term trend appears to be strong, and price is holding below a key level of 3.745 So a bearish continuation seems plausible, targeting the next low. We should enter on confirmation, and place a stop-loss beyond the recent swing level.
❤️Sending you lots of Love and Hugs❤️

NI225: Move Down Expected! Short!
My dear friends,
Today we will analyse NI225 together☺️
The market is at an inflection zone and price has now reached an area around 40,150.79 where previous reversals or breakouts have occurred.And a price reaction that we are seeing on multiple timeframes here could signal the next move down so we can enter on confirmation, and target the next key level of 39,753.50..Stop-loss is recommended beyond the inflection zone.
❤️Sending you lots of Love and Hugs❤️

#TAI/USDT#TAI
The price is moving within a descending channel on the 1-hour frame, adhering well to it, and is heading for a strong breakout and retest.
We are experiencing a rebound from the lower boundary of the descending channel. This support is at 0.090600.
We are experiencing a downtrend on the RSI indicator, which is about to break and retest, supporting the upward trend.
We are heading for stability above the 100 Moving Average.
Entry price: 0.09355
First target: 0.09900
Second target: 0.10380
Third target: 0.11000

Complete Analysis of DOGE/USDT 4hComplete Analysis of DOGE/USDT 4h
The chart suggests a transition phase toward an uptrend.
Moving averages are beginning to slope upward, indicating a potential trend reversal. The MACD shows weakening selling pressure and is approaching a bullish crossover, which often precedes upward price movement.
Entry zones: Between 0.14452 and 0.15185 — favorable areas for position accumulation.
Price targets:
First target: 0.20455 (a key resistance zone).
Second target: 0.22942, where stronger selling pressure may emerge.
Risk management: A suggested stop-loss at 0.13561 to protect capital if the anticipated move fails.
If the price breaks and consolidates above 0.17, the market could gain momentum to reach the projected targets. Monitor volume during breakout candles to confirm the presence of buying flow.

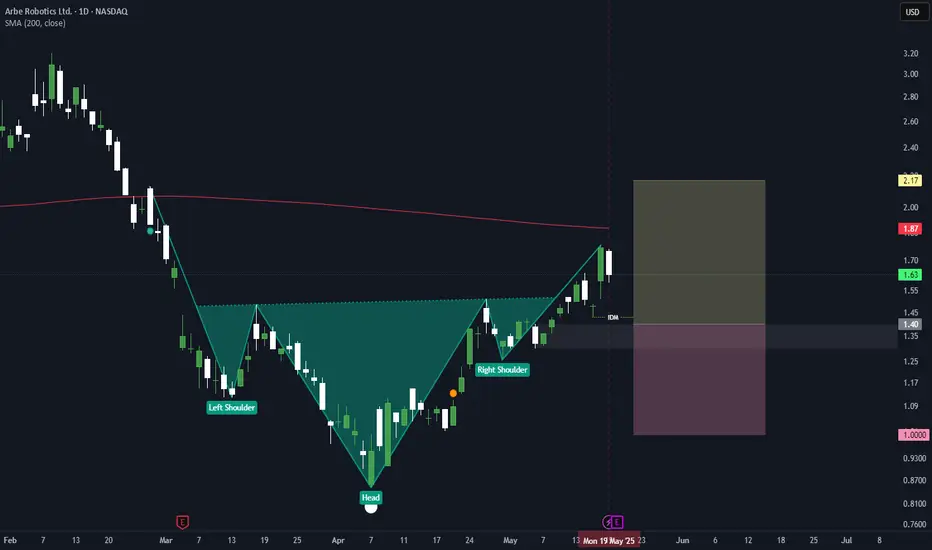
Head and ShouldersBullish move with breakout of neckline, it may have retested the neckline or will test again.
but now or wait for entry confirmation at shown level.
Not a financial advice.
Share your thoughts with me
Only all market sellllll This market is just liquidating and scares you into shorting, and suddenly it drops terribly, so if you have a short trade, hold until the first target is 75,000 and the second target is 39,000.😜😜😜😜😜

APT at 4.78 $ Historic Support – Massive Reversal Incoming?#APT
The price is moving within a descending channel on the 1-hour frame and is expected to break and continue upward.
We have a trend to stabilize above the 100 moving average once again.
We have a downtrend on the RSI indicator that supports the upward break.
We have a support area at the lower boundary of the channel at 4.78, acting as strong support from which the price can rebound.
We have a major support area in green that pushed the price higher at 4.60.
Entry price: 4.88
First target: 5.047
Second target: 5.19
Third target: 5.35
To manage risk, don't forget stop loss and capital management.
When you reach the first target, save some profits and then change your stop order to an entry order.
For inquiries, please comment.
Thank you.

Bullish strategy around 3270 in US trading
Gold prices (XAU/USD) once again came under selling pressure during the Asian session on Friday, falling back below $3,300 following a lackluster performance the day before. Gold prices are approaching a two-week low hit on Tuesday as investors await the release of the US personal consumption expenditures (PCE) price index. This key inflation indicator is expected to provide a new interpretation of the Fed's policy outlook and could significantly affect the direction of the US dollar (USD), ultimately determining the short-term direction of this non-yielding gold.
Selling pressure last weekend caused gold prices to fall below 3300, and today the selling pressure continued to fall
⭐️Set gold price:
🔥Sell gold area: 3326-3328 SL 3333
TP1: $3315
TP2: $3302
TP3: $3290🔥
Buy gold area: $3248-$3250 SL $3243
TP1: $3260
TP2: $3270
TP3: $3280⭐️


Gold: Market analysis and strategy for June 27Gold technical analysis
Daily chart resistance level 3350, support level 3250
4-hour chart resistance level 3340, support level 3245
1-hour chart resistance level 3300, support level 3280
Technical indicators show that the 4-hour moving average system shows a dead cross arrangement, and the MACD indicator dead cross continues. The gold price has fallen below the lower track support of the Bollinger Band, and the Bollinger Channel is narrowing. The short-term price is in a low-level weak consolidation pattern.
The 1-hour chart price broke the previous low of 3295, but the price is oversold and may rebound in the short term. The short-term support level below is around 3280. If it falls below, continue to look at the 3271-3245 range; the important pressure level is around 3300!
If there is a short-term rebound before the NY market, wait until the rebound before continuing to sell! The current minimum is 3279. After the short-term stabilization, refer to the resistance of 3300/3310 to sell.
Sell: 3300near
Sell: 3310near

a Clear indication of breakout for Sun Pharma keep it on trackI have jotted down the Gann Box of 90 days. I have place Gann Box together to understand the trend line of Sun Pharma

US30: Local Bearish Bias! Short!
My dear friends,
Today we will analyse GOLD together☺️
The price is near a wide key level
and the pair is approaching a significant decision level of 43,673.57 Therefore, a strong bearish reaction here could determine the next move down.We will watch for a confirmation candle, and then target the next key level of 43,576.88..Recommend Stop-loss is beyond the current level.
❤️Sending you lots of Love and Hugs❤️

EURUSD: Strong Growth Ahead! Long!
My dear friends,
Today we will analyse EURUSD together☺️
The recent price action suggests a shift in mid-term momentum. A break above the current local range around 1.17284 will confirm the new direction upwards with the target being the next key level of 1.17538 and a reconvened placement of a stop-loss beyond the range.
❤️Sending you lots of Love and Hugs❤️

GOLD: Will Go Up! Long!
My dear friends,
Today we will analyse GOLD together☺️
The in-trend continuation seems likely as the current long-term trend appears to be strong, and price is holding above a key level of 3,274.66 So a bullish continuation seems plausible, targeting the next high. We should enter on confirmation, and place a stop-loss beyond the recent swing level.
❤️Sending you lots of Love and Hugs❤️

SILVER: The Market Is Looking Down! Short!
My dear friends,
Today we will analyse SILVER together☺️
The market is at an inflection zone and price has now reached an area around 35.998 where previous reversals or breakouts have occurred.And a price reaction that we are seeing on multiple timeframes here could signal the next move down so we can enter on confirmation, and target the next key level of 35.727..Stop-loss is recommended beyond the inflection zone.
❤️Sending you lots of Love and Hugs❤️

LONG SPX TILL 6300+Hi,
I am publishing this idea for educational purpose. I beleive break out has done and spx should touch 6300 t0 6400 zone in future soon.

EUR/JPY Analysis – Flag Breakout Signals Further UpsideHello Traders,
It's been a while. I trust you are good.
Kindly find below my analysis of EURJPY currency pair.
Overview:
EUR/JPY has been consolidating within a bullish flag pattern, characterized by lower highs and lower lows over the past few trading sessions. Price action has now broken above the flag’s resistance, indicating a possible continuation of the broader bullish trend.
Idea:
The breakout above the bullish flag suggests that bulls are regaining control. Price is currently hovering around 169.370, having just cleared the wedge’s resistance line.
Key levels to monitor:
1. Support Zone: Around 169.200–169.300
2. Resistance Level: 169.699
Trade setup:
Entry: On a successful breakout or break and retest of 169.200–169.300.
Stop Loss: Below 168.816 (beneath the flag's support and recent swing low).
Targets: TP1: 169.699, TP2: 170.000–170.200
Conclusion:
EUR/JPY has broken out of a bullish flag pattern, signaling momentum shift in favor of buyers. If price sustains above the breakout zone or clears 169.699 resistance, we may see an extended rally toward the 170.000 mark. Trade with caution.
Cheers and happy trading.
