Asian markets peaked today, and are up for multi month declinePeak in Asian markets today, together with Germany yesterday and US, the whole world will be selling equities upcoming months with such bad trade and job perspectives.
Gann

USDX-NEUTRAL BUY strategy Daily chart Reg.ChannelThe index is still under pressure, but am slightly cautious on SELL as we are near support 98.40 area, and as long it holds we should expect some recovery. Channel wise we have room further down.
Strategy BUY 98.60 - 98.75 and take profit near 99.75 for now. However, break below mentioned support opens 96.50 and lower.

6/6 Friday XauUsd 6/6 Friday,
Monthly: 1st week
Weekly:
Daily: Bearish candle baih bolov uu, Daily iin BISI shalgahar
4hr: SIBI 50% hureed dooshloh boluu gej bodoj bn

#DEGO/USDT#DEGO
The price is moving within a descending channel on the 1-hour frame and is expected to break and continue upward.
We have a trend to stabilize above the 100 moving average once again.
We have a downtrend on the RSI indicator that supports the upward move with a breakout.
We have a support area at the lower limit of the channel at 1.19, acting as strong support from which the price can rebound.
Entry price: 1.26
First target: 1.31
Second target: 1.37
Third target: 1.46

#TRUMP/USDT#TRUMP
The price is moving within a descending channel on the 1-hour frame and is expected to break and continue upward.
We have a trend to stabilize above the 100 moving average once again.
We have a downtrend on the RSI indicator that supports the upward move with a breakout.
We have a support area at the lower boundary of the channel at 9.53, acting as strong support from which the price can rebound.
Entry price: 9.70
First target: 10.07
Second target: 10.40
Third target: 10.70

#CAKE/USDT#CAKE
The price is moving within a descending channel on the 1-hour frame and is expected to break and continue upward.
We have a trend to stabilize above the 100 moving average once again.
We have a downtrend on the RSI indicator that supports the upward move with a breakout.
We have a support area at the lower limit of the channel at 2.29, acting as strong support from which the price can rebound.
Entry price: 2.30
First target: 2.35
Second target: 2.40
Third target: 2.46

Gold ScalpWe are anticipating a High probable Buy Scalp, even though the Market seems to be BEarish, but the higher Time frame's still Bullish.
Follow the proper Risk management for Each Trade, this is a probability Game.

DXY: Local Bearish Bias! Short!
My dear friends,
Today we will analyse DXY together☺️
The market is at an inflection zone and price has now reached an area around 98.335 where previous reversals or breakouts have occurred.And a price reaction that we are seeing on multiple timeframes here could signal the next move down so we can enter on confirmation, and target the next key level of 98.090..Stop-loss is recommended beyond the inflection zone.
❤️Sending you lots of Love and Hugs❤️

GOLD: Absolute Price Collapse Ahead! Short!
My dear friends,
Today we will analyse GOLD together☺️
The price is near a wide key level
and the pair is approaching a significant decision level of 3,348.94 Therefore, a strong bearish reaction here could determine the next move down.We will watch for a confirmation candle, and then target the next key level of 3,329.82..Recommend Stop-loss is beyond the current level.
❤️Sending you lots of Love and Hugs❤️

BULLISHCompare your analysis with mine, first but is now, second buy is shown but SL for each trad eis shown
EURUSD: Will Go Up! Long!
My dear friends,
Today we will analyse EURUSD together☺️
The recent price action suggests a shift in mid-term momentum. A break above the current local range around 1.14403 will confirm the new direction upwards with the target being the next key level of 1.14764 and a reconvened placement of a stop-loss beyond the range.
❤️Sending you lots of Love and Hugs❤️

6 June Nifty breakout & breakdown levels
🔼 CALL (CE) Buy Levels :
24,680 (Opening Support Zone)
CE entry possible if price10m holds above this level.
24,923 (Above Positive Trade View)
Strong bullish sentiment above this zone.
Buy CE if 10-min candle holds above this level.
24518 (Above 10m hold ce by level) bullish momentum
🔽 PUT (PE) Buy Levels:
24,680 (Opening below Resistance Zone)
Below 24,518 (Below 10m Hold PE by Zone)
Below 25,130 (Below 10m PE by Risky Zone)
Risky but possible PE buy if fails to hold
Below 25,330 (Below 10m hold PE by Safe Zone)

Why Gold and Not Forex Pairs?The truth behind XAUUSD’s sniper potential.
— by GoldFxMinds
Let’s get real. If you’ve ever asked:
“Why does everyone trade Gold? Why not EURUSD, GU, or NAS?”
Here’s the straight answer from a sniper’s perspective 👇
🔑 1. Structure Never Lies on Gold
Gold respects pure price action like no other pair.
Break of Structure, CHoCH, FVG, OB, liquidity sweeps — they hit perfectly. No fake noise, just clean technicals.
📌 Gold tells the truth. The question is: Can you read it?
🚀 2. Massive Intraday Range
XAUUSD can move 200–500 pips in a single session
EURUSD? You’re lucky with 80–100 pips.
More volatility = more sniper opportunities.
But only for those with discipline and a plan.
🌍 3. Gold Reacts to the Real World
Unlike other pairs that follow interest rates or risk sentiment, Gold responds directly to fear, war, and uncertainty.
War in the Middle East? Gold pumps.
Fed chaos? Gold spikes.
Unemployment shock? Gold shifts.
It’s a true macro indicator — a safe haven in times of global panic.
Master the macro + structure, and you’ll never be lost.
🔁 4. Repeating Liquidity Patterns
Gold runs on liquidity traps, sweep-and-reverse setups, and smart money moves.
Once you master its rhythm, it becomes a game of patience — not guessing.
🧠 5. Sniper Logic Wins, Not Indicators
Most pairs need heavy indicator confluence.
Gold?
Just structure, liquidity, OBs, and confirmation.
Clean. Precise. Tactical.
🔥 6. It’s a Mirror of Your Mindset
Gold punishes greed. Gold exposes hesitation.
It will show you exactly what you lack as a trader.
If you respect the chart and your rules — it will reward you.
If not, it humbles you instantly.
💛 So Why Gold?
Because it’s the only chart that gives you truth if you learn to read it.
Not noise. Not manipulation.
Just structure, liquidity, and opportunity.
Trade it right — and Gold will reward you with clarity.
📍 Follow GoldFxMinds if you’re tired of guessing
and ready to learn how to read price like a sniper.
💬 Drop a comment:
Why did you choose Gold?
Let’s build this community with logic, not hype.
— GoldFxMinds 🔥

SILVER: The Market Is Looking Up! Long!
My dear friends,
Today we will analyse SILVER together☺️
The in-trend continuation seems likely as the current long-term trend appears to be strong, and price is holding above a key level of 35.467 So a bullish continuation seems plausible, targeting the next high. We should enter on confirmation, and place a stop-loss beyond the recent swing level.
❤️Sending you lots of Love and Hugs❤️

Eternal Ltd Daily Trend AnalysisEternal Ltd (formerly Zomato Ltd) has broken out of a consolidation phase, indicating the potential start of a bullish trend. The stock appears poised to reach the target level of ₹285 in the near term.
Disclaimer: Traders are encouraged to perform their own technical analysis and implement proper risk management before initiating any positions.

USDZAR-BUY strategy 3-Daily chart Reg. ChannelThe pair has after all moved little lower, and I became hesitant bailing out of the SELL. Now that we have moved lower, and considering its oversold status (reasonable), we should start considering the BUY strategy for a medium-term basis.
Strategy BUY @ 17.6675 - 17.7350 and take profit near 17.9750 for now.

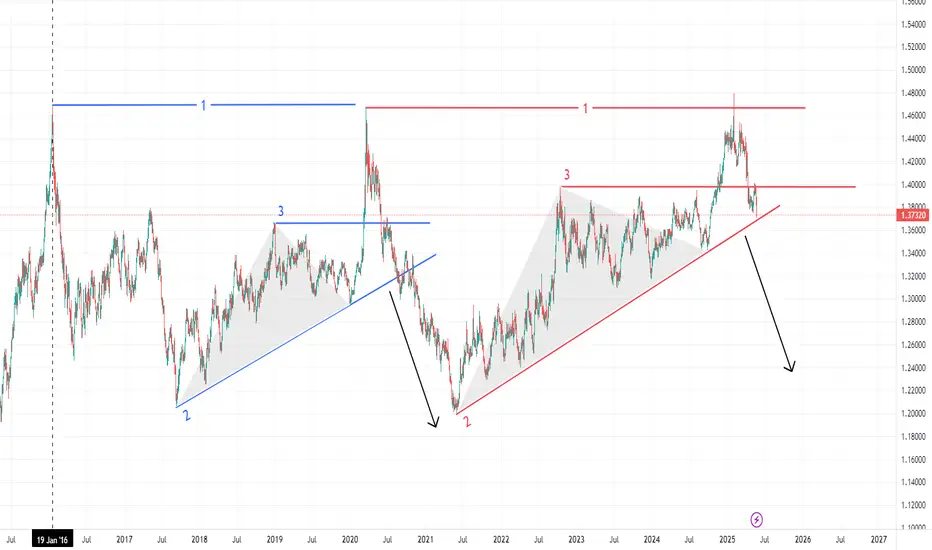
USDCAD A chance for Fall DownI see A chance for Fall down after breaks LEVEL 2 (trend line) similar to what happened before.
lets wait and see will happened next week.
Do you agree ? what's your idea ?
XAUUSD: Market Analysis and Strategy for June 4Gold technical analysis
Weekly chart resistance 3500, support below 2955
Daily chart resistance 3412, support below 3350-22
Four-hour chart resistance 3390, support below 3322
One-hour chart resistance 3378, support below 3322
Gold news analysis: On Tuesday (June 3) in the NY market, spot gold accelerated its decline, falling to around $3333/ounce, a sharp drop of $59 during the day. Mainly affected by the rebound of the US dollar and the rebound in risk sentiment. Affected by the rise of risky assets the day before, the demand for safe-haven assets was weakened, causing some gold bulls to choose to take profits. However, the market remains vigilant about the global situation. The continued expansion of the US fiscal deficit, the escalation of trade tensions between Asian powers and the United States, and the failure of the second round of peace talks between Ukraine and Russia have made the market risk aversion still support gold.
Gold operation suggestions: From the current trend analysis, the support below focuses on the support of 3350-3322. The pressure above focuses on the suppression near the one-hour level 3378 and the four-hour level 3390. The short-term long-short strength and weakness watershed 3322. Continue to buy on dips before the four-hour level falls below this position.
Buy: 3322near SL: 3317
Buy: 3350near SL: 3345
Daily sharing →

XAUUSDDaily time frame is on a uptrend since the start of the year.
We have also a bullish flag broken and retest.
With all the Geopolitical uncertainty, we gonna go up.

TESLA - Slava NikoleTesla stock market open on Easter Monday morning for the next few weeks ago so I'm not too concerned that you can use your own business you can get a ride for you to get a new phone yet but it can get it can get it can get a new car can be done in about the election of it I can be a

SP500 would you capture or just let it slip?His palms are sweaty
Knees weak, arms spaghetti
His nervous
But on the surface
He looks calm and ready

5 june Nifty50 brekout & break down level
🔼 Call Option (CE) Trade Levels:
25,118 – Above 10m Closing → Short covering possible (Bullish breakout zone)
24,918 – Above 10m Hold → CE by zone (Bullish confirmation zone)
24,437.70 – 10m Hold → CE by risky zone (Uncertain upside attempt)
24,268 – CE by safe zone (Good support; possible long build-up)
🔽 Put Option (PE) Trade Levels:
25,118 – Below 10m → PE by safe zone (Bearish rejection from breakout)
24,918 – Below 10m → PE by risky zone
24,420 – Below 10m Hold → PE by zone (Bearish confirmation)
Below 24,268 – Unwinding possible (Breakdown leval)
📊 Neutral / Trade View Levels:
24,732 – Above this → Positive trade view
24,700 zone – Below this → Negative trade view
24,570 –flat Opening support
24,570 –gap down Opening resistance zone

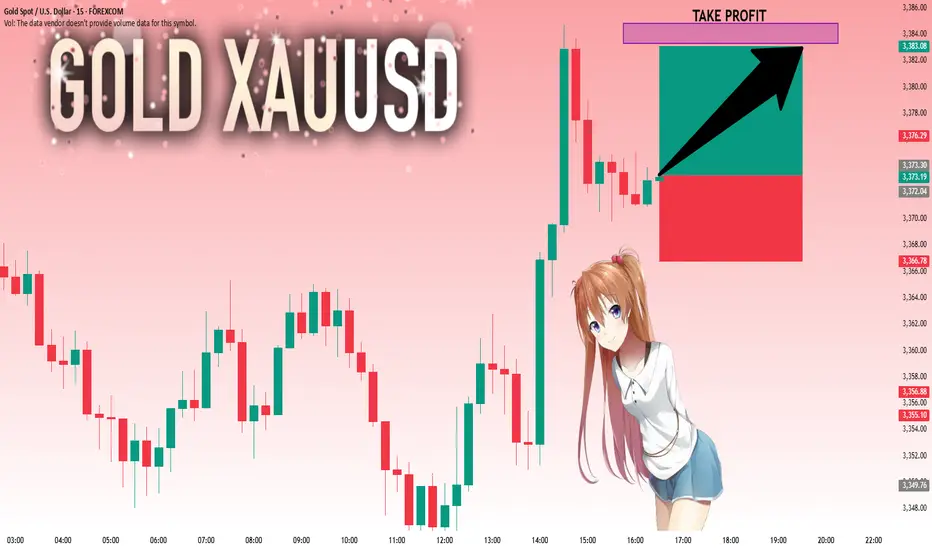
GOLD: Strong Bullish Sentiment! Long!
My dear friends,
Today we will analyse GOLD together☺️
The market is at an inflection zone and price has now reached an area around 3,373.30 where previous reversals or breakouts have occurred.And a price reaction that we are seeing on multiple timeframes here could signal the next move up so we can enter on confirmation, and target the next key level of 3,383.29.Stop-loss is recommended beyond the inflection zone.
❤️Sending you lots of Love and Hugs❤️