$ETHAs uncertainty around war escalates, capital looks for liquid, borderless, and passive alternatives.
That’s where CRYPTOCAP:ETH steps in.
Liquidity pools offer passive yield, even when traditional markets are shaky.
In chaos, Ethereum becomes cashflow tech.
Gann
HBAR to $1.00If price breaks between the 50%-61.8% retracement I'm looking for a long position to $1.00.


This 15-minute Gold chart shows a descending channel,
This 15-minute Gold chart shows a descending channel, indicating a bearish trend. The price is currently near resistance (~$3,374–$3,384), and the chart suggests a potential rejection from this zone, leading to a sell-off toward $3,327–$3,340. Two scenarios are shown:
Primary idea: Price will reject resistance and drop.
Alternative: Small consolidation before deciding direction.
Bias: Bearish unless price breaks and holds above $3,384.

Short BTC. Next price to touch is 87 to 89KHi,
Market has broken down the structure. When market breaks its structure it continue to fall till the next structure shows its presence which comes under area of 89K.
DIY its for educational purpose.
Happy trading.

XDC to $0.35 We have reached in between 50& and 61.8% retracement after breakout from triangle pattern. Looking for XDC to go to 141% price target.


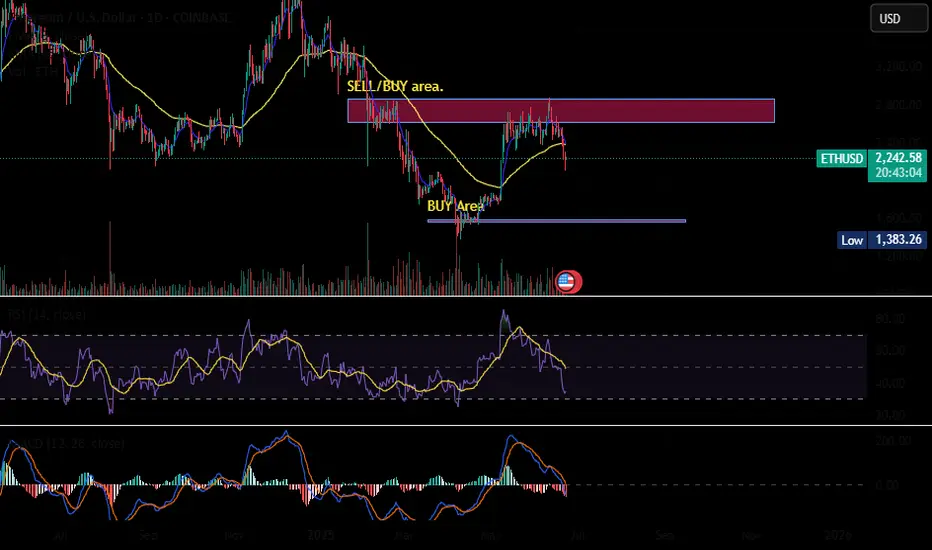
ETHUSD: Will Go Up! Long!
My dear friends,
Today we will analyse ETHUSD together☺️
The price is near a wide key level
and the pair is approaching a significant decision level of 2,270.9 Therefore, a strong bullish reaction here could determine the next move up.We will watch for a confirmation candle, and then target the next key level of 2,290.8.Recommend Stop-loss is beyond the current level.
❤️Sending you lots of Love and Hugs❤️

BTCUSD: The Market Is Looking Down! Short!
My dear friends,
Today we will analyse BTCUSD together☺️
The recent price action suggests a shift in mid-term momentum. A break below the current local range around 102,641.61 will confirm the new direction downwards with the target being the next key level of 102,364.09.and a reconvened placement of a stop-loss beyond the range.
❤️Sending you lots of Love and Hugs❤️

PYTH/USDT Setup — The Calm Before the Boom?
📅 Entry Zones: June 23 & June 30 — prime moments before potential breakout.
🟨 Strong demand zone just below — smart money likely watching this closely.
💥 A breakout above the wedge could ignite a rally toward:
→ 0.099
→ 0.105
→ 0.115+ (where fireworks begin)
🧲 Don’t sleep on this — once the move starts, it might be gone in minutes.
Buy the fear, ride the squeeze.

XAUUSDXAUUSD Gold its looking for 3.500, breaking that and closing above we can look for something after that.
Geopolitical situations its also pushing gold to the upside.

SEIUSDT.P – Long Setup in Fib Golden Zone with Volatility CompreSEIUSDT.P is consolidating after a strong bullish move. Price is now retracing into the 61.8–78.6% Fibonacci zone, which historically acts as a key reversal area. Multiple rejections and compression in this range suggest a potential bounce.
MACD shows signs of bearish momentum fading. If confirmed, this could be a solid risk-managed long with upside toward previous highs.

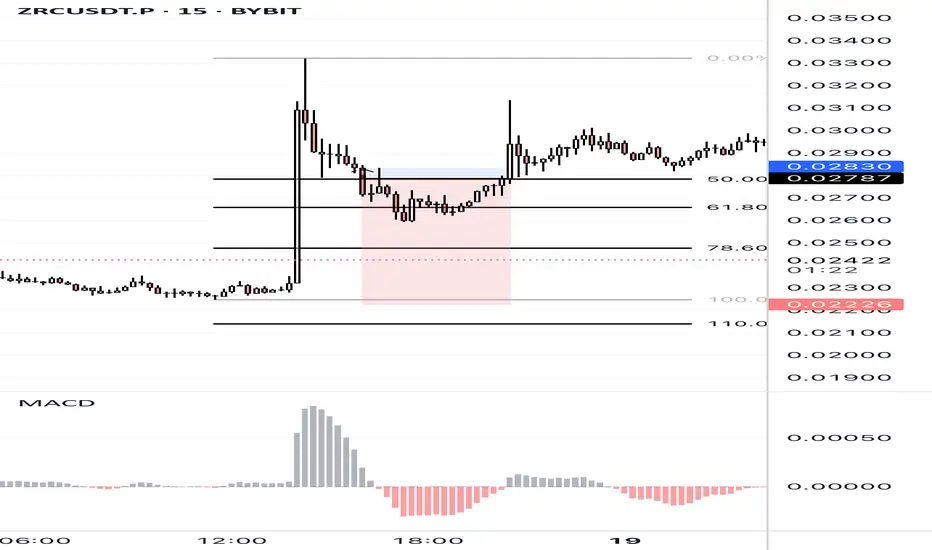
ZRCUSDT.P Long – Bullish Reaction from 61.8%–78.6% Fibonacci ZonOptional Descriptions (for the idea body):
Short description:
Price retraced into the golden Fibonacci zone (61.8%–78.6%) and showed a strong bullish reaction. MACD divergence supports the move. Expecting continuation toward recent highs.
Hashtags to add:
#ZRCUSDT #Bybit #Fibonacci #CryptoTrading #MACD #LongTrade #CopyTrading
Big CorrectionThe S&P index.
The chart shows the potential end of the final rally from the 2009 low.
Currently, with this rally from the recent 4,800 low, we are still in a correction period that will end in late October (highs and lows are irrelevant), & We have a date coming up in August so let's see what happens there.
After this period, we will have a rally combined with uncertainty and unjustified speculative movements (bubble) that could take us to the final peak, which I expect in 2026.
This remains a possibility, but don't base your trades on it. However, caution is often good.

USOIL: Strong Bearish Sentiment! Short!
My dear friends,
Today we will analyse USOIL together☺️
The in-trend continuation seems likely as the current long-term trend appears to be strong, and price is holding below a key level of 73.969 So a bearish continuation seems plausible, targeting the next low. We should enter on confirmation, and place a stop-loss beyond the recent swing level.
❤️Sending you lots of Love and Hugs❤️

NG1!: Bulls Are Winning! Long!
My dear friends,
Today we will analyse NG1! together☺️
The market is at an inflection zone and price has now reached an area around 3.894 where previous reversals or breakouts have occurred.And a price reaction that we are seeing on multiple timeframes here could signal the next move up so we can enter on confirmation, and target the next key level of 3.993.Stop-loss is recommended beyond the inflection zone.
❤️Sending you lots of Love and Hugs❤️

NI225: Next Move Is Up! Long!
My dear friends,
Today we will analyse NI225 together☺️
The price is near a wide key level
and the pair is approaching a significant decision level of 38,501.82 Therefore, a strong bullish reaction here could determine the next move up.We will watch for a confirmation candle, and then target the next key level of 38,689.93.Recommend Stop-loss is beyond the current level.
❤️Sending you lots of Love and Hugs❤️

#MAGIC/USDT#MAGIC
The price is moving within a descending channel on the 1-hour frame and is expected to break and continue upward.
We have a trend to stabilize above the 100 moving average once again.
We have a downtrend on the RSI indicator, which supports the upward move by breaking it upward.
We have a support area at the lower limit of the channel at 0.1533, acting as strong support from which the price can rebound.
Entry price: 0.1560
First target: 0.1611
Second target: 0.1667
Third target: 0.1750

NQ 23/06/2025 BIASHERE IS MY SIMPLE IDEA ABOUT NQ FOR THE NEXT WEEK
everything is clear as the snapshot says

Digital analysis I think digital analysis would be amazing idea to support our trading decision in case we have a little more confirmations... the chart shows some digital swings and how it can predict the next wave

EURAUD I Monday CLS I Model 1 I Target Weekly HighsHey, Market Warriors, here is another outlook on this instrument
If you’ve been following me, you already know every setup you see is built around a CLS Footprint, a Key Level, Liquidity and a specific execution model.
If you haven't followed me yet, start now.
My trading system is completely mechanical — designed to remove emotions, opinions, and impulsive decisions. No messy diagonal lines. No random drawings. Just clarity, structure, and execution.
🧩 What is CLS?
CLS is real smart money — the combined power of major investment banks and central banks moving over 6.5 trillion dollars a day. Understanding their operations is key to markets.
✅ Understanding the behavior of CLS allows you to position yourself with the giants during the market manipulations — leading to buying lows and selling highs - cleaner entries, clearer exits, and consistent profits.
📍 Model 1
is right after the manipulation of the CLS candle when CIOD occurs, and we are targeting 50% of the CLS range. H4 CLS ranges supported by HTF go straight to the opposing range.
"Adapt what is useful, reject what is useless, and add what is specifically your own."
— David Perk aka Dave FX Hunter ⚔️
👍 Hit like if you find this analysis helpful, and don't hesitate to comment with your opinions, charts or any questions.

BTC Testing Crucial Support – Breakdown or Bounce ?Bitcoin is currently testing a critical support zone around $103,573 – a break below could trigger a sharper move toward $101,400.
Price rejected from ~$105.8K
Support holding... for now
RSI dropping fast – now near 34 (1H TF)
Weakening momentum visible
This level is the last line of defense for bulls. If it cracks, expect volatility.
Watch closely. Break = panic or buying opportunity?
DYOR. Not Financial Advice.

GU SHORTSo start from DXY >Bullish on Daily and was Daily FVG that Daily FVG after close of 4H candle in N-Y session that led me to think that Daily FVG will BE break way gap
So take a trade on GU after starting to see Luck of creating FVG to the upside in 4H
In 15 minutes, I just entered, and my SL was above 1H IFVG
