Eicher Motors
I'm not a SEBI REGISTERED ANYLISIS
just for learning purpose
above the blue line close in D chart candle i will buy and put strictly SL to below red line...once candle close below Red line in D chart...i will close the Trade...
target check the chart
WAIT FOR ENTRY......then after
WAIT FOR TARGET...... or
WAIT FOR STOPLOSS
educational purpose only
oits simple ORB WITH VOLUME BREAKOUT STRATEGY...with small condition apply for selecting the stocks
owt not response for your profit and loss
Gann

ETH - Do you Notice a Pattern here? I DO...Hello TradingView Family / Fellow Traders. This is Richard, also known as theSignalyst.
📈I find ETH 4h chart as it looks like history repeating itself.
Previously in 1 to 5 June, it formed a slight lower low before starting the next big bullish impulse leading towards the upper bound of the channel.
📚 Today, ETH just formed the slight lower low we are looking for.
Is it time for the next bullish impulse to start? well it will be confirmed after breaking above the last major high at $2,600.
What do you think?
📚 Always follow your trading plan regarding entry, risk management, and trade management.
Good luck!
All Strategies Are Good; If Managed Properly!
~Rich

DAX: Target Is Up! Long!
My dear friends,
Today we will analyse DAX together☺️
The recent price action suggests a shift in mid-term momentum. A break above the current local range around 23,435.79 will confirm the new direction upwards with the target being the next key level of 23,572.93 and a reconvened placement of a stop-loss beyond the range.
❤️Sending you lots of Love and Hugs❤️

GOLD: Move Up Expected! Long!
My dear friends,
Today we will analyse GOLD together☺️
The in-trend continuation seems likely as the current long-term trend appears to be strong, and price is holding above a key level of 3,348.30 So a bullish continuation seems plausible, targeting the next high. We should enter on confirmation, and place a stop-loss beyond the recent swing level.
❤️Sending you lots of Love and Hugs❤️

EURUSD: Move Down Expected! Short!
My dear friends,
Today we will analyse EURUSD together☺️
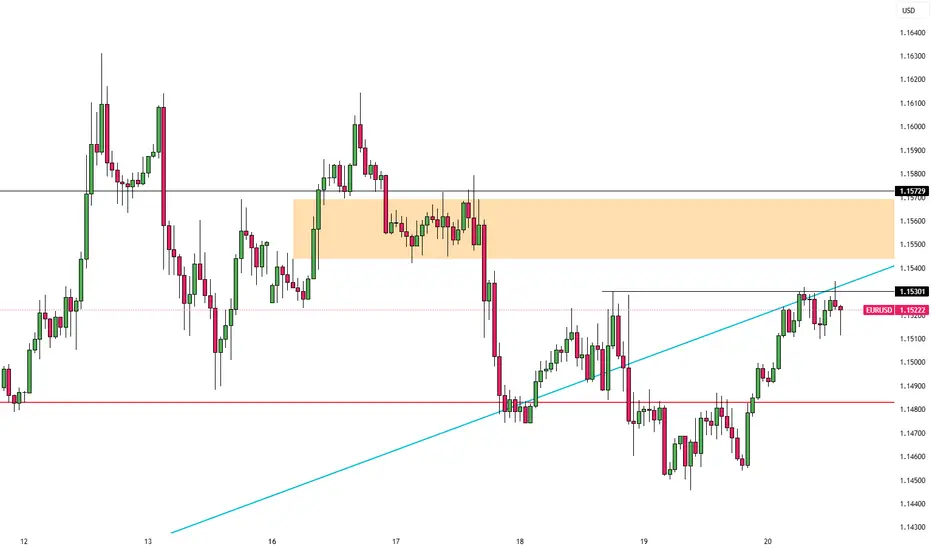
The market is at an inflection zone and price has now reached an area around 1.15208 where previous reversals or breakouts have occurred.And a price reaction that we are seeing on multiple timeframes here could signal the next move down so we can enter on confirmation, and target the next key level of 1.15133..Stop-loss is recommended beyond the inflection zone.
❤️Sending you lots of Love and Hugs❤️

SILVER: Local Bearish Bias! Short!
My dear friends,
Today we will analyse SILVER together☺️
The price is near a wide key level
and the pair is approaching a significant decision level of 36.067 Therefore, a strong bearish reaction here could determine the next move down.We will watch for a confirmation candle, and then target the next key level of 35.716..Recommend Stop-loss is beyond the current level.
❤️Sending you lots of Love and Hugs❤️

EUR/USD Slips as Fed Stays HawkishEUR/USD hovered near 1.1520 during Friday’s Asian session, extending gains for a third day as the US dollar weakened, likely due to a technical pullback. However, the greenback may rebound as safe-haven demand grows amid rising tensions between the US and Iran.
Citing senior US intelligence, The New York Times reported that Iran hasn’t yet decided to pursue nuclear weapons, despite having enriched uranium reserves. Meanwhile, the Senate Intelligence Committee Chair said President Trump is set to offer Iran one final window to negotiate before considering military action, potentially delaying any decisions for up to two weeks.
Markets are also awaiting Friday’s Monetary Policy Report from the Federal Reserve, which will provide fresh insights into the Fed’s stance. On the Euro side, the ECB’s hawkish outlook offered additional support, with President Christine Lagarde suggesting rate cuts may soon end as the central bank remains “well positioned” to handle persistent risks.
Resistance is located at 1.1530, while support is seen at 1.1450
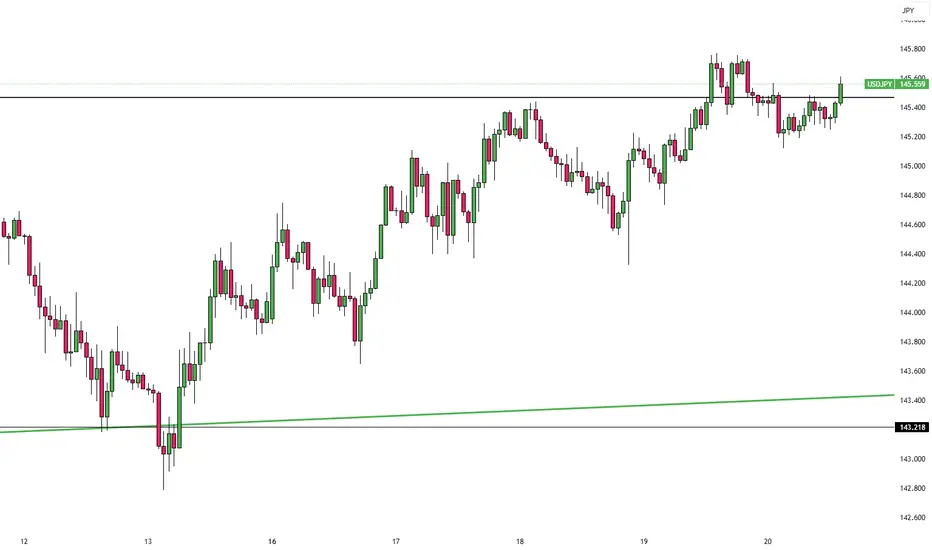
Yen Edges Higher as Inflation SurgesThe Japanese yen traded stronger near 145 per dollar, rebounding as Japan’s core inflation rose for the third straight month to 3.7%, its highest since January 2023. The data strengthens expectations that the Bank of Japan may continue policy tightening.
Earlier in the week, the BOJ held rates at 0.5% but highlighted how rising wages are being passed on to consumers, keeping inflation elevated. Governor Kazuo Ueda emphasized a data-driven path forward, keeping the door open for more hikes if needed.
The key resistance is at $145.30, while the major support is located at $142.50.
XAUUSD: Market Analysis and Strategy for June 20Gold technical analysis
Daily chart resistance 3450, support 3338
4-hour chart resistance 3372, support 3338
1-hour chart resistance 3363, support 3340
After the sharp drop at the beginning of this week, the bulls were weak, and each rebound was swallowed by a larger decline. Although there was a counterattack, the overall trend was oscillating downward. Yesterday, it rebounded from above 3362 to 3387, and then fell below 3362 to set a new low at 3347.
After today's shock, it broke through the low of 3347 again and fell to 3340. The short-term trend was weak. The Asian session high was at 3370, and the second high was at 3375. The ideal position is to rebound around 3370/75 during the day and choose to go short. Short-term shocks and declines can wait for rebounds and then go short. It is also easy to rebound quickly after the decline. If the support of 3340/38 is maintained, you can try to buy on the scalp. The second consideration is to sell in advance near 3356 to prevent weakness without a pullback and the NY market directly falling to a new low

GBPJPY LONG & SHORT FORECAST Q2 W25 D20 Y25GBPJPY LONG & SHORT FORECAST Q2 W25 D20 Y25
Professional Risk Managers👋
Welcome back to another FRGNT chart update📈
Diving into some Forex setups using predominantly higher time frame order blocks alongside confirmation breaks of structure.
Let’s see what price action is telling us today!
💡Here are some trade confluences📝
✅Daily order block
✅15' order block
✅Intraday breaks of structure
✅4H Order block
🔑 Remember, to participate in trading comes always with a degree of risk, therefore as professional risk managers it remains vital that we stick to our risk management plan as well as our trading strategies.
📈The rest, we leave to the balance of probabilities.
💡Fail to plan. Plan to fail.
🏆It has always been that simple.
❤️Good luck with your trading journey, I shall see you at the very top.
🎯Trade consistent, FRGNT X

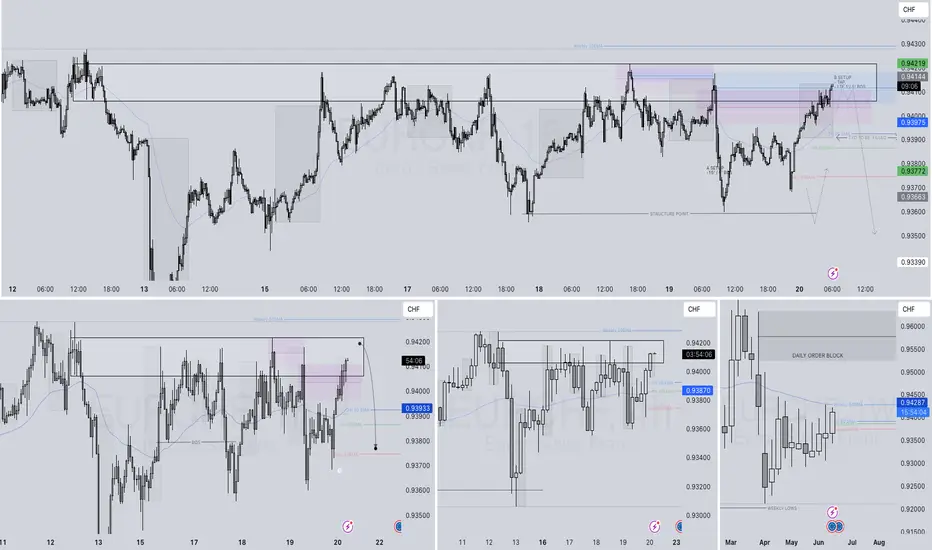
EURCHF SHORT FORECAST Q2 W25 D20 Y25EURCHF SHORT FORECAST Q2 W25 D20 Y25
Professional Risk Managers👋
Welcome back to another FRGNT chart update📈
Diving into some Forex setups using predominantly higher time frame order blocks alongside confirmation breaks of structure.
Let’s see what price action is telling us today! 👀
💡Here are some trade confluences📝
✅Weekly 50EMA Rejection
✅15' Order block
✅1H Order Block
✅4H Highs
🔑 Remember, to participate in trading comes always with a degree of risk, therefore as professional risk managers it remains vital that we stick to our risk management plan as well as our trading strategies.
📈The rest, we leave to the balance of probabilities.
💡Fail to plan. Plan to fail.
🏆It has always been that simple.
❤️Good luck with your trading journey, I shall see you at the very top.
🎯Trade consistent, FRGNT X
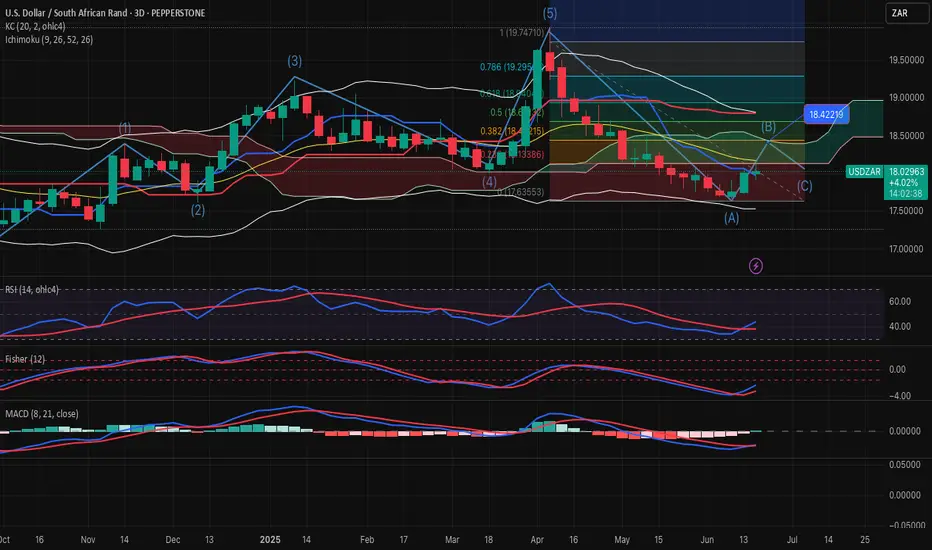
USDZAR-BUY strategy 3D chart The pair is still on the BY side, even though short-term charts may suggest slightly lower. The issue is, that any involvement by US may cause a spike of US dollar, and technically the pair has a chance to correct to 18.4200 FIB before we see recovery. So be careful, and perhaps the BUY side may help in this case, and I feel it starts looking this way as I had written some week back on the same chart settings.
Strategy BUY @ 17.9650-18.0150 and take profit near 18.3750 for now.
AUDJPY SHORT FORECAST Q2 W25 D20 Y25AUDJPY SHORT FORECAST Q2 W25 D20 Y25
Professional Risk Managers👋
Welcome back to another FRGNT chart update📈
Diving into some Forex setups using predominantly higher time frame order blocks alongside confirmation breaks of structure.
Let’s see what price action is telling us today! 👀
💡Here are some trade confluences📝
✅Weekly Order block rejection
✅15' Order block to be confirmed
✅4H Order block
✅1H Order block
🔑 Remember, to participate in trading comes always with a degree of risk, therefore as professional risk managers it remains vital that we stick to our risk management plan as well as our trading strategies.
📈The rest, we leave to the balance of probabilities.
💡Fail to plan. Plan to fail.
🏆It has always been that simple.
❤️Good luck with your trading journey, I shall see you at the very top.
🎯Trade consistent, FRGNT X

EURUSD SHORT FORECAST Q2 W25 D20 Y25EURUSD SHORT FORECAST Q2 W25 D20 Y25
Professional Risk Managers👋
Welcome back to another FRGNT chart update📈
Diving into some Forex setups using predominantly higher time frame order blocks alongside confirmation breaks of structure.
Let’s see what price action is telling us today!
💡Here are some trade confluences📝
✅Weekly order block rejection
✅15' order block
✅4 hour order block identified
✅Tokyo ranges to be filled
🔑 Remember, to participate in trading comes always with a degree of risk, therefore as professional risk managers it remains vital that we stick to our risk management plan as well as our trading strategies.
📈The rest, we leave to the balance of probabilities.
💡Fail to plan. Plan to fail.
🏆It has always been that simple.
❤️Good luck with your trading journey, I shall see you at the very top.
🎯Trade consistent, FRGNT X

AUDCAD SHORT FORECAST Q2 W25 D20 Y25AUDCAD SHORT FORECAST Q2 W25 D20 Y25
Professional Risk Managers👋
Welcome back to another FRGNT chart update📈
Diving into some Forex setups using predominantly higher time frame order blocks alongside intraday confirmation breaks of structure.
💡Here are some trade confluences📝
✅Weekly 50 EMA
✅Weekly order block rejection
✅Daily order block rejection
✅15’ order block identification
🔑 Remember, to participate in trading comes always with a degree of risk, therefore as professional risk managers it remains vital that we stick to our risk management plan as well as our trading strategies.
📈The rest, we leave to the balance of probabilities.
💡Fail to plan. Plan to fail.
🏆It has always been that simple.
❤️Good luck with your trading journey, I shall see you at the very top.
🎯Trade consistent, FRGNT X

GBPJPY LONG & SHORT FORECAST Q2 W25 D20 Y25GBPJPY LONG & SHORT FORECAST Q2 W25 D20 Y25
Professional Risk Managers👋
Welcome back to another FRGNT chart update📈
Diving into some Forex setups using predominantly higher time frame order blocks alongside confirmation breaks of structure.
Let’s see what price action is telling us today!
💡Here are some trade confluences📝
✅Daily order block
✅15' order block
✅Intraday breaks of structure
✅4H Order block
🔑 Remember, to participate in trading comes always with a degree of risk, therefore as professional risk managers it remains vital that we stick to our risk management plan as well as our trading strategies.
📈The rest, we leave to the balance of probabilities.
💡Fail to plan. Plan to fail.
🏆It has always been that simple.
❤️Good luck with your trading journey, I shall see you at the very top.
🎯Trade consistent, FRGNT X

BITCOIN TO 193000!!!!EVERYONE IS WRONG!it has been 5 years that i have been studying the btc and linkusdt cycles, and what i know is that a bull market is coming this summer, starting in july—maybe on the 4th or 7th.

A visual comparison of Purple Bitcoin (PBTC) and Bitcoin Cash (BA visual comparison of Purple Bitcoin (PBTC) and Bitcoin Cash (BCH) trends, powered by the Purple Bitcoin Compare Bot.


SPX500 Market Outlook!We remain bullish on the SPX500.
🔍 Short-Term Expectation:
A potential bottom could form around 2 AM London time on the 4H chart.
📉 Key Support Levels:
• 5904.3
• 5865.1
• 5849.3
📅 Top Projection Dates:
• 25th June
• 4th July
Stay sharp. Structure still favours the bulls. 🐂📊

Long White Rock CryptoWhite Rock reached the 61.8% retracement. FOMO and dumb money has been shaken out. Looking for a long to new high at the 141.40%

US30: Absolute Price Collapse Ahead! Short!
My dear friends,
Today we will analyse US30 together☺️
The recent price action suggests a shift in mid-term momentum. A break below the current local range around 41,858.0 will confirm the new direction downwards with the target being the next key level of 41,737.4 .and a reconvened placement of a stop-loss beyond the range.
❤️Sending you lots of Love and Hugs❤️

SILVER: Will Go Up! Long!
My dear friends,
Today we will analyse SILVER together☺️
The in-trend continuation seems likely as the current long-term trend appears to be strong, and price is holding above a key level of 36.351 So a bullish continuation seems plausible, targeting the next high. We should enter on confirmation, and place a stop-loss beyond the recent swing level.
❤️Sending you lots of Love and Hugs❤️
