#ARB/USDT#ARB
The price is moving within a descending channel on the 1-hour frame and is expected to break and continue upward.
We have a trend to stabilize above the 100 moving average once again.
We have a downtrend on the RSI indicator, which supports the upward move by breaking it upward.
We have a support area at the lower limit of the channel at 0.3210, acting as strong support from which the price can rebound.
Entry price: 0.3250
First target: 0.3406
Second target: 0.3510
Third target: 0.3667
Gann

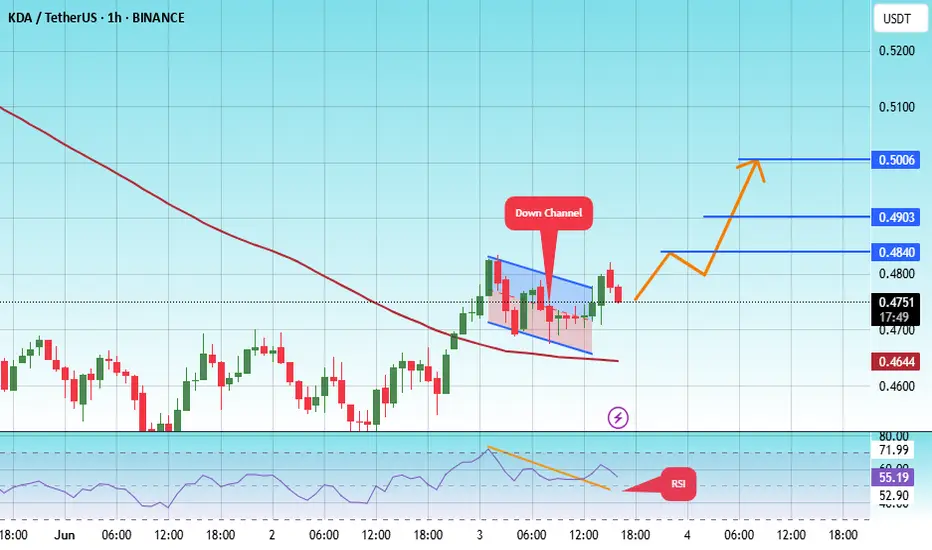
#KDA/USDT#KDA
The price is moving within a descending channel on the 1-hour frame, adhering well to it, and is heading for a strong breakout and retest.
We are experiencing a rebound from the lower boundary of the descending channel. This support is at 0.4670.
We are experiencing a downtrend on the RSI indicator, which is about to break and retest, supporting the upward trend.
We are looking for stability above the 100 Moving Average.
Entry price: 0.4764
First target: 0.4840
Second target: 0.4900
Third target: 0.5000
#PEOPLE/USDT#PEOPLE
The price is moving within a descending channel on the 1-hour frame, adhering well to it, and is heading for a strong breakout and retest.
We are seeing a bounce from the lower boundary of the descending channel, which is support at 0.02420.
We have a downtrend on the RSI indicator that is about to be broken and retested, supporting the upward trend.
We are looking for stability above the 100 Moving Average.
Entry price: 0.02475
First target: 0.02650
Second target: 0.02780
Third target: 0.02930

#PEOPLE/USDT#PEOPLE
The price is moving within a descending channel on the 1-hour frame and is expected to break and continue upward.
We have a trend to stabilize above the 100 moving average once again.
We have a downtrend on the RSI indicator, which supports the upward move by breaking it upward.
We have a support area at the lower limit of the channel at 0.01980, acting as strong support from which the price can rebound.
Entry price: 0.02040
First target: 0.02086
Second target: 0.02135
Third target: 0.02185

CHECK GBPJPY SIGNAL READ CAPTION( gbpjpy) BUY zone
( trade satup )
entry point (194.933) to (195.103) 📊
first tp (195.440)📊
2nd target (195.800) 📊
last target (196.200) 📊
stop loss (194.615)❌

#DOGS/USDT#DOGS
The price is moving within a descending channel on the 1-hour frame and is expected to break and continue upward.
We have a trend to stabilize above the 100 moving average once again.
We have a downtrend on the RSI indicator that supports the upward move with a breakout.
We have a support area at the lower boundary of the channel at 0.0001400, acting as strong support from which the price can rebound.
Entry price: 0.0001412
First target: 0.0001465
Second target: 0.0001511
Third target: 0.0001570

Trading Gold with Leverage: Smart or Dangerous?XAUUSD trading (Gold vs. US Dollar) is a popular choice among global traders due to its high liquidity, strong volatility, and profit potential. One of the tools that help traders amplify their returns is financial leverage. However, using leverage also carries significant risks if not managed properly. So, what exactly is leverage in XAUUSD trading? Should you use it? Let’s explore the advantages and disadvantages below.
1. What is Leverage in XAUUSD Trading?
Leverage is a financial tool that allows traders to control a larger position in the market than the capital they actually own. For example, with 1:100 leverage, you only need $1,000 to trade a position worth $100,000.
In the XAUUSD market, brokers often offer leverage ranging from 1:50 to 1:500, or even up to 1:2000—depending on their risk policies and regulations.
2. Pros of Using Leverage in XAUUSD Trading
🔹 Amplifies Potential Profits
Leverage allows traders to maximize profits with a relatively small amount of capital. When the market moves in the expected direction, the gains can be multiplied significantly.
🔹 Lower Capital Requirement
Instead of needing $10,000 to trade 1 lot of gold, a trader may only need $100–$500 depending on the leverage. This lowers the entry barrier and offers greater flexibility in capital management.
🔹 Enables Strategy Diversification
With the same amount of capital, traders can open multiple positions across different timeframes or strategies. Leverage allows for broader portfolio diversification while still maintaining control over total risk.
🔹 Takes Advantage of Short-Term Opportunities
Gold markets often react strongly to news and economic data. Leverage lets traders capitalize on short-term price swings, enabling faster profits without needing to hold positions long-term.
3. Cons and Risks of Using Leverage in XAUUSD Trading
Risk of Account Blowout
The higher the leverage, the lower the safety margin. A small market move against the position can trigger a margin call or stop-out, resulting in a full loss of the initial capital.
Emotional and Psychological Stress
High leverage often leads traders to gamble instead of follow a strategy, increasing the likelihood of emotional decisions and impulsive trading behaviors.
Difficult to Manage During Volatility
XAUUSD is a highly volatile asset, especially during U.S. sessions or major news releases (like CPI, Fed announcements, NFP). Over-leveraging can lead to rapid losses in seconds during sudden price spikes.
Increased Emotional Pressure
When using high leverage, every small fluctuation feels significant, causing stress and encouraging poor decisions—like exiting too early or revenge trading.
4. Conclusion: Should You Use Leverage in XAUUSD Trading?
Yes, but only with a disciplined and strategic approach.
Use moderate leverage (e.g. 1:100 or lower if you're a beginner)
Always set clear stop-loss and take-profit levels
Risk no more than 2% of your account per trade
Avoid “all-in” trades and don’t let emotions dictate position size
In Summary
Leverage in XAUUSD trading is a double-edged sword. Used wisely, it accelerates your profit potential. Used recklessly, it can wipe out your account in moments. The key is to trade with discipline, knowledge, and a solid plan to harness the power of leverage without falling into its traps.

Trader Abdullah Masood Yu.TuIO/USDT pair on a 15-minute chart, and it looks like you're using LuxAlgo Fair Value Gaps, key levels/zones, and a lot of structural plotting to identify trade opportunities.
Observations:
Current Price: ~0.799 USDT
Just Rejected: From a significant 4H bearish fair value gap (FVG) zone around 0.807–0.820
Support Zones Below: Several green zones and liquidity blocks are stacked between 0.74–0.78
Key Resistance: Around 0.810–0.820
Label “TURTLE FK”** around 0.792 suggests a prior liquidity or manipulation area (possibly a sweep zone)
What You Can Do Now:
🔴 Bearish Case (Short Bias):
If you believe the rejection from the 4H FVG holds:
Short Entry Around 0.799–0.807 (if price pulls back again)
Stop-Loss: Just above the FVG zone (e.g., 0.821)
Target 1: ~0.792 (“TURTLE” zone — potential liquidity sweep)
Target 2: ~0.774
Final Target: Deeper green liquidity area around 0.750–0.740
You could also look for a break in structure on lower timeframes for added confirmation.
🟢 Bullish Case (Long Bias):
If you think the retracement is temporary and price will reclaim the FVG:
Long Entry: Only if price reclaims above 0.807 with strong volume
Stop-Loss: Below 0.793
Target 1: 0.817 (top of the FVG)
Target 2: 0.830 (clean breakout)
Neutral Plan (If You’re Unsure):
Wait for price to decisively break above 0.807 or fall below 0.789
Consider setting alerts at:
📈 > 0.807 (bullish breakout confirmation)
📉 < 0.789 (bearish breakdown into lower liquidity zones)

XAUUSDXAUUSD rejected the daily uptrend so we gonna keep pushing to the upside
Next stop its 3500 at least

10 june Nifty50 brekout and Breakdown leval
🔼 Call Option (CE) Buy Levels:
Above 25,030 (Risky Zone)
"10m hold CE by RISKY ZONE"
Above 25,190 (Positive Trade View Zone)
Confirm bullishness and enter CE trades cautiously.
25,270"Above 10m hold CE by zone" – Strong confirmation.
25,390"Above 10m Closing Shot cover Possible" – Higher breakout level.
🔽 Put Option (PE) Buy Levels:
Below 25,030
"Below 10m hold PE by Zone"
Below 25,190
"Below nigetive trade view" – Sentiment turning bearish.
25,270 Below 10m PE by Risky Zone" – Confirmation of downward pressure.
Below 25,390 10m PE By Safe Zone" – Strong PE entry.
✅ Extra Key Zones:
Opening Support: 25,070
Opening Resistance: 25,030
CE Safe Zone: Above 24,970
Below 24,970: Possible unwinding (strong downside)

Silver's Next Supercycle: $200+ by 2031?Silver has twice hit the $50 mark — once in 1980 and again in 2011. Today, it trades around $35, but the technical landscape is shifting fast.
At Vital Direction, our long-term Elliott Wave and Gann analysis signals a major breakout cycle already underway.
🌀 Wave structure suggests a multi-year impulsive rally
📐 Gann angles align with historic turning points
💥 Target: $200+ by 2031 (conservative)
⚙️ Backed by growing industrial demand, inflation risks, and monetary instability
This isn’t just a metal — it’s a macro opportunity.

DXY: Target Is Up! Long!
My dear friends,
Today we will analyse DXY together☺️
The market is at an inflection zone and price has now reached an area around 98.471 where previous reversals or breakouts have occurred.And a price reaction that we are seeing on multiple timeframes here could signal the next move up so we can enter on confirmation, and target the next key level of 98.594.Stop-loss is recommended beyond the inflection zone.
❤️Sending you lots of Love and Hugs❤️

Solana reversalCurrently, the stochastic oscillator shows an oversold situation for Solana, despite the price reversal. The price is moving on a curved support line with a short-term target of $180.

GOLD: Move Up Expected! Long!
My dear friends,
Today we will analyse GOLD together☺️
The price is near a wide key level
and the pair is approaching a significant decision level of 3,330.13 Therefore, a strong bullish reaction here could determine the next move up.We will watch for a confirmation candle, and then target the next key level of 3,332.32.Recommend Stop-loss is beyond the current level.
❤️Sending you lots of Love and Hugs❤️

EURUSD: Local Bullish Bias! Long!
My dear friends,
Today we will analyse EURUSD together☺️
The recent price action suggests a shift in mid-term momentum. A break above the current local range around 1.14158 will confirm the new direction upwards with the target being the next key level of 1.14327 and a reconvened placement of a stop-loss beyond the range.
❤️Sending you lots of Love and Hugs❤️

SILVER: Absolute Price Collapse Ahead! Short!
My dear friends,
Today we will analyse SILVER together☺️
The in-trend continuation seems likely as the current long-term trend appears to be strong, and price is holding below a key level of 36.640 So a bearish continuation seems plausible, targeting the next low. We should enter on confirmation, and place a stop-loss beyond the recent swing level.
❤️Sending you lots of Love and Hugs❤️

#OP/USDT#OP
The price is moving within a descending channel on the 1-hour frame and is expected to break and continue upward.
We have a trend to stabilize above the 100 moving average once again.
We have a downtrend on the RSI indicator that supports the upward move with a breakout.
We have a support area at the lower limit of the channel at 0.600, acting as strong support from which the price can rebound.
Entry price: 0.616
First target: 0.630
Second target: 0.641
Third target: 0.658

#ONE/USDT#ONE
The price is moving within a descending channel on the 1-hour frame and is expected to break and continue upward.
We have a trend to stabilize above the 100 moving average once again.
We have a downtrend on the RSI indicator that supports the upward move with a breakout.
We have a support area at the lower limit of the channel at 0.01147, acting as strong support from which the price can rebound.
Entry price: 0.01183
First target: 0.01210
Second target: 0.01236
Third target: 0.01268

#DOGE/USDT#DOGE
The price is moving within a descending channel on the 1-hour frame and is expected to break and continue upward.
We have a trend to stabilize above the 100 moving average once again.
We have a downtrend on the RSI indicator, which supports the upward move by breaking it upward.
We have a support area at the lower limit of the channel at 0.1800, acting as strong support from which the price can rebound.
Entry price: 0.1838
First target: 0.1886
Second target: 0.1928
Third target: 0.1972


US30 This trade is an A+ setup from abnormal context to normal context. The price took BSL on HTF and failed to create FVG on daily as a result of the lack of creating FVG. After that, in the 4H, the price closed below -OB. Now we are short; we just need to engage.

Gold hits 3335 in the US market and shorts
⭐️Gold information:
Looking back at last week's trend, after hitting a high on Monday, gold prices fluctuated in a range from Tuesday to Thursday, and closed with a sharp drop on Friday, forming an M-top pattern from a technical perspective.
This week, the market focus is on the high-level trade negotiations between China and the United States held in London. The market expects that the negotiations will proceed smoothly, and this optimism is bearish for gold. Based on the comprehensive technical and fundamental analysis, the gold price is still bearish today. It is recommended to pay attention to the short-selling opportunities in the rebound range of 3330-3340 US dollars.
⭐️Set gold price:
🔥Sell gold area: 3330-3340 SL 3345
TP1: $3320
TP2: $3310
TP3: $3295

The Hidden Signals in AG: A Silver Lining in Technical Patterns?Sometimes the market whispers before it roars. If you're watching First Majestic Silver (AG), those whispers just became a chant. In this post, I break down the technical patterns, potential numerology synchronicities, and trader psychology that could signal something big brewing for AG. Whether you're a skeptic or a believer, the confluence here is too compelling to ignore.
1. Descending Triangle (Weekly Chart)
Let's start with the macro structure: a descending triangle stretching all the way from Feb 1, 2021 to April 23, 2025. This isn’t just any triangle. Its base lines up perfectly with today’s breakout candle low, forming a multi-year support zone around the $5.90 - $6.00 range.
In technical analysis, descending triangles often resolve in the direction of the trend preceding their formation. Given that AG was in a downtrend from 2021 highs, this bullish breakout now marks a significant shift in sentiment and market dynamics.
2. Hourly Chart: Inverse Head and Shoulders
Zoom in to the hourly chart and we get a classic reversal pattern: Inverse Head and Shoulders.
Left Shoulder: April 12 low
Head: April 16 low
Right Shoulder: April 19 low
Neckline: $6.38 — previously tested and rejected
Today’s breakout through this neckline is textbook. If this plays out:
Measured Move Target: ~$8.00
Why $8? It’s the level where AG failed to break out on Oct 29, 2023, making it a key resistance and psychological target.
3. Cloned Triangle Geometry (Gann Vibes)
Here’s where it gets interesting. Clone the triangle and flip it vertically:
The tip touches both the April 4, 2011 all-time high and the March 16, 2020 COVID pivot low.
This implies a natural "mirror" or cycle echo—like Gann’s time-price equivalence coming into play.
Coincidence? Maybe. But technical setups with this much harmony don’t appear every day.
4. Numerology and Time Symmetry
I know this part might sound woo-woo, but bear with me:
Feb 1, 2021 to April 23, 2025 = 1,177 days, or just over 3.22 years
AG’s breakout candle occurred on April 24
April 4, 2011 = 4/4/11 → 4 + 4 + 1 + 1 = 10
March 16, 2020 = 3 + 1 + 6 + 2 + 0 + 2 + 0 = 14
Total = 24 → Today’s date again: April 24
Even the closing price of $6.22 gives us 6+2+2 = 10, echoing the 2011 ATH numerology.
Take it with a grain of salt, but these repeating patterns may hint at cyclical alignment.
5. Volume Confirmation
The breakout came with a surge in volume, confirming the move and reducing the likelihood of a fake-out. Coupled with bullish RSI divergence, this gives the technical thesis real legs.
6. Macro Context: Silver vs Gold
While gold consolidates, silver is trying to play catch-up. This rotation into high-beta silver names makes sense and AG, being a retail favorite and highly shorted at times, is perfectly positioned for explosive upside.
7. Options Play: December 2026 Calls
For long-term traders, LEAPS (Long-Term Equity Anticipation Securities) could be the way to play this:
December 2026 Calls
Strike Range: $7, $8.50, $10
Low premium, high convexity potential
Conclusion: Is This the Signal or Just Noise?
You don’t have to be a believer in numerology or market mysticism to appreciate the convergence of:
Triangle breakout
Volume surge
Inverse head-and-shoulders
Price symmetry
Historical pivot touchpoints
All signs point toward a potential trend reversal for AG. At the very least, this setup offers a high reward-to-risk swing opportunity. At best? You might just be witnessing the start of a major silver bull move.
What’s Your Take?
Do you see the same signals or think this is just coincidental noise?
Joel | The Accidental Retiree
"Retired. Sort of. But still trading like I mean it."
