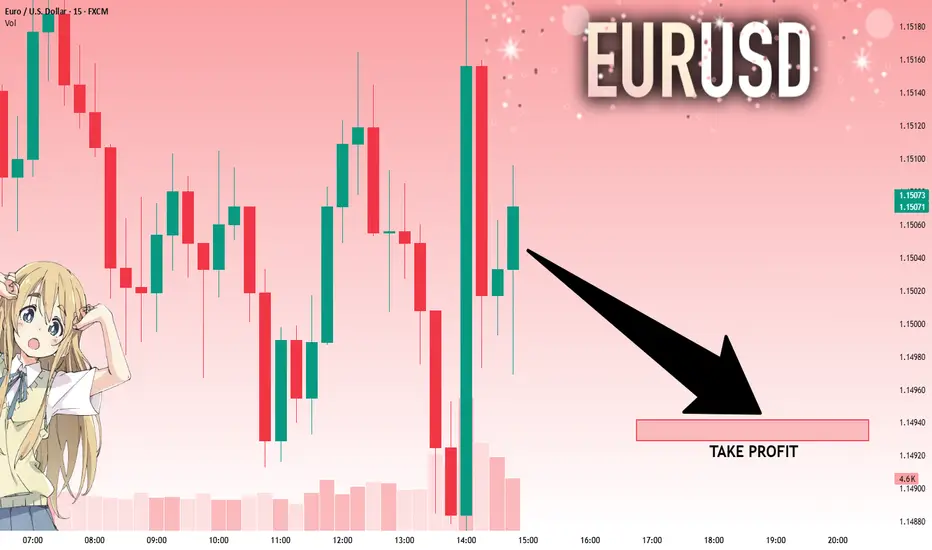
EURUSD: Move Down Expected! Short!
My dear friends,
Today we will analyse EURUSD together☺️
The price is near a wide key level
and the pair is approaching a significant decision level of 1.15043 Therefore, a strong bearish reaction here could determine the next move down.We will watch for a confirmation candle, and then target the next key level of 1.14942..Recommend Stop-loss is beyond the current level.
❤️Sending you lots of Love and Hugs❤️
Gann
June 17 Bitcoin Bybit chart analysisHello
This is Bitcoin Guide.
It's been a while.
I took a break recently because the participation rate was not good.
Since it's been a while since I did an analysis, I did it in a short form,
I hope you enjoy it.
If you "follow"
You can receive real-time movement paths and comment notifications on major sections.
If my analysis was helpful,
Please click the booster button at the bottom.
Here is the Bitcoin 30-minute chart.
I created a strategy based on the possibility of sideways movement in Nasdaq and the rebound of Tether Dominance.
* When the blue finger moves,
It is a two-way neutral short->long switching strategy.
1. $106,792.2 short position entry point / stop loss price when orange resistance line is broken
2. $105,082.8 long position switching / stop loss price when green support line is broken
3. $107,579.9 long position 1st target -> Top 2nd target price
If it goes down from the current position,
Check the bottom section -> up to $103,194.3.
Please use my analysis as a reference only
I hope you operate safely with principle trading and stop loss price.
Thank you.

#ZRX/USDT#ZRX
The price is moving within a descending channel on the 1-hour frame, adhering well to it, and is heading towards a strong breakout and retest.
We are experiencing a rebound from the lower boundary of the descending channel. This support is at 0.2175.
We are experiencing a downtrend on the RSI indicator, which is about to break and retest, supporting the upward trend.
We are heading towards stability above the 100 Moving Average.
Entry price: 0.2240
First target: 0.2290
Second target: 0.2357
Third target: 0.2420

#ETH/USDT#ETH
The price is moving within a descending channel on the 1-hour frame, adhering well to it, and is heading toward a strong breakout and retest.
We are experiencing a rebound from the lower boundary of the descending channel, which is support at 2460.
We are experiencing a downtrend on the RSI indicator, which is about to break and retest, supporting the upward trend.
We are heading toward stability above the 100 moving average.
Entry price: 2540
First target: 2582
Second target: 2646
Third target: 2717

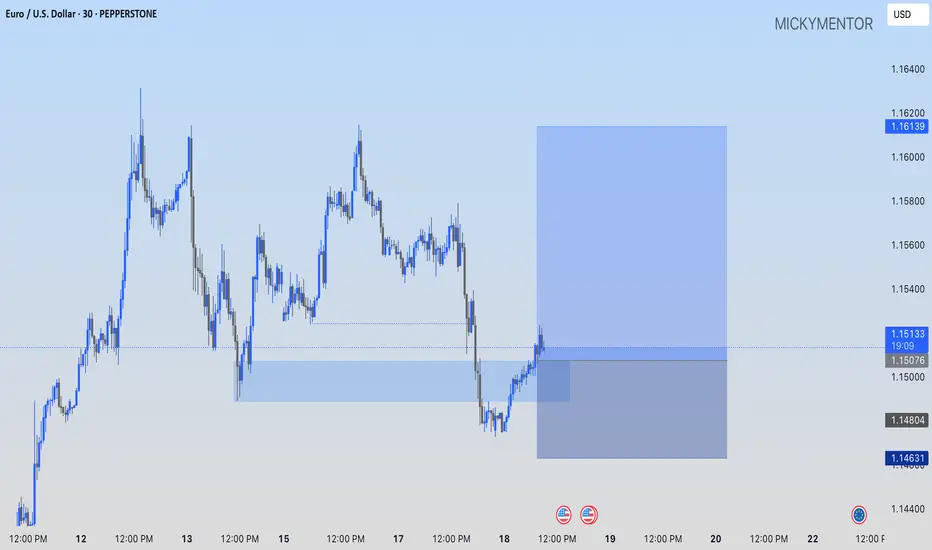
EURUSD: AN OPPORTUNITY TO BUY!! PEPPERSTONE:EURUSD I'm buying at current market price, I'll target the 1.16147 as my profit target.
#XRP/USDT#XRP
The price is moving within a descending channel on the 1-hour frame, adhering well to it, and is heading towards a strong breakout and retest.
We are experiencing a rebound from the lower boundary of the descending channel, which is support at 2.21.
We are experiencing a downtrend on the RSI indicator that is about to be broken and retested, supporting the upward trend.
We are heading for stability above the 100 Moving Average.
Entry price: 2.24
First target: 2.27
Second target: 2.30
Third target: 2.35

#QUICK/USDT#QUICK
The price is moving within a descending channel on the 1-hour frame, adhering well to it, and is heading for a strong breakout and retest.
We are seeing a bounce from the lower boundary of the descending channel. This support is at 0.02317.
We have a downtrend on the RSI indicator that is about to be broken and retested, supporting the upward trend.
We are looking for stability above the 100 Moving Average.
Entry price: 0.02446
First target: 0.02546
Second target: 0.02673
Third target: 0.02820

Silver Up Slightly as Markets Await PowellXAG/USD rose 0.3% to $37.23 on Wednesday, though gains were capped by a stronger U.S. dollar as investors turned to safe assets amid escalating geopolitical tensions and caution ahead of the Federal Reserve’s decision. Silver’s safe-haven appeal remained, but the firmer dollar made it less attractive for non-dollar buyers. Markets are now watching Fed Chair Jerome Powell’s remarks for clues on future policy and near-term direction for silver.
Resistance is set at 37.50, while support stands at 35.40.

XAUUSD: Market Analysis and Strategy for June 19Gold technical analysis
Daily level upper resistance 3500 lower support 3338
4-hour upper resistance 3419 lower support 3361
1-hour upper resistance 3400 lower support 3366
Gold news analysis: This week, gold rose to 3450 with the help of regional conflicts and then fell, eventually falling below the 3400 integer mark. Combining the intraday trend and the gradually downward movement of the high point in the weekly chart, it can be seen that the short-sellers' control in the market is gradually increasing. From a technical point of view, yesterday's decline drove the gold price to run below the middle track of the Bollinger band again, and the short-term 5-day moving average also fell. Although there is still a possibility of a rebound in the short term, the overall pattern is bearish. The Bollinger band has signs of closing, which means that there may be a shock adjustment in the future, especially the rebound strength after the support is worth paying attention to.
Gold operation suggestions: From the current trend analysis, the support below focuses on the four-hour level 3365 and the one-hour level 3366 support, and the upper pressure focuses on the vicinity of 3419. The short-term long-short strength and weakness dividing line is near 3361. Continue to buy on dips before the four-hour level falls below this position.
Buy: 3361near SL: 3355
Buy: 3400near SL: 3995

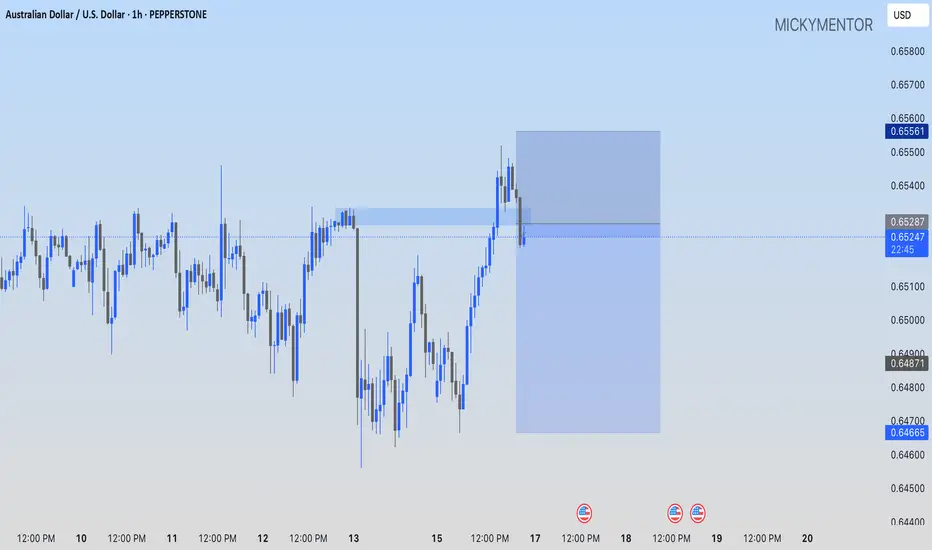
AUDCAD SHORT FORECAST Q2 W25 D18 Y25AUDCAD SHORT FORECAST Q2 W25 D18 Y25
Professional Risk Managers👋
Welcome back to another FRGNT chart update📈
Diving into some Forex setups using predominantly higher time frame order blocks alongside intraday confirmation breaks of structure.
💡Here are some trade confluences📝
✅Weekly 50 EMA
✅Weekly order block rejection
✅Daily order block rejection
✅15’ order block identification
🔑 Remember, to participate in trading comes always with a degree of risk, therefore as professional risk managers it remains vital that we stick to our risk management plan as well as our trading strategies.
📈The rest, we leave to the balance of probabilities.
💡Fail to plan. Plan to fail.
🏆It has always been that simple.
❤️Good luck with your trading journey, I shall see you at the very top.
🎯Trade consistent, FRGNT X

GBPUSD SHORT FORECAST Q2 W25 D18 Y25GBPUSD SHORT FORECAST Q2 W25 D18 Y25
Professional Risk Managers👋
Welcome back to another FRGNT chart update📈
Diving into some Forex setups using predominantly higher time frame order blocks alongside confirmation breaks of structure.
Let’s see what price action is telling us today!
💡Here are some trade confluences📝
✅Weekly order block
✅15' order block
✅Intraday 15' break of structure
✅Tokyo ranges to be filled
🔑 Remember, to participate in trading comes always with a degree of risk, therefore as professional risk managers it remains vital that we stick to our risk management plan as well as our trading strategies.
📈The rest, we leave to the balance of probabilities.
💡Fail to plan. Plan to fail.
🏆It has always been that simple.
❤️Good luck with your trading journey, I shall see you at the very top.
🎯Trade consistent, FRGNT X

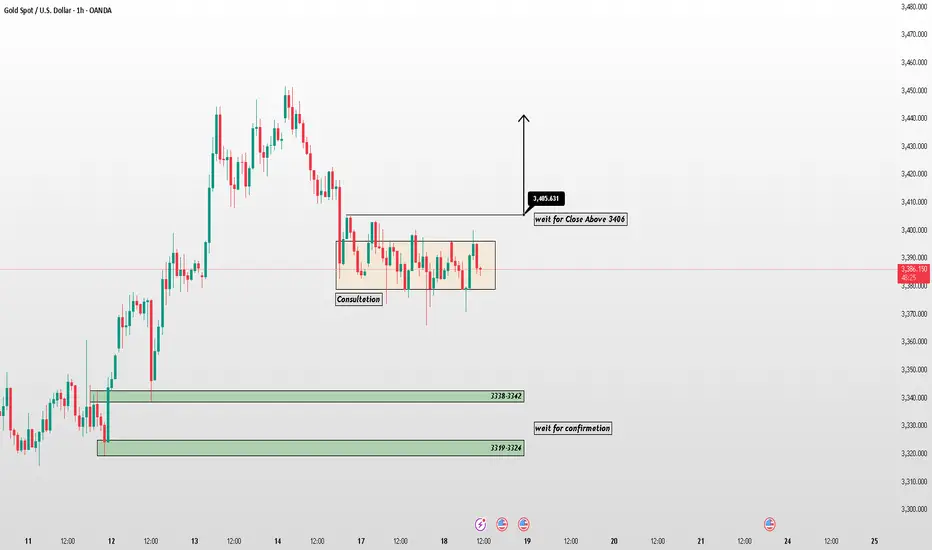
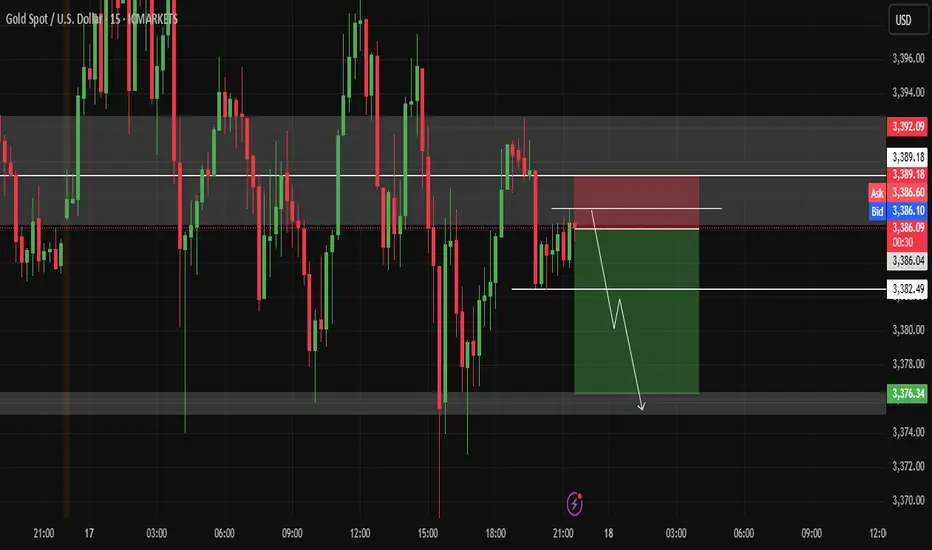
XAU/USD Price Action Update – June 18, 2025📊 XAU/USD Price Action Update – June 18, 2025
🔹Current Price: 3,386.58
🔹Timeframe: 1H
📌 Key Resistance Zone:
🔴 3406 – Intraday breakout level; needs a strong candle close above for bullish continuation
📌 Key Demand Zones:
🟢 3338–3342 – First support zone to watch if price drops
🟢 3319–3324 – Major demand; deeper pullback area for long entries
⚡️Bullish Scenario:
Price is consolidating in a tight range. A strong 1H close above 3406 could trigger a breakout targeting 3405.63 and beyond.
⚠️Bearish Scenario:
If price fails to close above resistance and breaks below the range, a drop toward 3338 or even 3319 could follow — confirmation needed before shorting.
🔍 FXFOREVER Insight:
✅ Price is ranging; don’t trade inside the box
✅ Wait for clean break and retest from either side
✅ Monitor structure shifts on 15M–1H timeframe for confirmation
#XAUUSD #GoldTrading #SmartMoneyConcepts #FXFOREVER #PriceAction #SupplyDemand #ForexSetup #ConsolidationBreakout #IntradayTrade
EURCHF SHORT FORECAST Q2 W25 D18 Y25EURCHF SHORT FORECAST Q2 W25 D18 Y25
Professional Risk Managers👋
Welcome back to another FRGNT chart update📈
Diving into some Forex setups using predominantly higher time frame order blocks alongside confirmation breaks of structure.
Let’s see what price action is telling us today! 👀
💡Here are some trade confluences📝
✅Weekly 50EMA Rejection
✅15' Order block
✅1H Order Block
✅Intra day bearish BOS
🔑 Remember, to participate in trading comes always with a degree of risk, therefore as professional risk managers it remains vital that we stick to our risk management plan as well as our trading strategies.
📈The rest, we leave to the balance of probabilities.
💡Fail to plan. Plan to fail.
🏆It has always been that simple.
❤️Good luck with your trading journey, I shall see you at the very top.
🎯Trade consistent, FRGNT X

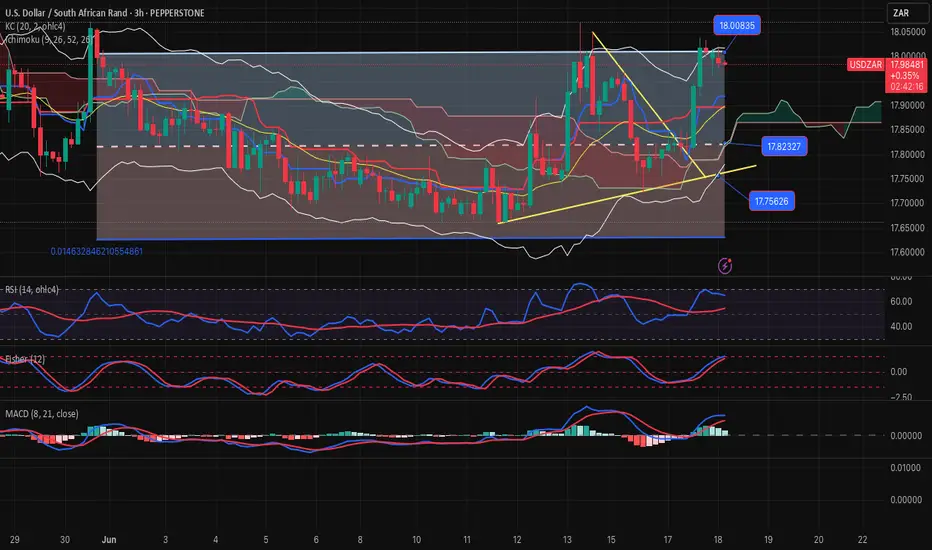
USDZAR-SELL strategy 3 hourly Reg. ChannelThe pair spiked and the "cautious" SELL idea did not pan out as we never had the break of 17.7500 support area. Right now, we are at the top of the channel, and even though it may spike above it, gravitational forces may likely drag it down again, as we are slightly overbought as well and a return towards 17.80s is possible. The USDX moved higher as well, but similarly it is slightly overdone.
Strategy SELL @ 17.9650-18.0500 and take profit near 17.7800-18.8050 area.
Medium-term still am seeing higher (see my 3D chart few days ago).

#Bitcoin Roadmap for 2025–2026 A Deep Corrective Scenario UnfoldI believe the major top for Bitcoin was already printed on May 21st, at $111,000.
From here, I expect a three-wave corrective structure to unfold:
• 🔻 First drop to $69,000
• 🔼 Then a relief bounce to $85,000
• 🔻 Followed by a deeper decline to $46,000
If Bitcoin breaks the historical ascending trendline after reaching $46,000, I anticipate a five-wave bearish structure to continue:
• Further drop to $33,000
• Temporary correction up to $45,000
• And finally, a capitulation wave towards $19,000
I know this may sound early or even extreme to some, but if you review my previous Bitcoin outlooks going back to 2014, you’ll notice that many of these scenarios—however bold—have eventually played out with precision.
📌 Invalidation Level:
This scenario would be invalidated if Bitcoin closes a weekly candle above $115,000.
Good luck, fellow traders—stay sharp and prepared. 🧠📉
⸻

SWING SHORT AUDCHFon weekly price back to weekly OB and last weekly candl was bearish
On Daily price engage in Daily SIBI but failed to give as reaction and last day
Price take PCH as liquidity after no reaction from Daily FVG
Last day was respected candle to downsides > that lead me to bearish BIAS
so in 4H was my entry point from 4H FVG
My SL above SWING HIGH

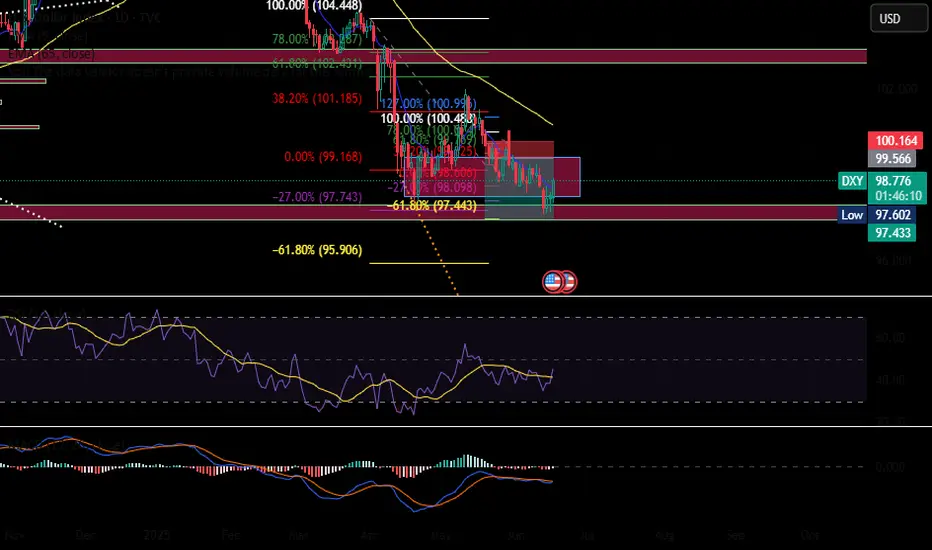
$DXYAs tensions rise in the Middle East, the dollar remains a safe haven.
We could see a temporary bullish run on the dollar as capital seeks safety.
But for me, Bitcoin was the first signal that smart money is shifting into alternative assets like Gold, Silver, and beyond.
Stay alert. The market speaks before the news does.
Opportunity for selling GOLDI see that XAUUSD has confirmed strong resistance, so I took a sell trade with it.
OIL🛢️ Oil is caught in an unbalanced price zone due to rising global tensions.
Prices have spiked and with that, inflation risks are back on the table.
Now here's the play I see forming:
📌 The Fed might choose not to cut interest rates as a way to cool inflation without printing more money.
📌 This also puts pressure on China to act since rising oil prices hurt their economy too, they may push Iran to scale back aggression in order to stabilize global markets.
Everything is connected. This isn’t just about oil it’s about global strategy, inflation control, and power dynamics.


18 june Nifty50 brekout and Breakdown leval
CALL (CE) – Bullish triggers
↑ 24,437 – 24,547 : Safe‑zone long entry
↑ 24,672: Hold CE while above this mark
↑ 24,780 : Opening‑S1 breakout, keep holding CE
↑ 24,930.00 : Turns bias positive; fresh CE can be added
↑ 25,083.00 : Entry level for aggressive longs
↑ 25,318.00 : Short‑cover zone; strong upside momentum possible
PUT (PE) – Bearish triggers
↓ 25,318.00 : If price closes back under, shift to PE (safe)
↓ 25,083 : PE in the “risky” reversal zone
↓ 24,930 : Bias flips negative; keep/add PE
↓ 24,780 : Opening‑R1 break; hold PE
↓ 24,672 : Continue PE below this level
↓ 24,535 : Unwinding zone – watch for fast drops
↓ 24,437 : Final downside support; trail PEs here
